0022-538X/95/$04.0010
Copyrightq1995, American Society for Microbiology
Longitudinal Assessment of Feline Immunodeficiency Virus
Kinetics in Plasma by Use of a Quantitative Competitive
Reverse Transcriptase PCR
LAURI J. DIEHL, CANDACE K. MATHIASON-D
UBARD, LYNNE L. O’NEIL,
AND
EDWARD A. HOOVER*
Department of Pathology, Colorado State University, Fort Collins, Colorado 80523
Received 22 November 1994/Accepted 19 January 1995
Cats infected with feline immunodeficiency virus (FIV) develop a disease syndrome similar to that caused by
human immunodeficiency virus type 1 (HIV-1) infection in humans. HIV-1 replication has been shown to
correlate with the disease stage and progression. To assess replication kinetics and disease progression in early
FIV infection, we developed a quantitative competitive reverse transcriptase PCR to measure the plasma virus
load at serial time points after virus exposure. We found that an early peak viremia immediately preceded the
onset of acute-phase symptoms in infected cats. Plasma virus levels remained high throughout the symptomatic
phase of infection, which lasted for 8 to 10 weeks, and then declined as clinical symptoms resolved; however,
all cats maintained significant plasma virus titers through 36 weeks postinfection. Early peak viral replication
coincided with the initial precipitous decline in circulating CD4
1T lymphocytes. These results indicate that
FIV kinetics are similar to those of HIV-1 during the acute and secondary phases of infection and that the
plasma FIV load correlates with the disease stage. These results serve to further develop the FIV model and
to enhance its usefulness for pathogenesis, vaccine development, and therapeutic studies related to HIV.
Feline immunodeficiency virus (FIV) infection in cats and
human immunodeficiency virus type 1 (HIV-1) infection in
humans result in similar disease syndromes characterized by a
progressive loss of CD4
1T cells (3, 24) and susceptibility to
opportunistic infection (12). Both HIV-1- and FIV-infected
individuals progress through a series of disease stages,
begin-ning with a transient acute-phase flu-like illness followed by a
prolonged asymptomatic period and a terminal symptomatic
phase (6, 11, 20). The similarities in disease manifestation and
progression suggest that FIV may serve as a useful animal
model for HIV-1 infection.
Recently, plasma virus replication has been shown to be
indicative of the disease stage and progression in
HIV-1-in-fected individuals. High levels of viral RNA are detectable in
peripheral blood mononuclear cells (PBMC), serum, and
plasma during the acute phase of infection (4, 5, 7, 10, 22).
Viral RNA levels then decline, indicating a down-regulation of
the replication associated with the transition to the clinically
asymptomatic phase of infection. Increased expression of viral
RNA in PBMC appears to be associated with an advanced
disease state (1) and predictive of accelerated disease
progres-sion (25).
Previous studies with FIV-infected cats have detected virus
expression by means of plasma cultures (17) and
nonquantita-tive reverse transcriptase PCR (16). These studies documented
the presence of FIV in plasma but did not provide information
on replication kinetics. We have developed a quantitative
com-petitive reverse transcriptase PCR (QC-PCR) method to
pro-vide a semiquantitative measure of viral RNA in plasma and to
characterize FIV replication kinetics following experimental
infection. These data provide insight into the progression of
FIV infection and can be compared with plasma titers from
HIV-1 and other lentivirus infections.
MATERIALS AND METHODS
Animals.Eight-week-old cats from a specific-pathogen-free breeding colony at Colorado State University were inoculated by intravenous injection of cell-free plasma from a cat infected with FIV subgroup B Amelda 2542. Blood collection for PCR (citrate), flow cytometry (EDTA), and serum was performed at weekly intervals for the first 9 weeks and at 2- to 4-week intervals thereafter. The clinical status of each cat was evaluated when the blood collection was performed.
Flow cytometry.Feline T-lymphocyte immunophenotype labeling was per-formed with monoclonal antibodies to feline CD4 (19) and CD8 (14) homologs as described by Dean et al. (8). Lymphocyte subset percentages were analyzed with a Coulter EPICS Profile II flow cytometer (Coulter Electronics, Hialeah, Fla.). Total CD41and CD81cell numbers were calculated from subset percent-ages, total leukocyte numbers, and lymphocyte percentages of total leukocytes.
QC-PCR primers and probe.A conserved region of the FIV gag gene was selected as the target sequence for PCR amplification. The GAG3 and GAG4 primers amplify a fragment either 293 bp (from wild-type FIV) or 272 bp (from the RNA competitor) in length. The primer sequences are as follows: GAG3 (nucleotides 1073 to 1094), TTGACCCAAAAATGGTGTCCA, and GAG4 (nucleotides 1366 to 1345), TTCTGCTTGTTGTTCTTGAGT. A 28-mer oligo-nucleotide probe (oligo-nucleotides 1216 to 1244), GCTGCAGATAAAGAAATAT TGGATGAAA, was designed to recognize both wild-type and competitor prod-ucts.
Competitor synthesis.An RNA competitor with a 21-bp internal deletion relative to wild-type FIV RNA was synthesized as shown in Fig. 1. A sense primer which incorporates the GAG3 primer sequence and an additional 10 bp which target a region of the FIV genome 21 bp 39of the GAG3 recognition site, giving a sequence of TTGATCCAAAAATGGTGTCCAGAAGGGTTAG for the primer GAG3new, was designed. GAG4 was used as the antisense primer. PCR amplification of the competitor DNA template was performed, with a complete FIV genome clone, Chi2489 (26), being used as the DNA source. The final PCR mixture contained 2.5 mM MgCl2, 200mM deoxyribonucleoside triphosphates
(dNTPs), 13commercial PCR buffer (Perkin-Elmer, Foster City, Calif.), 2 U of AmpliTaq DNA polymerase, and each primer at 0.1mM. This synthesis ap-proach is similar to the competitor template synthesis apap-proach described by Pistello et al. (23). The FIV product was cloned into the pCRII vector (Invitro-gen, San Diego, Calif.), which contains an Sp6 promoter to allow generation of an in vitro transcript for use as a positive control and competitive template for QC-PCR.
RNA preparation.The competitor RNA transcript was prepared as a runoff product of the cloned DNA template which was linearized at a NotI site located just 39to the FIV sequence insert. In vitro transcription was performed with commercially available reagents and the DNA template digested with RQ1 RNase-free DNase (Promega, Madison, Wis.). The RNA solution was then extracted three times with phenol-chloroform-isoamyl alcohol and once with chloroform-isoamyl alcohol and then was precipitated with ethanol. RNA was recovered by centrifugation, then dissolved in RNase-free water, and quantitated * Corresponding author. Mailing address: Department of Pathology,
Colorado State University, Fort Collins, CO 80523. Phone: (303) 491-7861. Fax: (303) 491-0523.
2328
on November 9, 2019 by guest
http://jvi.asm.org/
by measuring A260. Aliquots were stored at2708C until needed. Stocks were
checked for residual DNA contamination by PCR amplification, as described below, in reaction mixtures not containing reverse transcriptase.
Plasma samples were obtained by initial centrifugation for 10 min at 2003g.
The plasma was removed and then subjected to an additional 15 min of centrif-ugation at 2,8003g to clarify the plasma. The cell-free plasma was aliquoted and
stored at2708C until use. For the extraction of virion-associated RNA, 100ml of plasma per sample was prepared with QIAamp Blood Kit reagents (Qiagen, Inc., Chatsworth, Calif.), as per the product directions, and loaded onto spin columns. After it was washed to remove contaminants, viral RNA was eluted in 200ml of RNase-free water. The RNA was recovered by ethanol precipitation and resus-pended in 10.5ml of water per sample for cDNA synthesis. RNA recovery and ability to be amplified were tested by QC-PCR on plasma samples from three cats and were found to be the same for fresh plasma samples and for those which were stored frozen for 1 and 3 weeks.
QC-PCR.QC-PCRs were performed in a manner similar to that described for HIV-1 plasma virus quantitation (21). Sample RNA and 1ml of serially diluted competitor RNA containing from 102to 109copies of FIV RNA were added to
96-well plates, and cDNA synthesis was performed with random primers and commercially available reagents (cDNA Cycle Kit; Invitrogen). The samples were then amplified by hot-start PCR and the following 30-cycle program: 948C for 10 sec, 508C for 15 sec, and 728C for 10 sec. Each reaction mixture contained 2 mM MgCl2, 150mM dNTPs, 8 U of AmpliTaq (Perkin-Elmer), and each
primer at 0.5mM.
The samples were electrophoresed on 8% polyacrylamide gels to allow for the size separation of competitor and wild-type products. The products were visual-ized on ethidium bromide-stained gels and on autoradiographs after being blot-ted and probed with a32P-end-labeled probe. FIV RNA copy number values are
based on a comparison of competitor and wild-type band densities, which were determined from ethidium bromide-stained gels or autoradiographs with an IS-1000 Digital Imaging System (Alpha Innotech, San Leandro, Calif.). Limita-tions in the available plasma volume required us to use log diluLimita-tions of compet-itor RNA to cover the potential range of plasma viremia in FIV-infected cats, so viral RNA copy numbers are given to the nearest log dilution. This provided a semiquantitative measure of the number of RNA copies per milliliter of plasma.
Plasma culture.Pooled PBMC from naive cats were stimulated for 3 days with 5mg of concanavalin A (Sigma, St. Louis, Mo.) per ml and then plated at 23106
cells per well in 24-well tissue culture plates (Falcon; Becton Dickinson, Lincoln Park, N.J.). Thawed plasma was added in 20-, 200-, 500-, and 1,000-ml quantities with lymphocyte medium to bring the final culture volume to 2 ml per well. At 3 to 4 days postinfection (PI) and every 3 to 4 days thereafter, 1 ml of culture medium was removed from each well and replaced with fresh medium containing 100 U of human recombinant interleukin-2 (Cetus/Roche, Emeryville, Calif.) per ml. The cultures were maintained in this manner for 3 to 5 weeks.
Plasma harvested from PBMC cultures was monitored for the presence of virus by an enzyme-linked immunosorbent assay (ELISA) specific for the FIV p26 antigen (9). The tissue culture infectious dose was determined from the greatest plasma dilution capable of producing a PBMC infection as measured by two consecutive positive ELISA signals.
RESULTS
QC-PCR sensitivity.
The threshold sensitivity for QC-PCR
was determined to be 100 copies per reaction (100
m
l of
plasma) (Fig. 2). This produced an assay sensitivity of 1,000
copies per ml and 500 virions per ml, which is comparable to
that described by Piatak et al. for the detection of HIV-1 in
plasma (21). The results of a typical QC-PCR experiment are
shown in Fig. 3.
Plasma culture comparison.
End point dilution culture has
been the most commonly used technique for monitoring the
virus load in plasma samples. We performed parallel cultures
and QC-PCRs on serial frozen plasma samples from
FIV-infected cats to determine the relative sensitivities of these
techniques. QC-PCR and culture results from three cats for
the first 8 weeks following infection are shown in Fig. 4. Virus
could be detected in all animals by 2 weeks PI by QC-PCR and
by 3 weeks by plasma culture. Viral RNA titers were high,
ranging from 10
4to greater than 10
8FIV RNA copies per ml
during the 8-week period, and were consistently detectable. By
contrast, viral titers determined by end point dilution culture
were quite low and were not always within the detectability
limits of the assay. The maximum culture titer detected with
frozen plasma was 10 tissue culture infectious doses, which
corresponded to a positive signal from 200
m
l of plasma. Since
QC-PCR titers indicated plasma virus burdens were high early
in the FIV infection, the data suggest that the culture titers
were not reflective of the plasma virus burden.
[image:2.612.63.294.72.238.2]Plasma virus kinetics.
Longitudinal plasma virus titers for
[image:2.612.349.517.574.677.2]FIG. 1. Synthesis by PCR of an FIV RNA competitor with a 21-bp internal deletion. A sense primer incorporating the GAG3 primer sequence and an additional 10 bp which target a region 21 bp 39of the GAG3 recognition site and the GAG4 antisense primer were used to amplify a DNA competitor template. The amplification product was then cloned into the pCRII vector and transcribed from an Sp6 promoter site. The resultant RNA, containing GAG3 and GAG4 primer recognition sites and a 21-bp internal deletion, was then purified, quan-tified, and used as a competitor in QC-PCRs.
FIG. 2. Determination of QC-PCR sensitivity. Serial dilutions of the FIV RNA competitor were added to naive cat plasma and purified with QIAamp columns as described in Materials and Methods. The RNA samples then under-went cDNA synthesis and PCR as described in the text. Approximately 30% of each reaction volume was loaded on an 8% polyacrylamide gel and run at 200 V for 3 h. The PCR products were then electroblotted onto uncharged nylon membranes (Schleicher & Schuell, Keene, N.H.). A32P-end-labeled
oligonucle-otide probe was used for product detection. The numbers of RNA copies are as follows: lane 1, 109; lane 2, 108; lane 3, 107; lane 4, 106; lane 5, 105; lane 6, 104;
lane 7, 103; and lane 8, 102.
FIG. 3. Determination of plasma virus titer by QC-PCR. Each sample con-tained 100ml of plasma RNA from an infected cat and a serial dilution of competitor RNA. PCR was performed as described in Materials and Methods. The lanes contain products from 100ml of plasma and have the following numbers of FIV competitor RNA molecules: lane 1, 109
; lane 2, 108
; lane 3, 107
; lane 4, 106
; lane 5, 105
; lane 6, 104
; lane 7, 103
; and lane 8, 102
.
on November 9, 2019 by guest
http://jvi.asm.org/
four cats were monitored by QC-PCR (Fig. 5). Virus was
measured in cat 3222 for 6 weeks PI, at which time it was
euthanized because of profound anemia. Titers for the three
remaining cats were followed for 36 weeks PI. Peak plasma
virus levels occurred at 2 to 3 weeks PI and ranged from 1
3
10
7to 5
3
10
8copies of FIV RNA per ml of plasma, which
corresponds to 5
3
10
6to 2.5
3
10
8virions per ml. These levels
can be compared with the acute-phase virus loads of
approxi-mately 3.5
3
10
5to 2
3
10
7HIV RNA copies per ml (22). HIV
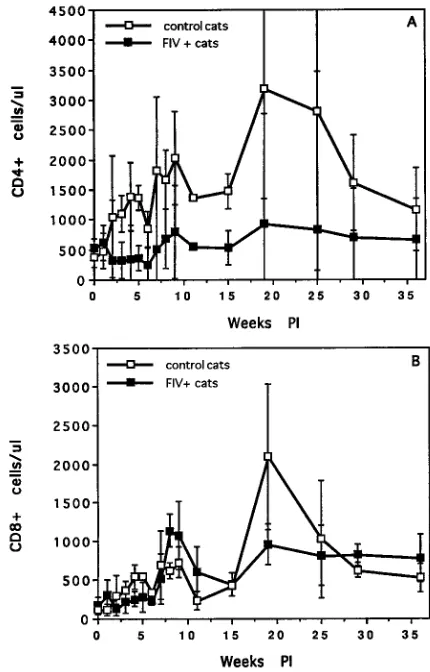
acute-phase virus loads peak shortly after the onset of clinical
signs. A significant drop in circulating CD4
1cell numbers was
concurrent with this spike in plasma viremia (Fig. 6A). At this
time, all cats had markedly enlarged lymph nodes, and three of
four were anemic (Table 1) during the phase of early high
plasma viremia.
FIV plasma RNA titers dropped by 1 to 2 logs after initial
peak viremia but then rebounded and remained high for 8 to
10 weeks PI. The cats were clinically symptomatic during this
period (Table 1). While the plasma viral RNA titers gradually
declined after the symptomatic phase, all the animals
main-tained significant virus loads throughout the 36-week period
monitored. CD4
1T-cell numbers remained subnormal but
stabilized after the acute phase of infection (8 to 10 weeks).
CD8
1cell numbers were moderately depressed during the
[image:3.612.325.540.72.408.2]acute phase of infection and then rebounded to levels similar
to those of the controls (Fig. 6B). All the animals became
clinically asymptomatic after about 10 weeks PI (Table 1), in
FIG. 4. Comparison of QC-PCR and plasma culture results. Virus titers of serial plasma samples from three cats (each type of symbol, e.g., the squares, represents one animal) were determined by QC-PCR (closed symbols) and plasma culture (open symbols). A plasma culture titer of 10 tissue culture infec-tious doses results when 200ml of plasma is required to obtain a positive culture. Comparative assays were performed for the first 8 weeks following infection.
[image:3.612.60.292.74.239.2]FIG. 5. Longitudinal analysis of plasma virus kinetics. Plasma FIV titers were determined by QC-PCR for three cats for 36 weeks following infection and for 6 weeks PI for another (cat 3222). FIV RNA copy number values were based on competitor and wild-type equivalence points determined by fluorescence inten-sities or autoradiograph band deninten-sities.
FIG. 6. T-cell subset numbers for control and FIV-infected cats. CD41(A) and CD81(B) cell numbers were determined by flow cytometric analysis with monoclonal antibodies recognizing the feline homologs of these T-cell markers. The error bars show standard deviations.
TABLE 1. Summary of clinical symptoms of FIV-infected cats
Clinical symptom Duration (weeks PI)
Cat 3218 Cat 3221 Cat 3222 Cat 3224
Enlarged lymph nodes 4–10 4–27 4–6 4–21
Diarrhea 5–6 30–31
Rough coat 4–6 5–7
Anemia 5–7 4–6 5–7
Cutaneous ulcers 5–13
Oral ulcers 29–32
Gingivitis 30–35
Diminished growth rate 5–14 5–14
Weight loss 4–6 21–36
on November 9, 2019 by guest
http://jvi.asm.org/
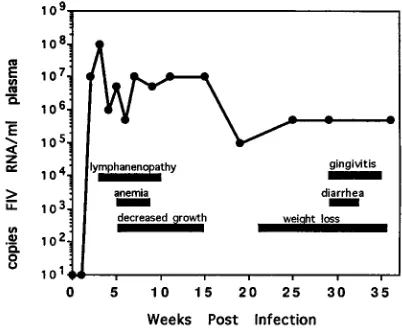
[image:3.612.59.299.499.683.2] [image:3.612.316.554.610.727.2]keeping with the lower plasma virus load. A single animal, cat
3224, redeveloped clinical symptoms after 20 weeks PI,
corre-sponding to an upturn in plasma virus levels (Fig. 7).
DISCUSSION
Cats infected with FIV develop a disease similar to that
associated with HIV-1 infection. High levels of HIV-1
replica-tion are associated with the acute phase of infecreplica-tion (4, 10, 22)
and subsequently are predictive for rapid progression (25).
Our analysis of FIV RNA loads demonstrates an initial burst
of FIV replication resulting in peak plasma viremia
immedi-ately prior to the onset of clinical signs. Early titers for cats
infected with the uncultured FIV field isolate used in this
study, FIV-B Amelda 2542, were 1 to 2 logs higher than those
described for HIV-1 infection. However, acute-phase HIV-1
plasma virus titers were determined for clinically symptomatic
patients (22), a point at which our experimentally infected cats
have very similar titers. While FIV titers varied from week to
week, plasma viremia remained high during the acute, or
symptomatic, phase of infection.
Transition from the acute to the asymptomatic phase of FIV
infection was marked by a gradual decline in plasma viremia
and a stabilization of CD4
1cell numbers. Despite this decline,
FIV plasma titers remained high well into the asymptomatic
period, indicating active virus replication. A similar pattern has
been described for HIV-1 infection (22). Thus, as for HIV-1,
the FIV plasma virus load appears to be indicative of the
disease stage.
The presence of FIV in plasma has previously been detected
by culture, with activated PBMC (16) or a T-cell line (17) being
used as target cells. By comparison with the QC-PCR, plasma
cultures were far less sensitive and often failed to detect virus
in animals with high QC-PCR titers. Piatak et al. (22) showed
results similar to ours in a longitudinal analysis of HIV-1
plasma titers by QC-PCR and plasma culture, although our
culture titers were significantly lower than those which have
been described for HIV.
When FIV plasma cultures have been done by infection of
activated PBMC targets, as in our study, virus detection is low
and variable (16). Higher titers have been found when the
MYA-1 T lymphoblastic cell line (17) was used as the infection
centage of T lymphocytes than human and simian PBMC do
(2, 8), the lower number of infectible target cells reduces the
plasma culture sensitivity. Unlike the sensitivities for plasma
culture, FIV QC-PCR sensitivity is comparable to that
de-scribed for HIV-1 and is therefore more effective for
monitor-ing plasma viremia.
In summary, we show that QC-PCR is an effective and
sen-sitive tool for monitoring FIV replication kinetics. Our results
indicate that FIV kinetics are quite similar to those of HIV-1
during the acute and asymptomatic phases of infection and
that plasma viremia is indicative of the disease stage. These
results serve to further develop the FIV model and to enhance
its usefulness for pathogenesis, vaccine development, and
ther-apeutic studies related to HIV.
ACKNOWLEDGMENTS
This work was supported by a Resident Research Award from Solvay, Inc.; grant AI33773 from DAIDS, NIAID, NIH, DHHS; and a grant from the Morris Animal Foundation.
REFERENCES
1. Aoki-sei, S., R. Yarchoan, S. Kageyama, D. T. Hoekzema, J. M. Pluda, K. M.
Wyvill, S. Broder, and H. Mitsuya.1992. Plasma HIV-1 viremia in HIV-1 infected individuals assessed by polymerase chain reaction. AIDS Res. Hum. Retroviruses 8:1263–1270.
2. Axberg, I., M. J. Gale, B. Afar, and E. A. Clark. 1991. Characterization of T-cell subsets and T-cell receptor subgroups in pigtail macaques using two-and three-color flow cytometry. J. Clin. Immunol. 11:193–204.
3. Barlough, J. E., C. D. Ackley, J. W. George, N. Levy, R. Acevedo, P. F. Moore,
B. A. Rideout, M. D. Cooper, and N. C. Pedersen.1991. Acquired immune dysfunction in cats with experimentally induced feline immunodeficiency virus infection: comparison of short-term and long-term infections. J. Ac-quired Immune Defic. Syndr. 4:219–227.
4. Baumberger, C., S. Kinloch-de-Loes, S. Yerly, B. Hirschel, and L. Perrin. 1993. High levels of circulating RNA in patients with symptomatic HIV-1 infection. AIDS 7:S59–S64.
5. Clark, S. J., M. S. Saag, W. D. Decker, S. Campbell-Hill, J. L. Roberson, P. J.
Veldkamp, J. C. Kappes, B. H. Hahn, and G. M. Shaw.1991. High titers of cytopathic virus in plasma of patients with symptomatic primary HIV-1 infection. N. Engl. J. Med. 324:954–960.
6. Cooper, D. A., J. Gold, P. Maclean, B. Donovan, R. Finlayson, T. G. Barnes,
H. M. Michelmore, P. Brooke, and R. Penny.1985. Acute AIDS retrovirus infection. Definition of a clinical illness associated with seroconversion. Lan-cet 8428:537–540.
7. Daar, E. S., T. Moudgil, R. D. Meyer, and D. D. Ho. 1991. Transient high levels of viremia in patients with primary human immunodeficiency virus type 1 infection. N. Engl. J. Med. 324:961–964.
8. Dean, G. A., S. L. Quackenbush, C. D. Ackley, M. D. Cooper, and E. A.
Hoover.1991. Flow cytometric analysis of T-lymphocyte subsets in cats. Vet. Immunol. Immunopathol. 28:327.
9. Dreitz, M. J., S. W. Dow, S. A. Fiscus, and E. A. Hoover. Unpublished data. 10. Graziosi, C., G. Pantaleo, L. Butini, J. F. Demarest, M. S. Saag, G. M. Shaw,
and A. S. Fauci.1993. Kinetics of human immunodeficiency virus type 1 (HIV-1) DNA and RNA synthesis during primary HIV-1 infection. Proc. Natl. Acad. Sci. USA 90:6405–6409.
11. Ishida, T., and I. Tomoda. 1990. Clinical staging of feline immunodeficiency virus infection. Jpn. J. Vet. Sci. 52:645–648.
12. Ishida, T., T. Washizu, K. Toriyabe, S. Motoyoshi, I. Tomoda, and N. C.
Pedersen.1989. Feline immunodeficiency virus infection in cats of Japan. J. Am. Vet. Med. Assoc. 194:221–225.
13. Israel, Z. R., G. A. Dean, D. H. Maul, S. P. O’Neil, M. J. Dreitz, J. I. Mullins,
P. N. Fultz, and E. A. Hoover.1993. Early pathogenesis of disease caused by SIVsmmPBj14 molecular clone in macaques. AIDS Res. Hum. Retroviruses
9:277–286.
14. Klotz, F. W., and M. D. Cooper. 1986. A feline thymocyte antigen defined by a monoclonal antibody (FT2) identifies a subpopulation of non-helper cells capable of specific cytotoxicity. J. Immunol. 136:2510.
[image:4.612.76.277.74.239.2]15. Letvin, N. L., and N. W. King. 1990. Immunologic and pathologic manifes-tations of the infection of rhesus monkeys with simian immunodeficiency virus of macaques. J. Acquired Immune Defic. Syndr. 3:1023–1040. FIG. 7. Comparison of plasma virus loads and durations of clinical
symp-toms. Plasma viremia for cat 3224 was determined by QC-PCR as described in Materials and Methods. The symptoms were monitored during weekly physical examinations of the infected cats. The horizontal bars indicate the durations of selected clinical symptoms, and the line indicates the magnitudes of plasma viremia over time postinfection.
on November 9, 2019 by guest
http://jvi.asm.org/
16. Matteucci, D., F. Baldinotti, P. Mazzetti, M. Pistello, P. Bandecci, R.
Ghilar-ducci, A. Poli, F. Tozzini, and M. Bendinelli. 1993. Detection of feline immunodeficiency virus in saliva and plasma by cultivation and polymerase chain reaction. J. Clin. Microbiol. 31:494–501.
17. Meers, J., W. F. Robinson, G. M. del Fierro, M. A. Scoones, and M. A.
Lawson.1992. Feline immunodeficiency virus: quantification in peripheral blood mononuclear cells and isolation from plasma of infected cats. Arch. Virol. 127:233–243.
18. Molina, J. M., F. Ferchal, S. Chevret, V. Barateau, C. Poirot, F. Morinet, and
J. Modai.1994. Quantification of HIV-1 virus load under zidovudine therapy in patients with symptomatic HIV infection: relation to disease progression. AIDS 8:27–33.
19. O’Reilly, K. L., and E. A. Hoover. 1993. Characterization of a panel of monoclonal antibodies specific for subsets of feline leukocytes, p. 38. In Abstracts of the International Feline Retrovirus Symposium. W. A. F. Tompkins, Raleigh, N.C.
20. Pedersen, N. C., E. W. Ho, M. L. Brown, and J. K. Yamamoto. 1987. Isolation of a T-lymphotropic virus from domestic cats with an immunodeficiency-like syndrome. Science 235:790–793.
21. Piatak, M., K. C. Luk, B. Williams, and J. D. Lifson. 1993. Quantitative competitive polymerase chain reaction for accurate quantitation of HIV DNA and RNA species. BioTechniques 14:70–80.
22. Piatak, M., M. S. Saag, L. C. Yang, S. J. Clark, J. C. Kappes, K. C. Luk, B. H.
Hahn, G. M. Shaw, and J. D. Lifson.1993. High levels of HIV-1 in plasma during all stages of infection determined by competitive PCR. Science 259: 1749–1754.
23. Pistello, M., S. Menzo, M. Georgi, L. DaPrato, G. Cammarota, M. Clementi,
and M. Bendinelli.1993. Use of a competitive PCR to quantitate FIV genomes in the tissues of infected cats, p. 76. In Abstracts of the Interna-tional Feline Retrovirus Symposium. W. A. F. Tompkins, Raleigh, N.C. 24. Saag, M. S. 1994. Evolving understanding of the immunopathogenesis of
HIV. AIDS Res. Hum. Retroviruses 10:887–892.
25. Saksela, K., C. Stevens, P. Rubenstein, and D. Baltimore. 1994. Human immunodeficiency virus type 1 mRNA expression in peripheral blood cells predicts disease progression independently of the numbers of CD41 lym-phocytes. Proc. Natl. Acad. Sci. USA 91:1104–1108.
26. Sodora, D., and J. I. Mullins. Unpublished data.