Page | 1
Obesity and type 2 diabetes are important risk factors underlying previously undiagnosed cirrhosis in general practice: a cross-sectional study using Transient Elastography
David J Harman1, Stephen D Ryder1, Martin W James1, Emilie A Wilkes1, Timothy R Card1,2, Guruprasad P Aithal1,3*, Indra Neil Guha1,3* *=joint senior authors
1 National Institute for Health Research (NIHR) Nottingham Biomedical Research Centre (BRC), Nottingham University Hospitals NHS Trust and University Of Nottingham, Nottingham, NG7 2UH, United Kingdom1
(DJ Harman – Clinical Research Fellow in Hepatology; SD Ryder, MW James, EA Wilkes –
Consultant Hepatobiliary Physician; TR Card - Clinical Associate Professor of GI epidemiology and Consultant Gastroenterologist; GP Aithal – Professor of Hepatology and Consultant Hepatobiliary Physician; IN Guha - Clinical Associate Professor of Hepatology and Consultant Hepatobiliary Physician)
2Division of Epidemiology and Public Health, Clinical Sciences Building Phase 2, City Hospital Campus, University of Nottingham, Nottingham, NG5 1PB, United Kingdom2
3Nottingham Digestive Diseases Centre, University of Nottingham
Corresponding Author: Dr Neil Guha
NIHR Nottingham Biomedical Research Centre E Floor, West Block
Queens Medical Centre, Derby Road,
Nottingham NG7 2UH
Email: neil.guha@nottingham.ac.uk
Telephone: 01159249924 ext 70609
Short Title: Undiagnosed cirrhosis in general practice
Manuscript Word Count (incl. References): 5,751 words Abstract Word Count: 250 words
Tables: 5 Figures: 2
Abbreviations (in order of appearance):
ALD, alcoholic liver disease; NAFLD, non-alcoholic fatty liver disease; TE, transient
elastography; BMI, body mass index; kPa, kilopascals; HDL, high density lipoprotein; ALT, alanine aminotransferase; OR, odds ratio; T2DM, type 2 diabetes mellitus; CLD, chronic liver disease; NASH, non-alcoholic steatohepatitis; PHG, portal hypertensive gastropathy; LSM, liver stiffness measurement
Keywords:
Page | 2
Abstract
Background:Rising cirrhosis incidence and mortality in the United Kingdom has been attributed predominantly to excess alcohol consumption. However, metabolic risk factors such as type 2 diabetes and obesity may also be important.
Aim:
To screen at-risk individuals in general practice for undetected cirrhosis using transient elastography and study the risk factors underlying these cases.
Methods:
The study was undertaken in 4 general practices (adult patient population 20,868) between February 2012 and September 2014. Patients with defined risk factors for chronic liver disease (hazardous alcohol use and/or type 2 diabetes) were identified from the General Practice electronic records and invited for transient elastography. Elevated liver stiffness was defined as ≥8 kilopascals. Cirrhosis was confirmed by established histological, radiological and biochemical methods.
Results:
2,368 patients were invited for transient elastography and 899/919 who attended (97.8%) had valid measurements. Of these 230 patients had elevated liver stiffness (25.6%) and 27 had cirrhosis (2.9%). Risk factors for new cirrhosis diagnoses were obesity and/or type 2 diabetes in 16 patients (59.3%), alcohol alone in 3 (11.1%) and both alcohol and obesity and/or diabetes in 8 (29.6%). Presence of cirrhosis was significantly increased in obese patients with type 2 diabetes or hazardous alcohol use compared to non-obese (odds ratio 9.4 (95% CI 2.2-40.9) and 5.6 (95% CI 1.6-19.7) respectively).
Conclusions:
The number of new cases of cirrhosis diagnosed clearly demonstrates that existing estimates of prevalence are likely to be gross underestimates. Obesity was an important risk factor for cirrhosis within both alcohol users and diabetics.
Page | 3
Introduction:
Chronic liver disease continues to be a significant public health burden. In England, diagnosed cirrhosis incidence has increased by 50.6% between 1998 and 20091, and subsequently cirrhosis is now the third commonest cause of premature mortality in persons aged 20-542. Population level alcohol consumption is still considered the major driver of liver-related mortality, and up to 62% of detected cirrhosis cases in the population are attributed to alcoholic liver disease (ALD)1,3. However, the rising population prevalence of metabolic syndrome risk factors means that non-alcoholic
fatty liver disease (NAFLD) and related cirrhosis are becoming a more significant issue. Obesity prevalence in the United Kingdom has risen by 54% in men and 65%
in women between 1993 and 2012, and the prevalence of type 2 diabetes is forecast to double between 2000 and 2030. Non-alcoholic fatty liver disease is therefore likely to become the leading cause of liver cirrhosis in the near future, and indeed in the
USA NAFLD has already overtaken alcoholic liver disease as a cause of listing for liver transplantation4. Several studies have demonstrated the important synergism between body mass index and alcohol consumption, and the increased risk of progressive fibrosis5, cirrhosis diagnoses6 and liver-related death7,8. However, as NAFLD is discounted as a diagnosis in the presence of a specific cut-off of alcohol
consumption (such as a weekly consumption of >14 units in women and >21 units in men), all cirrhosis in those with an alcohol consumption above the cut-off will be
coded as alcohol related cirrhosis9. The overall impact of obesity, type 2 diabetes and other metabolic risk factors on cirrhosis incidence and liver-related outcomes is
therefore likely to be greatly underestimated by current practice.
Page | 4 disease among people with hazardous alcohol use and people with Type 2
diabetes10. We extended this study with additional recruitment, to study the association of alcohol and metabolic risk factors with chronic liver disease in a
community setting. The aims of the current study are to characterise new clinically significant liver disease and cirrhosis within the screened population, and to identify
the risk factors associated with elevated liver stiffness and cirrhosis.
Materials and Methods:
Study Setting
This was a cross-sectional study with recruitment from four general medical
practices in Nottingham, United Kingdom. Of these, 2 primary care medical practices were located in an affluent suburban borough, whilst the remaining 2 practices were situated in predominantly deprived areas of the City of Nottingham District. The study
period was 31 months from February 2012 to September 2014. All practices utilised the SystmOne general practice records system (TPP, United Kingdom) which
facilitates live recording of clinical, anthropometric and biochemical patient data. Data is prospectively entered during all patients’ primary care appointments with
General Practitioners and Practice Nurses. The same database is used for patients’
standard clinical care.Data is stored as searchable numeric data or prospectively coded with ‘Read Codes’ (clinical encoding of parameters including patient
demographics, diagnoses, clinical signs and laboratory test results). The ‘Read
Codes’ are based on electronic clinical management systems, in which the primary
care clinician selects codes to record directly into the computerised medical record
Page | 5 Committee (study identification 13/EM/0123), and written informed consent was gained from patients.
Patient Selection
Patient selection for the current study has been previously published10. Briefly, adult patients (defined as aged 18 years or older) with selected risk factors for lifestyle related chronic liver disease were identified directly from the general medical practice electronic patient records. The electronic record search was performed at
the commencement of the study. The studied risk factors were:
a) Hazardous alcohol use – this was defined as presence of any of i) >14 units per
week ethanol consumption for women or >21 units per week ethanol consumption for men, ii) alcohol AUDIT questionnaire score ≥811 or iii) presence of Read codes
related to hazardous, harmful or dependent alcohol consumption. Patients were not included as hazardous alcohol consumers if alcohol consumption data had not been
recorded in the 5 years prior to study.
b) Type 2 Diabetes – Presence of Read codes related to a diagnosis of type 2
diabetes.
In addition, 3% of the study patients from the 4 studied practices were patients with persistently elevated serum alanine aminotransferase (ALT) levels (>35IU/L for women, >45IU/L for men), who had neither hazardous alcohol intake nor type 2
Page | 6 Patients were excluded from the study if i) there was definitive evidence of hepatic fibrosis or cirrhosis already identified from previous investigations, ii) there was a contraindication to transient elastography (pregnancy, indwelling cardiac device), iii)
they had metastatic malignancy, iv) they were unable to consent to investigation due to significant cognitive impairment, or v) they were housebound and could not attend
the community practice. In addition, patients who presented with symptoms of decompensated liver cirrhosis (e.g. jaundice, variceal bleeding, ascites) during the
study period were excluded and instead triaged straight to urgent hospital-based care rather than being screened using TE in primary care.
Liver Stiffness Measurement
The methodology for invitation and screening of patients from the suburban medical
practices has been published previously, and included an initial screening blood biomarker prior to transient elastography10. Patients from the inner city practices were invited directly for an appointment to undergo transient elastography. The scan was performed by one of three nurses, all of whom had received formal training in liver stiffness measurement and had previously performed more than two hundred
liver stiffness acquisitions in the hospital setting. Our nurse led transient
elastography service has been established since 2009 and we have published the
evaluation of this service in 2012 showing only 5.3 % of scans were unreliable12. Patients were advised to be fasted for the examination13. Patients with a body mass index (BMI) of <35kg/m2 underwent TE examination with the Fibroscan FS402 device (Echosens) M probe in the general practice setting. Due to a high risk of unreliable or failed liver stiffness acquisition with body mass index (BMI) measures
Page | 7 BMI>35kg/m2, and those with an initial failed liver stiffness acquisition using the M probe, underwent transient elastography in the hospital using the Fibroscan FS502
device XL probe.
Liver stiffness acquisition failure was defined as inability to obtain 10 valid liver
stiffness measurements. Participants with failure of liver stiffness acquisition were excluded from the analysis. A successful acquisition was deemed unreliable if liver stiffness was ≥7.1 kilopascals and the interquartile range/median ratio was greater
than 0.3 as per manufacturer guidance15. A liver stiffness threshold of 8.0 kilopascals or greater was used to define elevated liver stiffness, and hence clinically significant
liver disease, in keeping with a previous large general population study in France16 in which this cut-off was shown to be an accurate predictor of liver fibrosis on biopsy. The same liver stiffness threshold was used for patients with both alcohol and
non-alcohol related liver risk factor as although non-alcohol-related liver fibrosis potentially results in slightly higher liver stiffness results than NAFLD, a recent meta-analysis of
previous hospital studies has shown good accuracy for predicting significant (F2) liver fibrosis in patients with alcoholic liver disease using very similar liver stiffness cutoffs17.
Patients with elevated liver stiffness results, including high but unreliable
acquisitions, were reviewed by a visiting consultant hepatologist in the community (one of authors SR, EW, MJ, GPA or ING). Alternative causes of chronic liver
Page | 8 ultrasonography, liver biopsy and endoscopy were arranged on a case-by-case basis.
Following the transient elastography appointment, patient’s electronic primary care
records were retrospectively examined to collect recent relevant clinical,
anthropometric and laboratory test data (definitions of these risk factors are shown in Online Appendix 1). As waist circumference was not routinely measured, obesity was defined as the presence of body mass index≥30kg/m2. Subsequently, metabolic
syndrome was defined according to the International Diabetes Federation definition as presence of obesity with 2 or more metabolic risk factors (hypertension, impaired
fasting glucose or type 2 diabetes, raised triglycerides or lowered high density lipoprotein cholesterol)18.
Cirrhosis Detection and Associated Risk Factors
Cirrhosis was diagnosed clinically at the discretion of the visiting consultant
hepatologist. To increase the positive predictive value of cirrhosis diagnoses, given the need for future cirrhosis surveillance investigations, cirrhosis diagnoses were not based upon an elevated liver stiffness measurement alone. Rather cirrhosis
diagnoses were assigned using elevated liver stiffness measures in combination with either histological evidence of cirrhosis, endoscopic evidence of portal hypertension
or ultrasound evidence of cirrhosis or portal hypertension (i.e. nodular liver surface, splenomegaly or reversal of portal vein flow). Cirrhosis diagnoses were classified as alcoholic liver disease if hazardous alcohol use was present in the absence of
obesity or type 2 diabetes, as non-alcoholic fatty liver disease in the presence of type 2 diabetes or obesity, but without hazardous alcohol use, and as dual aetiology if a
Page | 9 The number and aetiology of cirrhosis diagnoses in the general practice population before study commencement were obtained by searching the electronic patient
records.
To evaluate the impact of the defined clinical and metabolic risk factors on the presence of significant liver disease, we compared the percentage of elevated liver
stiffness and cirrhosis cases for patients with and without these risk factors.
Subgroup analyses examining patients with hazardous alcohol use, type 2 diabetes
and both hazardous alcohol and type 2 diabetes were performed.
Statistics
Statistical analysis was performed using Stata version 13.1 (StataCorp LP). Categorical data are presented as number (percentage). Continuous data are presented as medians (range) (as all were non-normally distributed). Demographic,
anthropometric and laboratory test data were compared between patients with and without cirrhosis using the Mann-Whitney test as appropriate. Categorical variables were compared using chi-squared test, or Fisher’s exact test where appropriate.
In order to further evaluate the association of clinical and metabolic risk factors with clinically significant liver disease, for those risk factors which were associated with
both presence of elevated liver stiffness and cirrhosis we report univariate odds ratios and 95% confidence intervals comparing patients with and without these
Page | 10
Results
Study Population
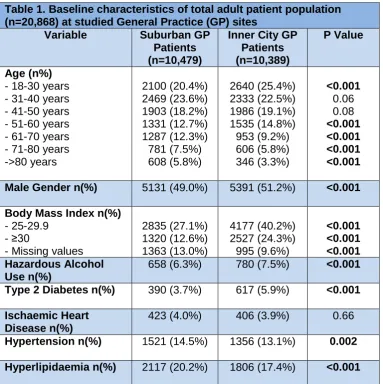
The total adult population in the studied primary care centres at commencement of
the study was 20,868 patients (see table 1). Hazardous alcohol use was detected in 1,438 patients (6.9%) and 1,007 patients (4.8%) had type 2 diabetes. There were
2,368 individual patients with hazardous alcohol use or type 2 diabetes identified from the electronic patient record search, of whom 346 were excluded (see Figure 1). Subsequently 919/2,022 patients (45.4%) attended the transient elastography
appointment; 71.3% of eligible patients with type 2 diabetes attended whilst 30.7% of patients with hazardous alcohol use attended. Overall, 401 patients had hazardous
alcohol use, 554 patients had type 2 diabetes (including 65 patients (7.1%) with both risk factors present), and 29 had raised ALT without either hazardous alcohol use or type 2 diabetes. Of note, of the hazardous alcohol use group, 17 (4.2% of the group)
had subsequently become abstinent and a further 38 (9.5%) had moderated their alcohol intake to within recommended safe drinking limits prior to the time of TE.
Compared to non-attenders, transient elastography appointment attenders were significantly less likely to be hazardous alcohol users (43.6% vs. 83.0%; p<0.001), significantly less likely to be male (65.7% vs. 71.7%; p=0.004) and were significantly
older (mean age 59.1 years vs. 47.8 years; p<0.001).
Elevated Liver Stiffness and Cirrhosis Diagnoses
Page | 11 patients required an XL probe examination in the hospital setting. Unreliable liver stiffness acquisitions occurred in 44 patients (4.9%).
Overall, elevated liver stiffness of ≥8 kilopascals was observed in 230 patients
(25.6%). Elevated liver stiffness was present in 19.2% of patients with hazardous alcohol use, 31.5% of patients with type 2 diabetes, 37.5% of patients with both
hazardous alcohol use and type 2 diabetes, and 45.3% of patients with raised ALT levels. On further testing a single case of primary biliary cholangitis in a patient with coexistent non-alcoholic steatohepatitis was identified. A large number of clinical and
anthropometric risk factors were more prevalent in patients with elevated liver stiffness compared to normal liver stiffness values (see table 2). However, both
hazardous alcohol use prevalence (47.3% vs. 32.6%; p<0.001) and median alcohol consumption (8 vs. 3 units of ethanol per week; p<0.001) were significantly lower in
patients with elevated liver stiffness.
Prior to study commencement, there were 23 diagnosed cases of liver cirrhosis in the population of the studied general practices who were excluded from study. All
cases had been diagnosed on the basis of histological evidence of liver cirrhosis, or presentation to hospital with decompensated liver cirrhosis. Their cirrhosis
aetiologies were alcoholic liver disease (14 patients), Hepatitis B or C (5), NAFLD (1)
and other (3).
During the study, 209 patients with elevated liver stiffness attended and were
reviewed in hepatology clinics and 27 of these were newly diagnosed with liver cirrhosis during the study period (3% of valid liver stiffness results). This, therefore,
Page | 12 hazardous alcohol use, 3.7% of patients with type 2 diabetes, 7.7% of patients with both hazardous alcohol use and type 2 diabetes, and 5.6% of patients with raised ALT levels. Relevant clinical characteristics of these patients are displayed in Table
3. Cirrhosis aetiologies were NAFLD in 16 patients (59.3% of newly detected
cirrhosis cases), alcoholic liver disease in 3 patients (11.1%) and risk factors for both
ALD and NAFLD in the remaining 8 patients (29.6%). Definitive evidence of portal hypertension was found in 4 patients on further investigation (3 patients with small
varices and 1 patient with ascites) and features suggestive of portal hypertension observed in 6 others (5 patients with splenomegaly and 1 patient with portal vein flow reversal on ultrasonography).
Compared to patients with normal liver stiffness, patients with cirrhosis had significantly greater prevalence of obesity (81.6% vs. 31.8%; p=<0.001), greater prevalence of metabolic syndrome (59.3% vs. 25.5%; p=0.002), and higher
prevalence of raised ALT levels (33.3% vs 13.0%; p=0.006). Therefore, normal ALT values were seen in 66.7% of patients with cirrhosis.
The total number of patients with cirrhosis was 50 following the study, when
considering known patients with cirrhosis pre-study (23 patients) and additional new diagnoses detected due to the study (27 patients). Overall 20 out of 1,007 known
patients with type 2 diabetes in the studied general practices (2%), and 25 out of 1,438 known hazardous alcohol drinkers (1.7%) were known to have cirrhosis upon
Page | 13 Impact of Clinical Parameters on Elevated Liver Stiffness and Cirrhosis
Diagnoses
A comparison of the clinical and anthropometric factors associated with elevated
liver stiffness in the subgroups of patients with hazardous alcohol use, type 2 diabetes and both risk factors are displayed in Table 4. Variables associated with
elevated liver stiffness in subgroups of patients with either hazardous alcohol use or type 2 diabetes were obesity ((44.0% vs. 20.3%; p<0.001) and (67.8% vs. 42.6%;
p<0.001) respectively), body mass index measurement ((median BMI 28.7 vs. 25.7; p<0.001) and (median BMI 32.45 vs. 28.9; p<0.001) respectively), metabolic
syndrome ((26.7% vs. 8.9%; p<0.001) and (63.7% vs. 42.9%; p<0.001) respectively)
and raised ALT level ((33.3% vs. 13.3%; p<0.001) and (26.9% vs. 7.6%; p<0.001) respectively). In addition, BMI measurement was associated with elevated liver
stiffness in patients with both hazardous alcohol use and type 2 diabetes (median BMI 32.75 vs. 28.05; p<0.001). Corresponding data for cirrhosis is not provided due
to too small patient numbers with cirrhosis within the analysed subgroups.
Given their association with both elevated liver stiffness and cirrhosis diagnoses in
the overall study population (tables 2 and 4), the impact of obesity, metabolic syndrome and raised ALT on the diagnosis of elevated liver stiffness and cirrhosis diagnoses were evaluated further for subgroups of 391 patients with hazardous
alcohol use, 543 patients with type 2 diabetes and 64 patients with both of these risk factors.
Hazardous alcohol users with obesity were significantly more likely to have elevated liver stiffness than hazardous alcohol users without obesity (Odds Ratio 3.1; 95% CI
Page | 14 3.3; 95% CI 1.8-5.8). Likewise patients with type 2 diabetes and obesity were
significantly more likely to have elevated liver stiffness than non-obese patients with type 2 diabetes (OR 2.9; 95% CI 1.9-4.2), as were those with type 2 diabetes and
the metabolic syndrome (OR 2.4; 95% CI 1.6-3.5) or those with type 2 diabetes and raised ALT levels (OR 4.5; 95% CI 2.7-7.5). No significant associations were seen in
those patients with both hazardous alcohol use and type 2 diabetes for elevated liver stiffness (see Table 5a).
Hazardous alcohol users with obesity were significantly more likely to be diagnosed with cirrhosis than non–obese hazardous alcohol users (odds ratio 5.6; 95% CI
1.6-19.7; cirrhosis prevalence 7.3% vs. 1.4%), and similarly obese patients with type 2
diabetes were more likely to be so diagnosed than non-obese patients with type 2 diabetes (OR 9.4; 95% CI 2.2-40.9; 6.6% vs. 0.7%). Patients with hazardous alcohol use, type 2 diabetes and obesity had a cirrhosis prevalence of 13.3%, although this
was not statistically significantly greater than patients with hazardous alcohol use and type 2 diabetes alone (OR 5.1; 95%CI 0.5-48.2). The associations with obesity
are also displayed graphically in Figure 2. Patients with type 2 diabetes and the metabolic syndrome were significantly more likely to be diagnosed with cirrhosis than patients with type 2 diabetes without metabolic syndrome (OR 4.4; 95% CI 1.4-13.2;
cirrhosis prevalence 6.0% vs. 1.4%). There were no significant associations between raised ALT levels and cirrhosis diagnoses in any of the studied groups (see table
Page | 15
Discussion
Key Findings
The current study investigates cirrhosis detection and risk factors for liver disease in
primary care using transient elastography. Following screening of 919 patients with hazardous alcohol use, type 2 diabetes or raised ALT levels, using Transient
Elastography and subsequent confirmative investigations, we identified 27 previously undiagnosed cases of cirrhosis, to supplement the 23 cases of cirrhosis that had been previously detected in this population. Hazardous alcohol users were less likely
to attend and when they did, had a lower risk of cirrhosis than did diabetics. Grouping by risk factor we found that of those screened due to type 2 diabetes, a
history of alcohol misuse or both 3.7%, 2.8% and 7.7% respectively were diagnosed with cirrhosis. When the risk factors were combined this resulted in a greater “yield”
of detecting cirrhosis. For example, 6.6% of studied patients with both type 2
diabetes and obesity were diagnosed with cirrhosis, whilst 13.3% of patients with a combination of hazardous alcohol use, type 2 diabetes and obesity were cirrhotic.
Within each of these groups the risk of elevated liver stiffness was greater in patients with type 2 diabetes, metabolic syndrome or raised ALT. In those detected with cirrhosis, obesity was the critical factor, not ALT. For example, compared to
non-obese patients, non-obese patients with hazardous alcohol use were 5.6 times more likely to be diagnosed with liver cirrhosis and obese patients with type 2 diabetes
were 9.4 times more likely to be cirrhotic.
Strengths and Limitations
Page | 16 targeted risk factors. This allows us to study how simple risk factors can be
combined to improve the detection of significant liver disease. We selected all
available subjects with the relevant risk factors who were fit for screening and did not
already have a liver disease diagnosis, in an attempt to limit selection bias. To maximise the generalisability of our results patients were recruited from both
suburban and inner city primary care practices to provide a representative mixture. A further strength we believe is the clinical confirmation of cirrhosis diagnoses, for
which we used additional supportive radiological, histological and endoscopic evidence. Although recent guidance has suggested that a liver stiffness reading of greater than 15 kilopascals is strongly suggestive of compensated cirrhosis19, the positive predictive value of liver stiffness readings in the community may be lower than previous secondary care studies due to reduced disease prevalence. We
therefore believe the cirrhosis diagnoses we have reported are robust.
One of the limitations however is that only 45% of the eligible population underwent the transient elastography examination, although this is a greater response rate than
the other major UK primary care liver stratification study thus far reported, which enrolled only 35% of patients defined as at risk from their alcohol consumption20. There was however a response bias with screening attenders being older, more
female and with a differing proportion of hazardous alcohol use and type 2 diabetes than non-attenders. It is therefore difficult to predict the incremental increase of
cirrhosis which would be diagnosed if everyone invited had attended. A further limitation is that as we targeted only type 2 diabetes and alcohol misuse as risk
Page | 17 obesity within the population, but we will have not detected patients with clinically significant liver disease and obesity alone as a risk factor.
Comparison with other studies
Previous systematic reviews have highlighted the accuracy of transient elastography for stratifying fibrosis stage in secondary care populations with non-alcoholic fatty
liver disease21,22. Our own group recently published a systematic review of 19 prior studies which stratified primary care populations for risk of liver disease with non-invasive biomarkers23. Variables reported to be independently associated with elevated liver stiffness or fibrosis included obesity and elevated body mass index measurements, both of which in the current study were associated with significantly
higher risks of liver disease in each of our studied risk factor groups. Subsequent results published from the Rotterdam Study of 3,041 patients over 45 years of age screened for liver disease using transient elastography24 showed that both
BMI>30kg/m2 and type 2 diabetes were significantly associated with liver stiffness ≥8kPa (risk factor prevalence compared to normal liver stiffness was 37.7% vs.
21.4% for obesity, and 33.7% vs 9.8% for type 2 diabetes, respectively). Two large epidemiological studies from the United Kingdom have previously demonstrated the important synergism between body mass index and alcohol in predicting cirrhosis
development and liver-related mortality7,8. For example, one was a long term follow-up of 9,722 male workers from Scotland analysing the risk of liver-related mortality.
Whilst mortality risk due to elevated body mass index (overweight or obese patients) was not significantly different from baseline (hazard ratio 1.29, 95% CI 0.60-2.80), and far less than risk attributable to alcohol (consumption ≥15 units per week)
Page | 18 alcohol greatly exceeded the risk from either factor alone or the expected product of the two (hazard ratio 9.53, 95% CI 4.98-18.2)8.
We found cirrhosis in 3.7% of the patients with type 2 diabetes we screened which is
similar to previous studies which have used transient elastography in cohorts of type 2 diabetes25-28. In addition, two studies of patients with type 2 diabetes screened in a hospital setting have detected a far greater prevalence of cirrhosis than the current study. In a study of 392 patients with type 2 diabetes, Sporea et al27 found that
13.8% of their clinic cohort had liver stiffness measures of 10.3 kilopascals or greater
suggestive of cirrhosis. A large study of patients attending diabetes screening in hospital published by Kwok et al highlighted both the high liver disease prevalence
and impact of obesity detected using transient elastography29. In this study; 8.1% of patients with type 2 diabetes and BMI<25kg/m2 had elevated liver stiffness
consistent with advanced fibrosis compared to 35.4% of patients with BMI>30kg/m2. Also in this study 11.2% had liver stiffness >11.5 kilopascals (used as a cirrhosis cut-off). The high cirrhosis prevalence detected in these two studies is likely to be
explained by a comparatively low liver stiffness threshold to define cirrhosis coupled with the lack of second line confirmatory investigations.
Recent studies have published results of patients with type 2 diabetes screened for
liver disease in a primary care population16,30,31. Roulot et al30studied 705 patients with type 2 diabetes in France. Similar to our study, 2.1% of patients were diagnosed
with cirrhosis, defined using a liver stiffness threshold of 13 kilopascals. Importantly, the 13 kilopascals threshold had a 100% sensitivity and negative predictive value for histological cirrhosis in 47 patients undergoing liver biopsy, albeit a lower positive
Page | 19 parameters (such as laboratory parameters, ultrasonography and liver biopsy) for such patients prior to enrolling them to cirrhosis surveillance regimes.
Implications
In real life clinical practice, patients will have multiple risk factors for chronic liver disease. For example, within this study 44% of our population undergoing TE had
two or more of hazardous alcohol use, type 2 diabetes or obesity. Given this, and the synergism of these risk factors that the study highlights we feel that strictly
dichotomising patients with alcoholic liver disease and NAFLD on the basis of a
specific cut-off of alcohol consumption may serve to mislead. In our study patients with hazardous alcohol use, type 2 diabetes and obesity had a cirrhosis prevalence
of 13.3%, and elevated liver stiffness was seen in 46.7%. However, when
considering type 2 diabetes as the only selection criteria the equivalent figures were 3.7% and 31.5%. That the vast majority of significant liver disease detected was
found in those with diabetes and/or obesity shows we think that alcohol alone is not likely to remain the cause of the majority of the emerging epidemic of liver disease in
the United Kingdom in future.
Given the high prevalence of both elevated liver stiffness and cirrhosis detected in patients with type 2 diabetes, in addition to proof of concept of screening such
patients using transient elastography in primary care, we believe that formal
screening for liver disease in type 2 diabetes should now be considered. In addition
Page | 20 clinically significant liver disease. In this study we have demonstrated that both
hazardous alcohol use and obesity are potentially useful markers of higher risk groups for this purpose. Further optimisation of community-based liver disease
detection strategy is required, both in terms of initial risk factor selection, and whether the addition of other simple liver fibrosis tests to primary care algorithms
improves the classification of liver fibrosis35. Such work though we feel is now a priority to enable the eventual roll out of selective screening to detect liver disease at
an earlier stage.
Summary
Using Transient Elastography to selectively screen for liver disease in primary care,
and referring in high risk patients to a hepatology clinic resulted in a more than doubling of the number of cirrhosis cases diagnoses in the studied population. The majority of newly identified cirrhosis cases had type 2 diabetes and obesity as risk
factors (and therefore, presumably had non-alcoholic fatty liver disease).The risk of cirrhosis was far higher in those with multiple risk factors (hazardous alcohol use,
obesity and type 2 diabetes). Focussing upon the combination of liver disease risk factors is likely to be the most effective way of designing cost effective investigation
Page | 21
References
1.
Ratib S, West J, Crooks CJ, Fleming KM. Diagnosis of liver cirrhosis in
England, a cohort study, 1998-2009: a comparison with cancer. Am J
Gastroenterol. 2014;109(2):190-198.
2.
Murray CJ, Richards MA, Newton JN, et al. UK health performance:
findings of the Global Burden of Disease Study 2010. Lancet.
2013;381(9871):997-1020.
3.
Rehm J, Samokhvalov AV, Shield KD. Global burden of alcoholic liver
diseases. J Hepatol. 2013;59(1):160-168.
4.
Wong RJ, Aguilar M, Cheung R, et al. Nonalcoholic steatohepatitis is
the second leading etiology of liver disease among adults awaiting
liver transplantation in the United States. Gastroenterology.
2015;148(3):547-555.
5.
Ekstedt M, Franzen LE, Holmqvist M, et al. Alcohol consumption is
associated with progression of hepatic fibrosis in non-alcoholic fatty
liver disease. Scand J Gastroenterol. 2009;44(3):366-374.
6.
Naveau S, Giraud V, Borotto E, Aubert A, Capron F, Chaput JC. Excess
weight risk factor for alcoholic liver disease. Hepatology.
1997;25(1):108-111.
7.
Liu B, Balkwill A, Reeves G, Beral V, Million Women Study C. Body
mass index and risk of liver cirrhosis in middle aged UK women:
prospective study. BMJ. 2010;340:c912.
8.
Hart CL, Morrison DS, Batty GD, Mitchell RJ, Davey Smith G. Effect of
body mass index and alcohol consumption on liver disease: analysis
of data from two prospective cohort studies. BMJ. 2010;340:c1240.
9.
Chalasani N, Younossi Z, Lavine JE, et al. The diagnosis and
management of non-alcoholic fatty liver disease: practice Guideline
by the American Association for the Study of Liver Diseases,
American College of Gastroenterology, and the American
Gastroenterological Association. Hepatology. 2012;55(6):2005-2023.
10. Harman DJ, Ryder SD, James MW, et al. Direct targeting of risk factors
significantly increases the detection of liver cirrhosis in primary care:
a cross-sectional diagnostic study utilising transient elastography.
BMJ open. 2015;5(4):e007516.
11. Saunders JB, Aasland OG, Babor TF, Delafuente JR, Grant M.
Development of the Alcohol-Use Disorders Identification Test (Audit)
- Who Collaborative Project on Early Detection of Persons with
Harmful Alcohol-Consumption .2. Addiction. 1993;88(6):791-804.
12. McCorry RB, Palaniyappan N, Chivinge A, Kaye P, James MW, Aithal
GP. Development and evaluation of a nurse-led transient
Page | 22
13. Liver EAfSo, Higado ALpeEd. EASL-ALEH Clinical Practice Guidelines:
Non-invasive tests for evaluation of liver disease severity and
prognosis. J Hepatol. 2015;63(1):237-264.
14. Myers RP, Pomier-Layrargues G, Kirsch R, et al. Feasibility and
diagnostic performance of the FibroScan XL probe for liver stiffness
measurement in overweight and obese patients. Hepatology.
2012;55(1):199-208.
15. Echosens. Fibroscan Recommendations - Updated recommendations
for a reliable Fibroscan liver stiffness measurement. 2013;
http://asp-indus.secure-zone.net/v2/indexPop.jsp?id=955/1196/3761.
16. Roulot D, Costes JL, Buyck JF, et al. Transient elastography as a
screening tool for liver fibrosis and cirrhosis in a community-based
population aged over 45 years. Gut. 2011;60(7):977-984.
17. Pavlov CS, Casazza G, Nikolova D, et al. Transient elastography for
diagnosis of stages of hepatic fibrosis and cirrhosis in people with
alcoholic liver disease. The Cochrane database of systematic reviews.
2015;1:CD010542.
18. Zimmet P, KG MMA, Serrano Rios M. [A new international diabetes
federation worldwide definition of the metabolic syndrome: the
rationale and the results]. Revista espanola de cardiologia.
2005;58(12):1371-1376.
19. de Franchis R, Baveno VIF. Expanding consensus in portal
hypertension: Report of the Baveno VI Consensus Workshop:
Stratifying risk and individualizing care for portal hypertension. J
Hepatol. 2015;63(3):743-752.
20. Sheron N, Moore M, Ansett S, Parsons C, Bateman A. Developing a
'traffic light' test with potential for rational early diagnosis of liver
fibrosis and cirrhosis in the community. Brit J Gen Pract.
2012;62(602):470-471.
21. Festi D, Schiumerini R, Marzi L, et al. Review article: the diagnosis of
alcoholic fatty liver disease -- availability and accuracy of
non-invasive methods. Aliment Pharmacol Ther. 2013;37(4):392-400.
22. Kwok R, Tse YK, Wong GL, et al. Systematic review with
meta-analysis: non-invasive assessment of non-alcoholic fatty liver
disease--the role of transient elastography and plasma
cytokeratin-18 fragments. Aliment Pharmacol Ther. 2014;39(3):254-269.
23. Harris R HD, Card TR, Aithal GP, Guha IN. Prevalence of clinically
significant liver disease within the general population, as defined by
non-invasive markers of liver fibrosis: a systematic review. The
Page | 23
24. Koehler EM, Plompen EP, Schouten JN, et al. Presence of diabetes
mellitus and steatosis is associated with liver stiffness in a general
population: The Rotterdam study. Hepatology. 2016;63(1):138-147.
25. Jacqueminet S, Lebray P, Morra R, et al. Screening for liver fibrosis by
using a noninvasive biomarker in patients with diabetes. Clin
Gastroenterol Hepatol. 2008;6(7):828-831.
26. Morling JR, Fallowfield JA, Guha IN, et al. Clinically significant chronic
liver disease in people with Type 2 diabetes: the Edinburgh Type 2
Diabetes Study. QJM. 2016;109(4):249-256.
27. Sporea I, Mare R, Lupușoru R, et al. Liver Stiffness Evaluation by
Transient Elastography in Type 2 Diabetes Mellitus Patients with
Ultrasound-proven Steatosis. J Gastrointestin Liver Dis.
2016;25(2):167-174.
28. Kwok R, Choi KC, Wong GL, et al. Screening diabetic patients for
non-alcoholic fatty liver disease with controlled attenuation parameter
and liver stiffness measurements: a prospective cohort study. Gut.
2016;65(8):1359-1368.
29. Mortality GBD, Causes of Death C. Global, regional, and national life
expectancy, all-cause mortality, and cause-specific mortality for 249
causes of death, 1980-2015: a systematic analysis for the Global
Burden of Disease Study 2015. Lancet. 2016;388(10053):1459-1544.
30. Roulot D, Roudot-Thoraval F, NKontchou G, et al. Concomitant
screening for liver fibrosis and steatosis in French type 2 diabetic
patients using Fibroscan. Liver Int. 2017.
31. Doycheva I, Cui J, Nguyen P, et al. Non-invasive screening of diabetics
in primary care for NAFLD and advanced fibrosis by MRI and MRE.
Aliment Pharmacol Ther. 2016;43(1):83-95.
32. Aithal GP, Thomas JA, Kaye PV, et al. Randomized, placebo-controlled
trial of pioglitazone in nondiabetic subjects with nonalcoholic
steatohepatitis. Gastroenterology. 2008;135(4):1176-1184.
33. Armstrong MJ, Gaunt P, Aithal GP, et al. Liraglutide safety and efficacy
in patients with non-alcoholic steatohepatitis (LEAN): a multicentre,
double-blind, randomised, placebo-controlled phase 2 study. Lancet.
2015.
34. Noureddin M, Anstee QM, Loomba R. Review article: emerging
anti-fibrotic therapies in the treatment of non-alcoholic steatohepatitis.
Aliment Pharmacol Ther. 2016;43(11):1109-1123.
Page | 24
Conflicts of Interest:
All authors declare: no support from any organisation for the submitted work; no financial relationships with any organisations that might have an interest in the submitted work in the previous three years; no other relationships or activities that could appear to have influenced the submitted work.
Funding Source/Sponsor:
Funding for study was provided by 2 sources i) the NIHR Nottingham Biomedical Research Centre, part of the University of Nottingham and Nottingham University Hospitals NHS Trust and ii) The East Midlands Academic Health Sciences Network (AHSN). The study sponsor is the University of Nottingham, who are data custodians but had no role in the design, analysis or interpretations of the data. All authors declare that they are free from other sources of external funding related to this study.
Authorship Statement:
DJ Harman, SD Ryder, MW James, EA Wilkes, TR Card, GP Aithal and IN Guha were involved in the study design and concept, implementation of the study in primary care, interpretation of results and editing of the manuscript. Additionally DJ Harman analysed the data set and wrote the initial manuscript draft. All authors, external and internal, had full access to all of the data (including statistical reports and tables) in the study and can take responsibility for the integrity of the data and the accuracy of the data analysis. All authors have approved the final version of the manuscript and authorship list. GP Aithal and IN Guha are guarantors.
Page | 25 Tables
Table 1. Baseline characteristics of total adult patient population (n=20,868) at studied General Practice (GP) sites
Variable Suburban GP Patients (n=10,479)
Inner City GP Patients (n=10,389)
P Value
Age (n%) - 18-30 years - 31-40 years - 41-50 years - 51-60 years - 61-70 years - 71-80 years ->80 years 2100 (20.4%) 2469 (23.6%) 1903 (18.2%) 1331 (12.7%) 1287 (12.3%) 781 (7.5%) 608 (5.8%) 2640 (25.4%) 2333 (22.5%) 1986 (19.1%) 1535 (14.8%) 953 (9.2%) 606 (5.8%) 346 (3.3%) <0.001 0.06 0.08 <0.001 <0.001 <0.001 <0.001 Male Gender n(%) 5131 (49.0%) 5391 (51.2%) <0.001 Body Mass Index n(%)
- 25-29.9 - ≥30
- Missing values
2835 (27.1%) 1320 (12.6%) 1363 (13.0%) 4177 (40.2%) 2527 (24.3%) 995 (9.6%) <0.001 <0.001 <0.001 Hazardous Alcohol Use n(%)
658 (6.3%) 780 (7.5%) <0.001 Type 2 Diabetes n(%) 390 (3.7%) 617 (5.9%) <0.001 Ischaemic Heart
Disease n(%)
423 (4.0%) 406 (3.9%) 0.66
Hypertension n(%) 1521 (14.5%) 1356 (13.1%) 0.002 Hyperlipidaemia n(%) 2117 (20.2%) 1806 (17.4%) <0.001
Page | 26 Table 2. Clinical and laboratory test characteristics of 899 patients with successful liver stiffness measurement, comparing patients with normal liver stiffness (n=669) separately to patients with elevated liver stiffness (n=230) and patients with liver cirrhosis (n=27)
Variable Normal Liver Stiffness (n=669) Elevated Liver Stiffness (n=230)
P Value* Cirrhosis (n=27)
P Value$
Age (years) 60.0 (48-69) 63.0 (52-70) 0.02 63.0 (55-67) 0.48 Male Gender
n(%)
430 (74.4%) 161 (70.0%) 0.12 20 (74.1%) 0.36
Body Mass Index (kg/m2)
27.4 (24.2-30.9)
31.6 (28.2-35.3)
<0.001 33.2 (30.4-36.3)
0.258
Hazardous Alcohol Use n(%)
316 (47.3%) 75 (32.6%) <0.001 11 (40.7%) 0.77
Current alcohol (units/week)
8 (0-28) 3 (0-24) 0.02 2 (0-42) 0.90
Type 2 Diabetes n(%)
371 (55.5%) 171 (74.4%) <0.001 20 (74.1%) 0.14
Raised ALT n(%)
87 (13.0%) 73 (31.7%) <0.001 9 (33.3%) 0.006 Obesity n(%) 210 (31.8%) 140 (60.9%) <0.001 22 (81.5%) <0.001 Ischaemic Heart
Disease n(%)
69 (10.3%) 38 (16.5%) 0.01 5 (18.2%) 0.291
Hypertension n(%)
269 (40.3%) 126 (54.8%) <0.001 14 (51.9%) 0.41 Hyperlipidaemia
n(%)
433 (64.8%) 176 (76.5%) <0.001 16 (59.3%) 0.54 Metabolic
Syndrome n(%)
170 (25.5%) 118 (51.3%) <0.001 16 (59.3%) 0.002 Liver Stiffness
Median (kPa)
5.1 (4.3-6.1) 11.2 (8.9-14.9)
<0.001 27.4 (21.3-48.8)$
<0.001
Normally distributed numerical variables are displayed as mean (standard deviation(SD)) and compared using the t test, non-normally distributed numerical variables are displayed as
Page | 27 Table 3. Laboratory test, imaging and histopathology results of 27 patients newly diagnosed with cirrhosis during study
Liver Disease
Risk Factor*
Age Liver Stiffness
(kPa)
Platelet Count (109/L)
Clinical Features of
CLD¥
Ultrasound Abnormality$
Histopathology Endoscopy Abnormality
Obesity 64 11.7 323 H No Cirrhosis
(NASH)
No
T2DM and Obesity€
67 14.7 214 H No Not Performed No
T2DM and Obesity
49 15.8 211 H No Cirrhosis
(NASH) No Alcohol, T2DM And Obesity
64 17.1 182 No Splenomegaly
(17cm)
Not Performed Not Performed
Alcohol, T2DM
and Obesity
67 18.2 309 No No Cirrhosis
(NASH) No Alcohol, Obesity and T2DM
67 18.5 95 No Cirrhosis (nodular
liver), Splenomegaly
(14cm)
Not Performed No
T2DM and Obesity
63 21.3 169 H Splenomegaly
(16cm) Cirrhosis (NASH) No T2DM and Obesity
55 21.3 260 S No Cirrhosis
(NASH)
No
T2DM and Obesity
68 24.0 143 No No Cirrhosis
(NASH)
No
T2DM and Obesity
72 26.4 274 H Cirrhosis (Coarse
echotexture of the liver)
Not Performed Not Performed
Alcohol And Obesity
58 27.0 123 H Cirrhosis (Nodular
liver)
Not Performed No
T2DM And Obesity
67 27.0 131 S No Cirrhosis
(NASH)
No
Alcohol and T2DM
48 27.0 339 No No Cirrhosis
(ASH/NASH)
Grade 1 Varices
T2DM 65 27.4 235 No No Cirrhosis
(NASH)
Page | 28
T2DM and Obesity
57 35.3 136 No Cirrhosis (Nodular
liver) Cirrhosis (NASH) Not Performed T2DM and Obesity
52 36.3 147 H,S Splenomegaly
(17cm)
Not Performed No
Alcohol 38 42.9 169 S Cirrhosis (Nodular
liver)
Not Performed Not Performed T2DM
and Obese
58 44.3 116 H Cirrhosis (Coarse
echotexture of the liver), splenomegaly (14cm) Cirrhosis (NASH) Grade 1 Varices Alcohol and Obesity
54 46.4 103 H,S Cirrhosis (Nodular
liver)
Not Performed No
Alcohol, T2DM
and Obesity
63 46.4 151 H No Not Performed Not
Performed
T2DM And Obesity
68 48.8 144 No Splenomegaly
(13cm)
Not Performed Not Performed
T2DM And Obesity
65 49.6 356 H No Not Performed PHG
T2DM And Obesity
75 50.5 109 No Cirrhosis (Coarse
echotexture of the liver), Splenomegaly
(14cm)
Not Performed Not Performed
Alcohol 55 52.3 81 H,S Cirrhosis (Nodular
liver), Reversal of portal vein flow
Not Performed Not Performed
Alcohol 56 60.8 177 S Cirrhosis (Nodular
liver)
Not Performed No
T2DM and Obesity
73 72 260 No Cirrhosis (Nodular
liver)
Not Performed No
Alcohol and Obesity
49 75 139 S Cirrhosis (Nodular
liver), Trace of ascites
Not Performed Grade 1 Varices
Page | 29 Normally distributed numerical variables are displayed as mean (standard deviation(SD)) and
compared using the t test, non-normally distributed numerical variables are displayed as
[image:29.595.45.558.137.643.2]median(interquartile range) and compared using the Mann-Whitney test. Categorical variables are displayed as n(%) and compared using Fisher’s Exact test. P values ≤0.05 are displayed in bold. *= p value comparing normal and elevated liver stiffness in patients with hazardous alcohol use; ¥ = p value comparing normal and elevated liver stiffness in patients with type 2 diabetes; β= p value comparing normal and elevated liver stiffness in patients with both of these risk factors. ALT = alanine aminotransferase, kPa = kilopascals, LSM = liver stiffness measurement.
Table 4. Clinical and laboratory test characteristics of 899 patients with successful liver stiffness measurement (LSM), comparing clinical features of patients with normal and elevated liver stiffness in risk factor groups of hazardous alcohol use (n=391), type 2 diabetes (n=542) and those with both hazardous alcohol use and type 2 diabetes (n=64)
Variable Alcohol and Normal LSM (n=316) Alcohol and Elevated LSM (n=75) T2DM and Normal LSM (n=371) T2DM and Elevated LSM (n=171) Both risks and Normal LSM (n=40) Both risks and Elevated LSM (n=24) Age (years) 55 (43-64) 61 (52-66)* 64 (56-74) 65 (54-71) 64.5
(57.5-72.5)
63 (56-67)
Male Gender n(%)
238 (75.3%) 65 (86.7%) 221 (59.6%)
115 (67.3%) 35 (87.5%) 22 (91.7%)
Body Mass Index (kg/m2)
25.7 (22.8-28.7) 28.7 (26.5-33.3)* 28.9 (25.9-32.0) 32.45 (29.0-36.3)¥ 28.05 (26.0-31.7) 32.75 (27.85-35.9)β Hazardous Alcohol Use n(%)
--- --- 40
(10.8%)
24 (14.0%) --- ---
Current alcohol (units/week)
28 (21-42) 30 (23-60) 0.5 (0-6) 1 (0-7) 25 (20-30) 29 (20.5-46)
Type 2 Diabetes n(%)
40 (12.7%) 24 (32.0%)* --- --- --- ---
Raised ALT level n(%)
42 (13.3%) 25 (33.3%)* 28 (7.6%) 46 (26.9%)¥ 4 (10.0%) 6 (25.0%)
Obesity n(%) 63 (20.3%) 33 (44.0%)* 157 (42.6%)
116 (67.8%)¥
16 (40.0%) 14 (58.3%)
Ischaemic Heart Disease n(%)
18 (5.7%) 10 (13.3%)* 55 (14.8%)
31 (18.1%) 5 (12.5%) 3 (12.5%)
Hypertension n(%)
78 (24.8%) 38 (50.7%)* 209 (56.3%)
101 (59.1%) 22 (55.0%) 16 (66.7%)
Hyperlipidaemia n(%)
143 (45.3%) 40 (53.3%) 318 (85.7%)
149 (87.1%) 34 (85.0%) 17 (70.8%)
Metabolic Syndrome n(%)
28 (8.9%) 20 (26.7%)* 157 (42.3%)
109 (63.7%)¥
15 (37.5) 12 (50.0%)
Liver Stiffness Median (kPa) 4.8 (4.1-5.75) 10.9 (9.0-15.7)* 5.3 (4.4-6.4) 11.3 (9.0-15.8) ¥
Page | 30 Table 5a. Odds ratios for presence of elevated liver stiffness comparing presence and absence of
obesity, metabolic syndrome and raised ALT level in patients with hazardous alcohol use (n=391), type 2 diabetes (n=543) or both hazardous alcohol and type 2 diabetes (n=64)
Variable Hazardous Alcohol Use (n=391)
Type 2 Diabetes (n=543) Hazardous Alcohol and Type 2 Diabetes (n=64)
Exposed
Non-exposed
OR (95%CI)
Exposed
Non-exposed
OR (95%CI)
Exposed
Non-exposed
OR (95%CI)
Obesity 33/96 42/290 3.1
(1.8-5.3)
116/273 55/267 2.9 (1.9-4.2)
14/30 10/34 2.1 (0.8-5.9) Metabolic
Syndrome
20/48 55/343 3.7 (2.0-7.1)
109/266 62/276 2.4 (1.6-3.5)
12/27 12/37 1.7 (0.6-4.6) Raised
ALT level
25/67 50/324 3.3 (1.8-5.8)
46/74 125/469 4.5 (2.7-7.5)
6/10 18/54 3.0 (0.8-12.0) Table 5b. Odds ratios for presence of cirrhosis comparing presence and absence of obesity, metabolic syndrome and raised ALT level in patients with hazardous alcohol use (n=391), type 2 diabetes (n=543) or both hazardous alcohol and type 2 diabetes (n=64)
Variable Hazardous Alcohol Use (n=391)
Type 2 Diabetes (n=543) Hazardous Alcohol and Type 2 Diabetes (n=64)
Exposed
Non-exposed
OR (95%CI)
Exposed
Non-exposed
OR (95%CI)
Exposed
Non-exposed
OR (95%CI)
Obesity 7/96 4/290 5.6
(1.6-19.7)
18/273 2/268 9.4 (2.2-40.9)
4/30 1/34 5.1
(0.5-48.2) Metabolic
Syndrome
3/48 8/343 2.8 (0.7-10.9)
16/266 4/277 4.4 (1.4-13.2)
3/27 2/27 2.2
(0.3-14.1) Raised
ALT level
4/67 7/324 2.9 (0.8-10.1)
5/74 15/469 2.2 (0.8-6.2)
1/10 4/54 1.4
(0.1-13.9)
Page | 31 Figure Legends
Figure 1 – Flowchart of 2,368 patients identified with risk factor for chronic liver disease through the transient elastography screening pathway