A
GE AND FERTILITY:
C
AN WE WAIT UNTIL THE EARLY30
S?
J
OHNW.
M
CD
ONALD,
A
LESSANDROR
OSINA,
E
STERR
IZZI,
B
ERNARDOC
OLOMBOA
BSTRACTDelaying the start of childbearing raises the issue of fertility postponed versus fertility foregone. One of the limits of previous studies of ``How late can you wait?'' is the difficulty of controlling for sexual activity. Data on the frequency and timing of intercourse within a menstrual cycle are uncommon. We use such data from the Menstrual Cycle Fecundability Study to study ``Can we wait until the early 30s?''. We model the effect of age on conditional fecundability, i.e., the probability of conception given that the couple is not sterile, simultaneously controlling for the effect of primary sterility and the frequency and timing of intercourse in each menstrual cycle. Can we wait until the early 30s for a first birth? Our evidence is yes (providing you are not already sterile) as the increase in the mean waiting time to conception is very modest and of little practical importance.
John W. McDonald1, Alessandro Rosina2, Ester Rizzi2 and
Bernardo Colombo3
1
University of Southampton,
2Catholic University - Milan,
3University of
Padua
Address for correspondence:
John W. McDonald
Division of Social Statistics
School of Social Sciences and
Southampton Statistical Sciences Research Institute
University of Southampton
Southampton SO17 1BJ
Abstract
Delaying the start of childbearing raises the issue of fertility postponed versus fertility
foregone. One of the limits of previous studies of “How late can you wait?” is the
diffi-culty of controlling for sexual activity. Data on the frequency and timing of intercourse
within a menstrual cycle are uncommon. We use such data from the Menstrual Cycle
Fecundability Study to study “Can we wait until the early 30s?”. We model the effect
of age on conditional fecundability, i.e., the probability of conception given that the
couple is not sterile, simultaneously controlling for the effect of primary sterility and the
frequency and timing of intercourse in each menstrual cycle. Can we wait until the early
30s for a first birth? Our evidence is yes (providing you are not already sterile) as the
increase in the mean waiting time to conception is very modest and of little practical
importance.
Keywords: coital frequency; fecundability; fertility; sterility; waiting time to
Introduction
In recent decades and in many populations, the start of childbearing has been
increas-ingly delayed towards higher ages. Delaying the start of childbearing raises the issue of
fertility postponed versus fertility foregone. As women’s ability to have children declines
with age, the issue is “How late can you wait?” (Menken, 1985). What is the age from
which the decline in fecundability substantially increases the probability of remaining
childless? Hence, the level and age pattern of fecundability and primary sterility is of
substantial recent interest, especially after age 30. The purpose of this study is to
inves-tigate “Can we wait until the early 30s?”. Is the probability of a first birth for women
in their early 30s substantially lower than during their 20s?
It is difficult to estimate the age patterns of fecundability and sterility for females
and males for many reasons, especially in contemporary populations (Menken, Trussell
and Larsen, 1986). Many studies of the age patterns of fecundability and sterility were
based on aggregate data from historical populations that married late and did not use
contraception. Larsen and Vaupel (1993) state “it is not known whether the decline
in aggregate fecundability by age is due largely to an increase in the proportion sterile
or to a decline in fecundability among couples who are still fecund”. They found that
conditional fecundability, i.e. the probability of conception given that the couple is not
sterile, declined with age, and one explanation they gave was age-specific variation in
coital frequency. One of the main limits of previous historical and medical studies of
age-related changes in fertility, fecundability and sterility is the difficulty to control for
sexual activity, in particular, variation in coital frequency with age and/or duration of
marriage. Data on the frequency and timing of intercourse within a menstrual cycle are
uncommon. As a result, most analyses of age-related changes in fertility, fecundability
and sterility cannot separate effects directly related to ageing from effects due to variation
in coital frequency.
Dunson, Colombo and Baird (2002) used data from a large multinational prospective
cohort study of couples practising natural family planning, the Menstrual Cycle
Fecund-ability Study (MCFS) (Colombo and Masarotto, 2000), “to evaluate the effects of male
be-haviour”. The MCFS participants kept daily records of basal body temperature (BBT)
and recorded the days during which intercourse and menstrual bleeding occurred. Day
of ovulation was estimated using published methods based on BBT data and BBT-based
estimates of ovulation day have a high probability of being within ±1 day of the true
ovulation day (Dunson et al. 1999). Since the ages of MCFS sexual partners were highly
correlated, Dunson, Colombo and Baird (2002) avoided problems of multicollinearity by
including in their model age of the woman as a categorical variable and the difference in
years of age between the male and female partners, rather than age of the man. Age of
the woman was categorised as 19-26, 27-29, 30-34 and 35-39 years old. The probabilities
of pregnancy associated with sexual intercourse on specific days relative to ovulation
day were estimated and compared across these age groups. A number of models were
fitted and based on their simplified model, Dunson et al. (2002, p. 1401) found that
“women aged 27-29 years were predicted to have lower pregnancy rates on average than
women aged 19-26 years given equivalent timing of intercourse” and “Women in the
27-29 and 30-34 year age categories had statistically indistinguishable rates, and there
was evidence of a decline between the 30-34 and 35-39 year age groups”. Dunson et al.
(2002, p. 1399) concluded that “Women’s fertility begins to decline in the late 20s with
substantial decreases by the late 30s. Fertility for men is less affected by age, but shows
significant decline by the late 30s.”
Dunson et al. (2002) analysed MCFS data relating to 2539 menstrual cycles from 647
women who had at least one day with intercourse reported in a conservative estimate
of the fertile window, i.e., the 10 day interval beginning 7 days prior to and ending 2
days after the estimated ovulation day. Approximately half of these women had at least
one past pregnancy. In this study, we only use MCFS data from nulliparious women
as our interest is whether the probability of a first birth for women in their early 30s
is substantially lower than during their 20s. We simultaneously model the waiting time
to first clinical pregnancy for fecund women and the probability of primary sterility.
One limitation of Dunson et al. (2002) is that they did not explicitly take sterility into
account in their modelling of day-specific pregnancy probabilities. Our analysis is based
on a ‘sterility/conditional fecundability’ mixture model that combines a discrete-time
logistic regression model for primary sterility (McDonald and Rosina, 2001). Dunson et
al. (2002) modelled age of the woman effects using a categorical variable. In contrast,
we model the effect of age of the woman smoothly by using a spline. A spline s(x) is a
smooth piecewise defined function whose ‘pieces’ are low-degree polynomials defined on
separate intervals of the range ofx. The pieces are joined together in a suitably smooth
fashion at join points called knots. Cubic splines (splines of degree 3) are often used
in practice because they balance well flexibility in shape against complexity (for further
details, see Diamond, McDonald and Shah, 1986). Cubic splines do have a drawback
in that they can behave poorly in the tails, i.e., before the first knot and after the last
knot, especially when there are few observations in the tails. To avoid this problem,
constraints on the behaviour of the spline in the tails are added, e.g., one common
constraint is that the fitted values before the first knot and after the last knot are linear.
With these constraints, one has restricted cubic splines (also termed natural splines),
which constrain the function to be linear in the tails (for further details, see Harrell,
2001). We model the effect of age of the woman by using a restricted cubic spline with
knots at age 24, 28 and 32 years in order to model the effects of age of the woman in a
flexible nonparametric manner.
In this study, we try to investigate the effect of age on conditional fecundability,
while simultaneously controlling for the effect of primary sterility, coital pattern and age
of the male partner. As we are mainly interested in estimating the effect of age, net
of the coital pattern, rather than studying the day-specific pregnancy probabilities and
how these depend on the coital pattern, we specified the effects of the coital pattern on
the probability of conception differently than Dunson et al. (2002).
Data and Methods
The MCFS is a multinational longitudinal study of couples experienced in natural
meth-ods of contraception, who were recruited from natural family planning centers. Most
couples were trying to avoid pregnancy, although one centre (Lugano) only enrolled
cou-ples planning a pregnancy. Coucou-ples were married or in a stable relationship. Women
menstrual cycle since last breastfeeding or delivery. Women had no sign of infertility,
they did not use hormonal treatment, or another treatment with effects on
fecundabil-ity. At the entry in the study, information on their reproductive life, marriage duration,
their age and their partner’s age was recorded. During the study, for each menstrual
cycle, various characteristics of the cycle (basal temperature, cervical mucus quality)
were recorded daily, together with information on the presence or the absence of
sex-ual intercourse for each day. Information on both reproductive physiology and sexsex-ual
behaviour was collected for 881 women, 7,594 cycles and 752 pregnancies. More details
on the research protocol, study methods and participants can be found in Colombo and
Masarotto (2000).
In our study, only menstrual cycles with identified day of ovulation are considered
and first pregnancies. The first five cycles just after stopping the contraceptive pill
were excluded due to concerns that recent previous pill use may result in a short-term
reduction in fecundability. The day of ovulation was identified in each cycle from records
of mucus symptoms. The timing of intercourse is relative to these surrogate ovulation
markers. We limited our analysis to European centres participating in the MCFS (Milan,
Verona, Lugano, D¨usseldorf, Paris, London and Brussels), excluding data from New
Zealand (only 2 pregnancies out of 2 women). As mentioned above, in order to study
the question “Can we wait until the early 30s?”, we only consider women between 20
to 36 years old, whose husband/partner is aged less than 40, because we have too few
first pregnancies after age 36. We only include cycles with at least one intercourse in
the 12-day interval (-8, 3). This interval was chosen so as to include the fertile window.
Note that no pregnancies occurred when intercourse only occurred outside of the 12-day
interval (-8, 3).
Our final population included 361 women, contributing to the analysis 1,653
men-strual cycles, where 217 women obtained a first pregnancy during the study (uncensored
observations and nonsterile couples) and 144 women did not conceive (censored
observa-tions and some of these women may be sterile). Note that for many couples the number
of cycles was often too small to provide much information about the probability that the
couple was sterile. This is not a problem for our modelling approach. This would be a
While the MCFS is rich in information about the timing and frequency of intercourse
and cycle characteristics, there is only limited information about the couples enrolled in
the MCFS study. Data available concern reproductive history, including the number of
previous pregnancies, date of last delivery or abortion, date of the end of breastfeeding
and date of last consumption of oral contraception. At entry in the study, marriage
duration, woman’s and partner’s age were collected. Hence, we only use age of woman
and man, centre and coital pattern and frequency in our hazard model of waiting time
to first conception. We model the effect of age of the woman by using a cubic spline with
knots at age 24, 28 and 32 years in order to model the effects of age of the woman in a
flexible nonparametric manner. We model the effect of age of the man with a dummy
variable: < 35 and 35+. We include centre in our model with 7 categories (Verona is
the reference category). We model the “coital pattern and frequency” by defining three
windows relative to ovulation on day 0: A (-2, -1, 0), B (-4, -3, 1) and C (-8, -7, -6, -5, 2,
3) and five categories, where yes and no refer to the presence and absence of intercourse
on a day in the window:
1. 2+ intercourse in A (reference category)
2. only one intercourse in A
3. A no, B yes, C yes
4. A no, B yes, C no
5. A no, B no, C yes
Models
Our analysis is based on a ‘sterility/conditional fecundability’ mixture model that
com-bines a discrete-time survival model for the cycle-specific probability of first conception
with a logistic regression model for primary sterility (McDonald and Rosina, 2001).
The use of a survival model with long-term survivors (sterile subpopulation) explicitly
allows for the possibility that some women have zero risk of conception. The
where there is positive probability of conception (non-sterile couple exposed to the risk
of pregnancy in that cycle, i.e., at least one intercourse in the interval (-8, 3) relative
to ovulation on day 0). Each cycle with positive exposure to the risk of conception is
considered a discrete-time point. Note that such a model can also be interpreted as a
two-level multilevel model, where the menstrual cycles for each woman form the first
level and the woman/couple constitutes the second level. Our event of interest for each
cycle is first conception, i.e., first clinical pregnancy.
Model for the waiting time to conception
The geometric distribution results when the discrete-time hazard, pr(T = t | T ≥ t),
is constant over time. Fitting a constant hazard model, with possibly censored data,
by maximum likelihood estimation is straightforward using software for fitting logistic
regression models to binomial distributed data. Letting the constant hazard vary from
individual to individual on the basis of observed heterogeneity (covariate information)
is also straightforward (McDonald and Rosina, 2001). One approach to incorporating
unobserved heterogeneity in this time-constant discrete-time hazard model is by using a
logistic-normal-geometric model for survival times. The logistic-normal-geometric model
is a ‘mixed-geometric’ random effects model which allows for unobserved heterogeneity in
the hazard across the population. It uses a logit link relating the hazard to explanatory
variables and includes a normally distributed random effect term, which incorporates
unobserved heterogeneity into the survival model. For details, see McDonald and Rosina
(2001).
The survival component of our mixture model is a logistic-normal-geometric model
for the waiting time to first conception. Time starts at entry into the MCFS study. Our
survival model includes a cubic spline of age and other covariates, X, and regression
effects γ, and a random effect,Zσ, representing unobserved heterogeneity in the risk of
conception, i.e.,
logit(hazard| fecund) = s(age) +X0γ + Z σ
spline with knots at age 24, 28 and 32 years, namely,
s(age) =α+βage+k1(age−24) 3
δ(age−24)+k2(age−28) 3
δ(age−28)+k3(age−32) 3
δ(age−32)
whereδ( ) is an indicator function, equal to 1 if the argument is positive and 0 otherwise.
This allows us to model nonlinear relationships between age and the logit of the hazard
between ages 24 and 32 without specifying a functional form and specifies the logit
hazard to be linear before age 24 and after age 32.
Model for primary sterility
Let Y = 1 indicate a couple who would eventually conceive (those fecund) and Y = 0
indicate a long-term survivor (those sterile). Note thatY is partly observable; the value
of Y will be known to equal 1 if a conception occurred, but the value of Y is unknown
(missing) if a conception has not yet occurred, i.e., for right-censored observations. Let
T denote the time to conception among couples for which Y = 1, i.e., those fecund.
For a couple with column vector F of explanatory variables, the distribution of Y
can be modelled by a logistic regression model
logit(pr(Y = 1)) = logit(pr(fecund)) =F0α
whereαis a column vector of regression parameters to be estimated. Hence, the sterility
component of our mixture model is a logistic model for being fecund with covariates, F,
and regression effects α.
Model fitting using Gibbs sampling
Estimation of the model was carried out using BUGS, an acronym for ‘Bayesian inference
Using Gibbs Sampling’, which is described by Thomas et al. (1992), because of its
flexibility in fitting complex models. The BUGS code used to specify the model is
available from the authors. For general discussion of the Bayesian approach and for
details, see McDonald and Rosina (2001). The Gibbs sampler is a general purpose Monte
Carlo method for generating random variables from a target distribution of interest
was used and inference based on a sample of 50,000 observations from the posterior
distribution. Inferences are based on the entire posterior or, most typically, on univariate
marginals of the posterior distribution. If the prior distribution is ‘non-informative or
flat’, then the posterior distribution is approximately proportional to the likelihood
and, in this case, classical and Bayesian approaches are basically equivalent. Usually,
a description of an univariate marginal posterior is needed in terms of a few numerical
summaries. Typically, the posterior mean, mode, median or quantiles are used. We shall
also use 95% credible intervals defined by the 2.5% and 97.5% points of the univariate
marginal posterior distribution.
The non-informative priors for the regession effect parameters were independent
N(0,0.0001) distributions, where the second parameter of the normal distribution is
the precision, i.e., the reciprocal of the variance. A N(0,1) prior for our unobserved Z
and a mildly informative uniform prior of σ ∼ U[0,5] was used. An informative beta
prior was used for the proportion fecund, i.e.,s∼beta(367.68,15.32), which corresponds
to a mean of 0.96 and 95% credible interval between 0.94 and 0.98. Note that for many
couples the number of ‘unsuccessful’ cycles was often too small to provide much
infor-mation about the probability that the couple was sterile. Our beta prior was chosen as
the proportion of couples with primary sterility has been estimated to be around 3% to
4%. Therefore, we decided to consider a 95% credible interval between 2% and 6% for
the percentage sterile, or 0.94 and 0.98 for the proportion fecund.
Results
Logistic model for being fecund
The only covariate considered for primary sterility was a dummy variable for age of the
woman: < 30 and 30+. Primary sterility in the early 30s (30+) was not significantly
higher in comparison to the 20s (< 30). Table 1 presents the mean as well as the
2.5% and 97.5% percentage points of the posterior distribution of the probability of
being fecund for females <30 and females 30+ derived from the logistic model of being
this particular woman is fecund was estimated using the Gibbs sampler. The posterior
medians were one for all non-conceiving women, except women with ids 99, 180 and 283,
where the posterior medians were zero. The mean posterior probability for woman with
id 102 was 0.963, while for woman with id 99, the mean posterior probability was 0.352.
The woman with id 283 had an estimated mean posterior probability of being fecund
of 0.002 and this woman (couple) is almost certainly sterile. This woman was aged 22
with a young partner. No conception occurred after 20 menstrual cycles with 4 cycles
with intercourse pattern A no, B yes, C yes, 9 cycles with only one intercourse in A and
and 7 cycles with 2+ intercourse in A.
One advantage of the Bayesian approach is that posterior probabilities of being sterile
are estimated for individual women who did not conceive. The posterior probability that
an individual with vector of explanatory variablesxcomes from populationY = 1, given
that no event has occurred by time t, is
pr(Y = 1|x, T > t) = pr(Y = 1|x) S(t|Y = 1, x)
pr(Y = 0|x) + pr(Y = 1|x) S(t|Y = 1, x).
Waiting time to conception
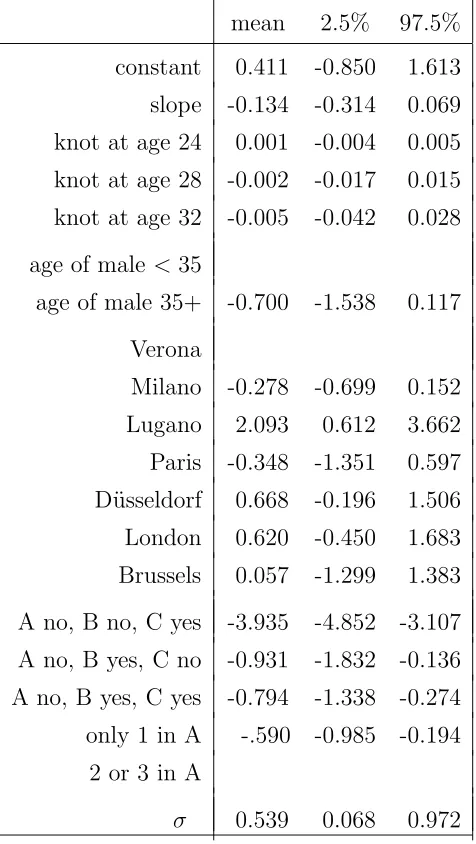
Table 2 presents the mean as well as the 2.5% and 97.5% percentage points of the
posterior distribution of the parameter estimates for the model for the waiting time to
first conception. The category omitted in the table is the reference category. Age of man
was not significantly related to the waiting time to conception, but was in the expected
direction where males aged 35+ had a lower risk of conception. The only significant
difference between the various centres and Verona (the reference category) was Lugano,
which only enrolled couples planning a pregnancy. In our ‘subsample’, Lugano had
only 8 couples, but 7 pregnancies, so this result is explainable by the small number of
couples and high proportion of first conceptions amongst couples trying to get pregnant.
The results for coital frequency and pattern of intercourse are significant relative to the
reference category of 2+ acts of intercourse in window A (-2, -1, 0). The pattern is as
expected with reduced risk of conception for fewer acts of coitus in window A, and with
Age of woman was not significantly related to the waiting time to conception, but
was in the expected direction of a decline with age. The posterior mean of the slope
parameter for the spline was negative and the posterior means of the knot parameters
at ages 28 and 32 were also negative, but all the 95% credible intervals included zero.
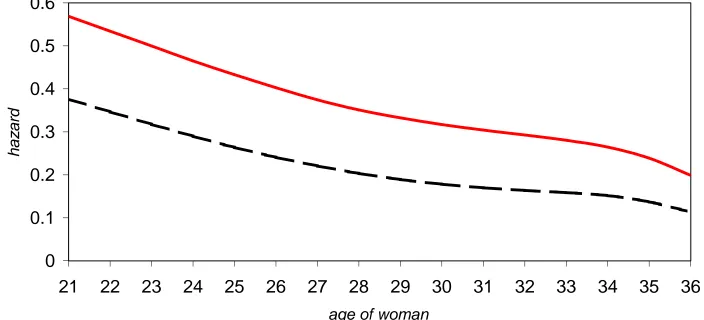
The pattern of risk of conception by age of the woman can be examined by plotting the
median hazard by age of the woman along with 95% credible intervals for the reference
group (partner’s age < 35, 2+ acts of intercourse in window A (-2, -1, 0) and Verona
centre); see Figure 1. The decline in the median hazard for the reference group is almost
linear with age. The median value at age 21 is 0.57 and at age 35 is approximately
0.24. Consider postponing trying to conceive from age 23 to 33, the median hazard for
our reference group declines from 0.50 to 0.28. Our interest is focused on what might
happen by postponing from the end of the 20s to the early 30s, say from age 28 to 33.
From 28 to 33, the median hazard for the reference group declines from 0.35 to 0.28.
This is a very modest decline. Note that the size of the decline depends on our choice
of reference group, namely those with 2+ acts of intercourse in window A, 2 days before
and including the presumed day of ovulation. The reference group of no intercourse in
window A, but yes in B and yes in C yields a mean hazard plot with weaker age effect.
Figure 2 compares these plots with a solid line for the 2+ in A reference group and the
dashed line for the reference group of no intercourse in A, but yes in B and yes in C.
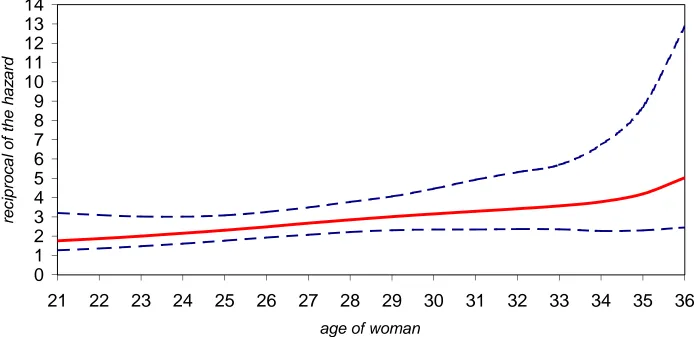
Figure 3 plots the median of the reciprocal of the hazard and the 2.5% and 97.5%
percentage points of the posterior distribution of the reciprocal of the hazard by age of
the woman. For each case, the hazard is calculated by setting the covariate values in the
linear predictor equal to the given age of woman plotted, partner’s age < 35, 2+ acts
of intercourse in window A (-2, -1, 0), Verona centre and adding the estimated value of
Zσ. Hence, the 95% credible intervals plotted take into account the variability in
con-ditional fecundability. The reciprocal of the hazard is the mean waiting time in number
of cycles to first conception for a such a “synthetic woman” with these time-constant
characteristics for each menstrual cycle. The increase in median of the reciprocal of the
hazard is almost linear with age of the woman until age 34 when there is an upturn. The
value at age 21 is 1.76 cycles and at age 34 is 3.78 cycles. Consider postponing trying to
group increases from 2.00 to 3.57 cycles. From 28 to 33, median of the reciprocal of the
hazard for our reference group increases from 2.85 to 3.57 cycles. This is a very modest
increase of little practical importance.
Unobserved heterogeneity
The mean and median of the posterior distribution of unobserved heterogeneity, σ, were
0.539 and 0.552. The standard deviation of the posterior distribution was 0.233 and
the 95% credible interval was [0.068, 0.972]. Therefore, there is substantial unobserved
heterogeneity that is not accounted for by age of the woman, coital pattern or the other
covariates included in the model.
Discussion
The participants in the MCFS came from a number of countries so there is some degree
of generalisability of these results, at least to European couples. Most were trying to
avoid pregnancy by using natural family planning methods. Of course, these methods
can also be used to increase the probability of conception by timing acts of intercourse
around the expected time of ovulation. Are the participants in the MCFS (self) selected
on the basis of their fecundability and if so, is this selectivity related to age of the woman
or age of the man? Hopefully, our decision to study first rather than all pregnancies
minimizes any such selectivity.
The time origin for the waiting time to conception is entry into the MCFS rather than
first exposure to the risk of conception. The more time exposed to the risk of having
a first child before entry into the MCFS study, the greater the potential selectivity.
Some couples who had intended to enroll in a natural family planning clinic would have
become pregnant before entry and, therefore, ineligible for our study of first pregnancies.
We investigated this possibility by including an additional variable in our model of the
waiting time to conception. We calculated the time from marriage to entry into the
study and categorised this variable into the following categories: 1) same month as
missing. This variable was not significantly related to the waiting time to conception.
Women must have had no sign of infertility as a precondition for enrollment, so
enrolled women might have higher fecundability at entrance than the general population.
Couples with high fecundability would be more likely to be lost before entry into the
MCFS than couples with lower fecundability. Such selectivity would have a tendency
to reduce our estimated level of fecundability, but not necessarily the age pattern. Is
any selectivity age related? We presume that older women are less fecund than younger
women and if selectivity is against older women, our age of the woman effect would
presumably be less strong than estimated.
Alternative models of the coital pattern were explored. For example, we tried all
the presence/absence combinations inside window A and found that the only significant
difference was between only one act of intercourse and more than one act. While our
model specification may not represent reality, it seems good enough considering that
this variable is only a control variable and we are mainly interested in estimating the
effect of age, net of the coital pattern, rather the studying the day-specific probabilities
of pregnancy and how these depend on the coital pattern.
While this study explicitly models sterility, we have little evidence on how sterility
depends on age of the woman. The only covariate considered for primary sterility was a
dummy variable for the woman being aged 30+ and this variable was not significantly
related to primary sterility.
The sterility/conditional fecundability mixture model has enabled us to model the
effects of age of the woman and man on waiting times to first pregnancy, controlling
for primary sterility and coital pattern. Age of the woman effects were modelled using
a spline, while age of the man effects were modelled using a dummy variable for age:
<35 and 35+. The decline in the mean hazard was very modest from age 28 to 33. The
decline was much more dramatic if a larger age span was used, e.g. from ages 21 to 35.
However, the implied increase in mean waiting time to conception is very modest.
Evidence that a woman’s fecundability declines before the age of 30 is rare. Dunson
et al. (2002, p. 1401) found that “women aged 27-29 years were predicted to have
lower pregnancy rates on average than women aged 19-26 years given equivalent timing
a categorical variable, we modelled the effect of age of the woman smoothly by using
a cubic spline in order to model the effects of age of the woman in a flexible
nonpara-metric manner. The age of woman was not significantly related to the waiting time to
conception, but was in the expected direction of a decline with age. The age pattern
was a decline in the median hazard that was almost linear with age of the woman. For
our reference group of women from Verona with male partner under age 35 with 2+ acts
of intercourse just before or on the day of ovulation (-2, -1, 0), the median value at age
21 is 0.57 and at age 35 is approximately 0.24.
Dunson et al. (2002) found that fecundability, as measured by daily probabilities of
conception relative to ovulation day, declines in the 20s using the MCFS data, but used
different methods and all births. Hence, the study of Dunson et al. (2002) would have
greater power to detect age effects than our study which used only first births. Both
studies evaluate the effects of age of the woman and man on the risk of conception while
controlling for coital frequency and pattern and thus are able to separate the effects
from changes in sexual behaviour with age from effects directly related to ageing. Our
evidence of an almost linear decline in fecundability from the early 20s is limited as the
slope parameter for the spline was not significant.
Can we wait until the early 30s for a first birth? Our evidence is yes (providing you
are not already sterile). Even if our estimated decline in the hazard was significant, the
magnitude of the decline is such that the increase in the mean waiting time to conception
is very modest and of little practical importance.
Notes
1 John W. McDonald is at the Division of Social Statistics, School of Social Sciences
and Southampton Statistical Sciences Research Institute, University of Southampton,
Southampton SO17 1BJ, United Kingdom. E-mail: j.w.mcdonald@southampton.ac.uk.
Alessandro Rosina and Ester Rizzi are at the Istituto di Studi su Popolazione e
Territo-rio, Universit`a Cattolica - Milano, via Largo Gemelli, 1, 20123 Milano, Italy. E-mails:
alessandro.rosina@unicatt.it and ester.rizzi@unicatt.it. Bernardo Colombo is at the
Di-partimento di Scienze Statistiche, Universit`a di Padova, Via Cesare Battisti, 241/243,
2 The MCFS data were collected for a study on daily fecundability run in eight
cen-tres providing services on natural family planning. Details can be found in Colombo
and Masarotto (2000). The authors wish to express their thanks for making these data
available to the authors, and their appreciation for the work done by the general
coordi-nators, the local principal investigators, and the group of investigators of the Department
of Statistics of the University of Padua, Italy.
References
Colombo, Bernardo and Guido Masarotto. 2000. Daily fecundability: First results from
a new data base. Demographic Research - Volume 3, Article 5. Available online: www.demographic-research.org/Volumes/Vol3/5/
Diamond, Ian D., John W. McDonald and Iqbal H. Shah. 1986. Proportional hazards
models for current status data: application to the study of differentials in age at
weaning in Pakistan, Demography 23 (4): 607–620.
Dunson, D.B., D.D. Baird, A. J. Wilcox and C.R. Weinberg. 1999. Day-specific
probabil-ities of clinical pregnancy based on two studies with imperfect measures of ovulation,
Human Reproduction 14 (7): 1835–1839.
Dunson, David B., Bernardo Colombo and Donna D. Baird. 2002. Changes with age
in the level and duration of fertility in the menstrual cycle, Human Reproduction 17 (5): 1399–1403.
Harrell, Frank E. Jr. 2001. Regression Modeling Strategies With Applications to Linear Models, Logistic Regression, and Survival Analysis. New York: Springer.
Larsen, Ulla and James W. Vaupel. 1993. Hutterite fecundability by age and parity:
strategies for frailty modeling of event histories. Demography 30 (1): 81–102.
McDonald, John W. and Alessandro Rosina. 2001. Mixture modelling of recurrent
event times with long-term survivors: Analysis of Hutterite birth intervals. Statistical
Menken, Jane. 1985. Age and fertility: How late can you wait? Demography 22 (4): 469–483.
Menken, Jane, James Trussell and Ulla Larsen. 1986. Age and infertility, Science 233 (4771), 1389–1394.
Thomas, A., D. J. Spiegelhalter and W. R. Gilks. 1992. BUGS: A program to perform
Bayesian inference using Gibbs sampling, in J. M. Bernardo, J. O. Berger, A. P.
Table 1 Effects on primary sterility.
mean 2.5% 97.5%
female <30 0.9612 0.9419 0.9772
female 30+ 0.9613 0.9402 0.9780
Table 2 Effects on waiting time to conception.
mean 2.5% 97.5%
constant 0.411 -0.850 1.613 slope -0.134 -0.314 0.069 knot at age 24 0.001 -0.004 0.005 knot at age 28 -0.002 -0.017 0.015 knot at age 32 -0.005 -0.042 0.028
age of male <35
age of male 35+ -0.700 -1.538 0.117
Verona
Milano -0.278 -0.699 0.152 Lugano 2.093 0.612 3.662 Paris -0.348 -1.351 0.597 D¨usseldorf 0.668 -0.196 1.506 London 0.620 -0.450 1.683 Brussels 0.057 -1.299 1.383
A no, B no, C yes -3.935 -4.852 -3.107 A no, B yes, C no -0.931 -1.832 -0.136 A no, B yes, C yes -0.794 -1.338 -0.274 only 1 in A -.590 -0.985 -0.194
2 or 3 in A
[image:19.595.76.314.266.688.2]