Edited by Tim Callan
June 2013
Edited by Tim Callan
RESEARCH SERIES
NUMBER 31
June 2013
Available to download from www.esri.ie
The Economic and Social Research Institute (Limited Company No 18269)
Registered office: Whitaker Square, Sir John Rogerson's Quay, Dublin 2
The Economic Research Institute was founded in Dublin in 1960, with the assistance of a grant from the Ford Foundation of New York. In 1966 the remit of the Institute was expanded to include social research, resulting in the Institute being renamed The Economic and Social Research Institute (ESRI). In 2010 the Institute entered into a strategic research alliance with Trinity College Dublin, while retaining its status as an independent research institute.
The ESRI is governed by an independent Council which acts as the board of the Institute with responsibility for guaranteeing its independence and integrity. The Institute's research strategy is determined by the Council in association with the Director and staff. The research agenda seeks to contribute to three overarching and interconnected goals, namely, economic growth, social progress and environmental sustainability. The Institute's research is disseminated through international and national peer reviewed journals and books, in reports and books published directly by the Institute itself and in the Institute's working paper series. Researchers are responsible for the accuracy of their research. All ESRI books and reports are peer reviewed and these publications and the ESRI's working papers can be downloaded from the ESRI website at www.esri.ie
Tim Callan and John FitzGerald are Research Professors, John R. Walsh is a Senior Research Analyst, Claire Keane is a Research Analyst and Michael Savage is a Research Assistant at the Economic and Social Research Institute. Stuart Adam is a Senior Research Economist at the Institute for Fiscal Studies, London.
This paper has been accepted for publication by the ESRI. The authors are solely responsible for the views expressed which are not attributable to the ESRI, which does not itself take institutional policy positions.
Acknowledgements
Thanks to numerous referees for providing comments that helped to improve the papers in this volume. Many thanks to Regina Moore for ensuring the manuscript went to print under time pressure as well as Deirdre Whitaker for proof-reading.
Table of Contents
FOREWORD ... vii
Frances Ruane
1. TAXES ON INCOME:IRELAND IN COMPARATIVE PERSPECTIVE ... 1
T. Callan, C. Keane, M. Savage, J.R. Walsh
2. HOUSING TAXATION AND SUPPORT FOR HOUSING COSTS ... 25
Foreword
Frances Ruane
The annual Budget Perspectives Conference provides a forum for discussing key public policy issues of both immediate and longer-term importance. Against a continuing backdrop of major economic and fiscal challenges and a continuing fiscal adjustment under the IMF/EU programme, budgetary policy must be seen to support Ireland’s return to a sustainable growth path.
This year’s conference provides an opportunity for policymakers, social partners and researchers to engage on some of the major issues involved in this adjustment. The papers presented at the conference cover both macroeconomic and microeconomics issues. The conference takes place earlier than usual this year due to the announcement that Budget 2014 will be unveiled in October as opposed to the usual December date. This in turn reflects the recent introduction of measures that every EU member state would be required to submit its budget to the European Commission for scrutiny in October to ensure that it complies with EU law.
In the opening session of the conference a presentation by John FitzGerald (ESRI) examines the issue of fiscal sustainability from a medium-term perspective. It will consider how to approach the framing of medium-term fiscal policy in an uncertain environment ̶ what would be a “no regrets” fiscal policy? It considers what should be the approach to both the 2014 and 2015 Budgets under different economic scenarios as well as the appropriate fiscal stance over the rest of the decade. Finally, it discusses some longer-term strategic issues on the public finances generally and on taxation in particular. The presentation will draw on research being undertaken for a Medium-Term Review to be published by the ESRI in mid-Summer 2013.
This is followed by a series of presentations on current macroeconomic issues by three experts in the area ̶ Alan Ahearne (National University of Ireland Galway), Peter Breuer (International Monetary Fund) and Philip Lane (Trinity College Dublin). The slides from these are available on the ESRI website www.esri.ie
particular interest in a year when the Irish LPT comes into effect. To provide an external reference point, Stuart Adam (Institute for Fiscal Studies) presents a paper entitled “Housing Taxation and Support for Housing Costs” based on detailed analysis of the UK property tax. His paper reviews the economic rationale behind the taxation of housing and how it should be taxed, drawing on the research and analysis undertaken for the Mirrlees Review on Taxation. The Council Tax system in place in the UK is examined in detail, and consideration is given to various design issues, including deferral and the question of providing support for low income families with their housing costs.
1. Taxes on Income: Ireland in
Comparative Perspective
T. Callan, C. Keane, M. Savage, J.R. Walsh
11
I
NTRODUCTIONIreland’s fiscal adjustment has involved substantial increases in some taxes, yet tax revenues as a share of national income are still seen as low in an international context. There has been considerable debate about the relative roles of expenditure cuts and tax increases in the process of adjustment. Here we focus not on the adjustment path, but on potential long-term outcomes for the ratio of tax revenues to national income. Thus, rather than question whether the adjustment should be equally shared between expenditure and tax, or more heavily weighted to one or the other, we explore what a sustainable revenue level might be for the future, by comparing our situation with that of other EU countries. From this revenue level, the state would have to finance ongoing debt service payments, public services, and redistributive transfers. It is true, of course, that the issue of what tax level is sustainable depends also on the extent of social and political support for publicly provided services; nonetheless, it is of particular interest to compare the outcomes which have been arrived at in other EU countries.
In this paper we do not take a specific view as to the appropriate level of taxes.2 This is a broader social and political choice, which economic analysis can inform but not decide. Our analysis provides information relevant to such choices.
1 We are grateful to two referees for helpful comments. Thanks are also due to Frances Ruane and Emer Smyth for
insightful comments.
We thank the Central Statistics Office (CSO) for providing access to the Survey on Income and Living Conditions data, on which the SWITCH tax-benefit model is based. We are grateful to Stuart Adam and James Browne of the Institute for Fiscal Studies, for estimates of the UK distribution of marginal effective tax rates, from the IFS tax-benefit model based on the Family Resources Survey. The Family Resources Survey is Crown copyright material and is reproduced with the permission of the Controller of HMSO and the Queen’s Printer for Scotland. It was obtained from the Economic and Social Data Service and the UK Data Archive. Thanks are also due to Xavier Jara and Alberto Tumino for supplying information on marginal effective tax rates for EU-15 countries based on the EUROMOD tax-benefit model: see Jara and Tumino (2013) and https://www.iser.essex.ac.uk/EUROMOD for further details on methods, data and
the EUROMOD model., which is maintained, developed and managed by the Institute for Social and Economic
Research (ISER) at the University of Essex in collaboration with national teams from the EU member states and financially supported by the European Commission.
The authors alone are responsible for the analysis and interpretations in this paper.
2 Honohan (2009) pointed towards tax and spending ratios in the late 1990s/turn of the millennium as approximating
Following an initial look at overall tax to national income ratios, we focus on income-related taxes, which bulk large in overall tax revenue for most countries. Property taxes represent another potential revenue source, with a new Local Property Tax coming into force in the second half of 2013, and operating for its first full year in 2014. Issues relating to property taxation were analysed in Keane
et al. (2012) and Callan et al. (2012). Adam (2013, this volume) also analyses the taxation of housing drawing on the recent Mirrlees Review, and illustrates the issue with respect to UK experience.
We compare Ireland’s income-related taxes with those of other EU-15 countries. We go beyond aggregate comparisons of tax/GNP ratios to consider the micro-level structure of marginal tax rates: this has a key role in determining revenues, and also influences the trade-offs between efficiency and equity considerations. This analysis goes beyond selected examples to examine the structure of marginal tax rates for large-scale nationally representative samples of workers in Ireland and in other EU countries.
We explore these issues using a combination of macroeconomic and microeconomic perspectives. Aggregate ratios of tax to national income are examined in Section 2. A key issue here is the appropriate denominator to act as a measure of taxable capacity. For most countries, GDP and GNP are very similar, but for Ireland GDP is more than 20 per cent higher than GNP. We show how this can distort international comparisons, and suggest an alternative approach based on work by IFAC (2012) and Callan and Savage (2013), and taking into account recent work by FitzGerald (2013) on the impact of redomiciled plcs. Our approach, leads to a different view of Ireland’s position in terms of overall and income-related taxes.
the impact of the different direct tax policy choices made in the UK and Ireland for both marginal tax rates and the distribution of income. In this context, we can make some detailed bilateral comparisons with work done in the UK by Adam and Browne (2010). Section 6 draws together the main conclusions and some issues for further research.
A brief word on terminology may be helpful in order to avoid possible confusion. We use the term “income tax” to refer just to the statutory income tax. The terms “income-related taxes” and “taxes on income” are used to include social insurance contributions and other taxes which are levied on income – such as the Universal Social Charge. Employee social insurance contributions are always included in our analysis, and for some comparisons, employer social insurance contributions are also taken into account. When employer social insurance contributions are included, this will be clearly stated.
2
T
AXABLEC
APACITY:
A
GGREGATEP
ERSPECTIVES32.1 Measuring Taxable Capacity
GDP is the most widely used indicator of taxable capacity in international comparisons. Ratios of tax revenue to GDP then measure the extent to which that capacity is used. For most countries, levels of GDP and GNP are quite similar. For 13 out of the EU-15 countries, the ratio of GDP to GNP was within the range 97 per cent to 104 per cent in 2011. Ireland and Luxembourg are outliers in the EU-27, with GDP more than 20 per cent higher than GNP. The difference between the two is net factor payments, outflows which are largely due to the repatriation of profits by multinational companies.
McCarthy (2004, 2010) has argued that the lower potential tax yield from net factor outflows means that, faced with a choice between GDP and GNP as a measure of taxable capacity, it is GNP which should be preferred. The Irish Fiscal Advisory Council (IFAC, 2012) reconsidered these arguments and came to the view that:
Taking either of the extremes of GDP or GNP is problematic. GDP is problematic as a measure of fiscal capacity because a euro of the excess of GDP over GNP (which is dominated by multinational profits) is likely to provide less revenue capacity than a euro of GNP. On the other hand, going to the other extreme of using just GNP puts zero weight on the revenue potential of the excess component. This suggests the value of a hybrid
measure, where an appropriate relative value is placed on a euro of the excess component relative to a euro of GNP.
IFAC (2012)
Econometric analysis by IFAC suggested that a hybrid measure, using all of GNP and 40 per cent of the excess of GDP over GNP (i.e., 40 per cent of net factor outflows) might provide a useful alternative measure of fiscal capacity. In our view this hybrid measure is better than either GNP or GDP alone.4 More recently, FitzGerald (2013) analysed the impact of a rapid growth in redomiciled plcs, which are headquartered in Ireland but due to double taxation agreements, pay tax in another jurisdiction. The net effect – for reasons described by FitzGerald – is that these companies raise measured GNP in Ireland, but “...confer no significant benefit on the Irish economy in terms of employment or taxes”.5 Undistributed profits of redomiciled plcs are the key factor underlying this phenomenon and these show very rapid growth between 2009 and 2010
One interpretation of IFAC’s findings is that the estimates reflect the low rates of corporation tax which have been in force in Ireland for many years. In principle, it could be argued that the taxable capacity of net factor outflows is greater than that estimated on this basis. Callan and Savage (2013) note three reasons why the future taxable capacity of net factor outflows may be not much higher than that estimated from the past.
1. Effective tax rates on corporate profits6 are between 10 and 25 per cent in most EU countries including all the smaller countries bar Malta. Significantly higher rates are found in the five largest EU economies (Germany, France, the UK, Italy and Spain).
2. A cut in corporation profits tax was estimated by Conefrey and FitzGerald (2011) to lead to a rise in activity. If corporation tax were to rise, this would be expected to reduce the base to which the profits tax applied.
3. Moves towards a common consolidated corporation tax base, using such metrics as sales or employment, would tend to apportion more of corporation tax receipts to larger countries.
4 Similar results are obtained by a related approach, excluding estimates of multinational profits, and excluding taxes
paid on them, from both the numerator (aggregate tax) and denominator (i.e., using GNP) of the calculated tax ratio. 5 In fact, as FitzGerald (2013) points out, the net effect is a negative for the Exchequer because the higher measured
GNP raises Ireland’s contribution to EU funding, without any corresponding increase in Exchequer revenues.
6 Elschner and Vanborren (2009) using the approach developed by Devereux and Griffith (2003) to identify the
2.2 International Comparisons: Overall Tax Ratios
Table 1 presents both the traditional comparison of aggregate tax to GDP ratios, as per the OECD, and an estimate for Ireland of a taxable capacity measure taking account of the limited capacity to tax multinational profits and the impact of redomiciled plcs, which do not generate tax for Ireland. As noted above, Ireland is not alone in having a lower rate of tax on multinational profits than its overall average tax rates and the extent of multinational profits declared in Ireland is in part due to a low tax regime. For these reasons we present results which take account of the low rate of tax on repatriated multinational profits (following the approach of IFAC, 2012) and the fact that no tax is payable by redomiciled plcs (as per FitzGerald, 2013). The base we use is GNP, less the element attributable to redomiciled plcs, plus 40 per cent of Net Factor Outflows (i.e., the amount by which GDP exceeds GNP).
TABLE 1 Total Taxes as a Proportion of National Income, EU-15 Countries, 2011
Country National Income Percentage of
Ireland – GDP 28.5
Greece 31.2
Portugal* 31.3
Spain 31.6
Ireland – hybrid (see text) 33.8
United Kingdom 35.5
Germany 37.1
Luxembourg 37.1
Netherlands* 38.7
Austria 42.1
Italy 42.9
Finland 43.4
Belgium 44.0
France 44.2
Sweden 44.5
Denmark 48.1
Source: Callan and Savage (2013), based on OECD Revenue Statistics, www.oecd.org and CSO National Accounts for Ireland.
Notes: *Indicates that 2010 is the latest available year.
[image:15.595.187.419.337.635.2]points lower than Spain, Greece and Portugal, it has a ratio 2 points higher than these countries and less than 2 points lower than the UK.
There is a wide range of tax to GDP ratios even within the EU-15 countries. The lowest values are in Spain, Greece and Portugal, with tax ratios between 31 and 32 per cent. Six countries (Austria, Italy, Finland, Belgium, France and Sweden) have tax ratios between 42 and 45 per cent, while the highest ratio is in Denmark (48 per cent). There is, therefore, substantial variation between countries in the set of government provided services and redistributive transfers that these societies are willing to finance – and willingness to pay also depends on the services provided. Besley (2012), in his ESRI Geary lecture, analysed some of the forces which have underpinned the development of these outcomes. Here it is sufficient to note that Ireland’s tax ratio is towards the low end of the scale. Leaving aside questions of desirability, it seems possible, therefore, that a transition to a higher tax ratio would be feasible, without being classified as a ‘high tax’ country.
The historical experience provides further evidence on this. Our own estimates suggest that Ireland, circa 2000, had a tax to national income ratio about 3 percentage points higher than at present. During the last decade, Germany has kept the tax to GDP ratio between 35 and 37 per cent. Over the same period, the UK has operated with a tax to GDP ratio between 34 and 36 per cent. These parallels suggest that tax ratios significantly higher than those observed at present are likely to be a realistic option.
How might these results be affected by the depth of the current recession? Currently spending is elevated above normal levels, and revenues depressed, because of the severity of the recession. Thus, with a recovery, expenditure on welfare would fall, while tax revenues would rise. It is not clear, however, whether this would involve a rise in the tax to national income ratio in Ireland relative to that in other countries. Analysis of recovery paths in the forthcoming
Medium-Term Review (FitzGerald and Kearney, 2013) will be of interest in this regard.
2.3 International Comparisons: Income Related Taxes
of a ‘hybrid’ GDP/GNP measure as we were examining taxes from all sources (individual incomes, company profits, consumption based taxes etc.). Net factor outflows from repatriated profits do not form part of the base for the income taxes examined now: GNP is therefore a more appropriate measure of national income to use. Thus, for Ireland, we present a figure based on GDP (as commonly shown in international comparisons) and a figure based on GNP, adjusted for the impact of redomiciled plcs (FitzGerald, 2013), which we argue gives a more appropriate comparison. For other countries a GNP-based figure would be very similar to the GDP-based results reported here, with the exception of Luxembourg, where the ratio would rise from 19 per cent to about 24 per cent.
As with the overall tax ratio, Ireland emerges as one of a group of low tax rate countries, rather than the very lowest. Using the more appropriate GNP-based figure, Ireland’s income tax to national income ratio is 17.5 per cent – about 4 per cent higher than the GDP based figure. This is slightly higher than in the UK and well above the levels in Greece and Portugal – whereas the GDP based figures suggest that Ireland has the lowest rate in the EU-15. Again, it is important to bear in mind the variety and level of publicly provided services that are available in each of these countries and that are likely to be strongly correlated with the level of income tax and social insurance that is levied on individual incomes as well as the willingness to pay such taxes.
TABLE 2 Taxes on Income of Individuals as a Proportion of National Income, 2011
Country Percentage of National Income
Ireland – GDP 13.6
Portugal* 14.6
Greece* 15.2
United Kingdom 16.5
Ireland – GNP 17.5
Spain 18.9
Luxembourg 19.2
Sweden 21.7
Netherlands* 22.7
Germany 23.5
Austria 23.9
France 24.3
Italy 24.9
Finland 25.3
Denmark 25.5
Belgium 26.5
Source: OECD Revenue Statistics, www.oecd.org.
Notes: Taxes on individual income constructed from OECD categories 1100 (Taxes on Income, Profits and Capital Gains of individuals)
plus Social Security Contributions (category 2000, including contributions by employees, employers and self-employed); capital gains tax element is then excluded.
3
M
ARGINALE
FFECTIVET
AXR
ATES:
I
RELAND INC
OMPARATIVEC
ONTEXTSimilar average tax rates may have quite different implications for the marginal tax rates faced by individuals – much depends on the extent of exclusions from the tax base and the rate structure of the income-related taxes. Marginal tax rates are of fundamental importance in shaping financial incentives – not only the financial incentive to work, but also the incentives to engage in (legal) tax avoidance and (illegal) tax evasion. All three kinds of response can have an impact on the size of the taxable income, and a great deal of research has focused on what is termed the elasticity of taxable income. (See for example, Kopczuk, 2005 and Piketty et al. 2011). The structure of marginal tax rates also plays a key role in determining average tax rates, tax revenues and the nature and extent of income redistribution through the tax system
Detailed microsimulation analysis is needed to assess the impact of different tax systems on the marginal effective tax rates faced by individuals in different countries. Until recently there has been limited cross-country analysis on this topic.7 However, recent studies by Adam and Browne (2010) for the UK and Jara and Tumino (2013) for EU countries make it possible to undertake some useful bilateral and multilateral comparisons. In this section we focus on the broad EU-15 context, using the work of Jara and Tumino, supplemented by new SWITCH
analysis. Section 5 will look more closely at Ireland and the UK, where more detailed comparisons are possible drawing on the work of Adam and Browne (2010) and new SWITCH-based analysis.
Marginal effective tax rates (METRs) measure how much of an extra euro in earnings is taken in taxes or by way of a withdrawal of benefits from the individual or his/her partner. Thus, METRs help to measure a key financial incentive to work – the incentive to increase earnings, whether via additional time, effort or skill. The proportion of an extra euro in earnings which is retained by the worker is simply (1-METR).8
Jara and Tumino (2013) provide an analysis using the EUROMOD tax-benefit model which allows us to locate the Irish systems in a wider EU context.9 The
7 Immervoll (2004) is one such study, but the data and policies in this analysis are from the mid-1990s.
8 This is where the METR is in decimal terms. With METR defined in percentage terms, the percentage retained by the
worker is 100 minus METR.
9 It is worth noting that tax benefit models are based on household surveys which do not generally contain information
EUROMOD results for Ireland are based on a limited version of the EU SILC data for 2008 – before the main effects of the recession on employment. Instead, we use results based on SWITCH; which use the full detail of the CSO´s SILC for 2010, incorporating the severe effects of the downturn between 2008 and 2010. Both the SWITCH results and the EUROMOD results of Jara and Tumino include the effects of recent policy changes – up to 2010 for EUROMOD, and up to 2011 for
SWITCH:
Jara and Tumino summarise the following key features for all EU countries – we focus here on the EU-15:
• Mean METR: This is the average METR for all workers.
• Median METR: This is the METR for the worker who is in the middle of the ranking from lowest METR to the highest METR.
• METR at 25th percentile: This is the METR for the worker who is halfway between the lowest METR and the median ranked worker. Thus, this is the highest METR faced by any of the 25 per cent of taxpayers with the lowest METRs.
• METR at 75th percentile: This is the METR for the worker who is halfway between the very highest METR and the middle ranked or median METR. All of the 25 per cent of workers with METRs above this must, therefore, have an METR which is at least equal to this value and more usually higher.
The distribution of marginal tax rates helps to determine the aggregate amount of revenue raised, and how the tax burden is distributed across the income distribution. Progression in marginal tax rates is a common feature internationally; but even a flat rate of tax would generate progression in average tax rates, with the extent of progressivity depending on the size of the tax free allowance or tax credit. Our focus here is not on standard measures of progressivity, but on another aspect of the marginal tax rate distribution: we compare across countries the marginal tax rates faced by individuals who are at a number of “fixed points” in the marginal tax rate distribution e.g., the median marginal tax rate, with half of earners facing a higher rate and half a lower rate; and similarly for each quarter (technically, quartile) of workers. In this way we can get a picture which captures some key aspects of the full distribution of tax rates.10
10 A more comprehensive bilateral comparison is undertaken with the UK in Section 5, using a graphical technique that
The METRs for the 25th percentile of the distribution are a good indicator of marginal tax rates on low income workers. By 2011, the value for Ireland is, at 28 per cent, the fourth lowest – but just four percentage points below the midpoint of the range of values i.e., the 32 per cent seen in France). Ireland is also fourth lowest for the median value, some 9 percentage points below the middle-ranking country (i.e., Luxembourg at 40 per cent). Conversely, the METR at the 75th percentile, a good indicator of the marginal tax rates faced by higher earners, is, third highest – and the mean METR is also above average. This indicates that higher earners face a higher disincentive to earn more (through increased work hours or work effort). This reflects the fact that that when a higher proportion of the lower paid face zero or low tax rates higher taxes must be levied on those further up the income distribution to reach a given revenue target.
We will undertake some direct and more detailed METR comparisons with the UK in Section 5. It is, therefore, worth noting its location in these distributions. The UK is close to the midway point in terms of most measures shown in Table 3, except for its ranking at the 75th percentile where it has the fourth lowest value for the METR, This reflects the fact that a low proportion of the UK workforce face the higher or top rates of tax.
TABLE 3 Marginal Effective Tax Rates, Employed Population (Income Tax, Employee Social Insurance Contributions, Benefit Withdrawal), 2010
Mean METR Median METR METR at 25
th percentile of
METRs* METR at 75
th percentile
of METRs†
Greece 23 Greece 20 Spain 6 Spain 33
Spain 27 Spain 27 Portugal 11 Portugal 35
Portugal 27 Portugal 27 Greece 14 Greece 37
Sweden 36 IRELAND 31 IRELAND 28 UK 42
Austria 39 Sweden 36 Luxembourg 29 Luxembourg 47
Italy 39 Italy 39 Sweden 29 Italy 47
UK 39 UK 39 UK 31 Austria 47
Luxembourg 40 Luxembourg 40 France 32 Finland 49
Netherlands 40 France 41 Finland 33 France 49
IRELAND 41 Denmark 41 Netherlands 34 Germany 50
France 41 Netherlands 43 Austria 36 Netherlands 50
Finland 42 Austria 43 Italy 37 Sweden 52
Denmark 45 Finland 44 Germany 39 IRELAND 52
Germany 45 Germany 45 Denmark 41 Denmark 55
Belgium 54 Belgium 55 Belgium 53 Belgium 59
Notes: *This is the maximum METR faced by the 25 per cent of taxpayers with the lowest METRs
†This is the minimum METR faced by the 25 per cent of taxpayers with the highest METRs
Sources: Estimates for Ireland 2011 are from SWITCH. Estimates for all other countries were kindly supplied by Xavier Jara using the
EUROMOD model; these estimates are preliminary. Details of the methods and other relevant results can be found in Jara and
4
T
OPT
AXR
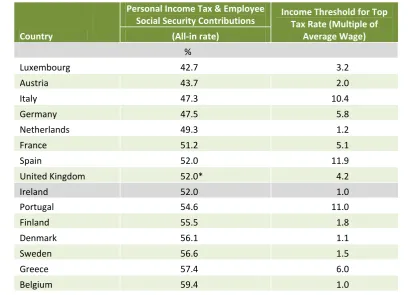
ATESHow does Ireland’s top tax rate compare with those of other EU-15 countries? Table 4 reports the top rates of direct tax for employees (income tax together with employee social insurance contributions, but excluding employer social insurance contributions) for EU-15 countries in 2012. The rates range from 43 per cent to almost 60 per cent. A range of 47 per cent to 57 per cent covers 11 of the 15 countries. The Irish rate of 52 per cent is in the middle of this distribution. It comprises an income tax rate of 41 per cent, Universal Social Charge (which is also a tax on income) of 7 per cent, and employee PRSI of 4 per cent. A higher rate of Universal Social Charge is paid by self-employed persons with an income over €100,000 per year, bringing the top tax rate for this group to 55 per cent. This could be questioned on both equity and efficiency grounds. Horizontal equity requires the equal treatment of equals – it is not clear what difference justifies the 3 per cent surcharge on the self-employed. As for efficiency, given that the self-employed have more flexibility in terms of labour supply, and perhaps also in terms of the income/capital gains split, this would not suggest that a higher tax rate was warranted.
TABLE 4 Top Tax Rates in EU-15 Countries, 2012
Country
Personal Income Tax & Employee
Social Security Contributions Income Threshold for Top Tax Rate (Multiple of Average Wage) (All-in rate)
%
Luxembourg 42.7 3.2
Austria 43.7 2.0
Italy 47.3 10.4
Germany 47.5 5.8
Netherlands 49.3 1.2
France 51.2 5.1
Spain 52.0 11.9
United Kingdom 52.0* 4.2
Ireland 52.0 1.0
Portugal 54.6 11.0
Finland 55.5 1.8
Denmark 56.1 1.1
Sweden 56.6 1.5
Greece 57.4 6.0
Belgium 59.4 1.0
Sources: http://www.oecd.org/tax/tax-policy/oecdtaxdatabase.htm#pir, Table I7, Top marginal combined personal incomes tax rates on
gross wage for a single individual.
[image:21.595.91.500.403.698.2]While the top rate of tax in Ireland is not unusual in an EU context, it applies to a much lower level of income than elsewhere. Table 4 shows the income threshold at which taxpayers become liable to pay at the top income tax rate, expressed as multiples of the average wage in each country. A high value indicates that few taxpayers are liable; a low value, close to 1, indicates that a substantial proportion of taxpayers will be liable to pay tax at this top rate. Indeed, the numbers of individuals liable to pay the tax are likely to be very sensitive to this ratio. Large differences could be expected between Ireland, Belgium and Denmark, which have thresholds close to the average wage, and Sweden and Finland, which have thresholds which are 50 to 80 per cent higher than the average wage. For 8 of the 15 countries, the threshold is more than double the average wage – and for 7 of these countries the threshold is set at more than 3 times the average wage. This greatly reduces the numbers of taxpayers liable to pay at this rate. In Italy, Spain and Portugal a worker can earn more than ten times the average wage before they face the top tax rate. It is worth bearing in mind, however, that it is not simply the top tax rate that matters, but all of the rates and bands. This is why the analysis in Sections 3 and 5, which capture the full complexity of the systems and their interactions with the distributions of income, provides a more comprehensive comparison of the nature of the income-related taxes in different countries.
Recent changes in UK policy have reduced the top statutory tax rate from 50 per cent to 45 per cent. A 2 per cent National Insurance contribution continues to be payable in addition. But Adam et al. (2013) show the need for care in assessing the top marginal effective tax rate:
Since 2010–11, the income tax personal allowance has been withdrawn above incomes of £100,000. The allowance is reduced by 50p for every pound of income above £100,000, gradually reducing it to zero for those with incomes above £118,880 in 2013–14. Losing 50p of personal allowance means that 50p becomes taxable at the individual’s marginal income tax rate of 40 per cent, and therefore 20p more income tax to pay alongside the 40p that would ordinarily be payable on an extra pound of income. Thus between £100,000 and £118,880, people face paying 60p more in income tax for each extra £1 of income: in effect, the marginal income tax rate in that range is 60
per cent.
Adam et al. (2013)
There has been some debate in Ireland concerning a new top tax rate on incomes above €100,000 per year. We do not attempt here to give a comprehensive assessment of the costs and benefits of such a proposal, but point to two facts which are relevant to the debate
• A new rate of 48 per cent on incomes of more than €100,000 would bring the top tax rate for employees to a total of 59 per cent11 (48 per cent tax, 7 per cent USC and 4 per cent PRSI). This would be higher than 13 of the other 14 members of the EU-15 group.
• The amount of revenue which could be raised, assuming no change in behaviour, was estimated by the Revenue authorities as €365 million. In the context of our earlier discussion of Ireland´s tax to national income ratio it should be noted that this would amount to 0.3 per cent of GNP.
Taken together, these facts point to a rather limited scope for tax increases on such high incomes to contribute to a substantial upward shift in the ratio of tax to national income.
TABLE 5 Distribution of Income over Income Bands
% of Gross Income in Income Band
Income Band % of all income % of income above €16,500
0-10,000 21.1
10,000-16,500 12.3
16,500-20,000 5.9 8.8
20,000-30,000 13.8 20.7
30,000-40,000 10.4 15.6
40,000-50,000 7.5 11.3
50,000-60,000 5.6 8.4
60,000-70,000 4.1 6.1
70,000-80,000 3.0 4.5
80,000-100,000 4.2 6.4
100,000-150,000 4.5 6.7
150,000+ 7.6 11.3
100.0 100.0
Source: SWITCH, based on SILC 2010.
11 As noted above, a top tax rate of 55 per cent applies to self-employed persons with incomes over €100,000, because
When considering substantial shifts in the share of income to be gathered in income tax, therefore, it is necessary to look beyond increases in top tax rates. This reflects an essential feature of the arithmetic of income taxation. Revenue depends on average tax rates. While we usually think of average tax rates as the total tax bill divided by income, another way of arriving at the same answer is to take the simple average of the marginal tax rate on each successive euro of income. Viewed in this way, it is clear that while low marginal tax rates are desirable, low marginal tax rates on low and middle incomes also tend to depress the average tax rate on those with higher incomes as high income earners also benefit from the tax credits in place to ensure lower earners face zero or low tax rates.
Further evidence on the structure of the income tax base is given in Table 5. Statistics on the distribution of gross income usually count the numbers of persons or tax units in each income class, and report their total gross income. Table 5 takes a different approach, motivated by the fact that tiered tax rates apply to successive tranches of income e.g., a zero tax rate on the lowest slice of income,12 a standard rate of tax on the next slice, and a top rate on all income above a certain threshold. Given that income taxes have this structure, it is of interest to know where income is located in terms of the successive slices of income from the bottom to the top. Table 5 provides two perspectives on this. We look first at the distribution of total income across all bands. About one-third of all income is in the bands below €16,500 per annum, which are currently exempt from tax. A further 30 per cent lies in the bands between €16,500 and €40,000 per annum, with 25 per cent in the ranges €40,000 to €100,000. While top income earners have a substantial share of total income, the share of that income which is itself above €100,000 is about 12 per cent.
How do these figures change if we focus on incomes above the levels currently exempted from tax by the personal and PAYE tax credits (about €16,500 per annum)? Close to two-thirds of all income excluding this “bottom slice” is in income ranges between €16,500 and €60,000 per annum. The remaining third is split almost evenly between incomes in the range €60,000 to €100,000 and over €100,000.
5
I
RELAND AND THEUK:
A
NALYSING THEI
MPLICATIONS OFT
AXP
OLICYC
HOICES We now move to a more detailed comparison of the distribution of METRs in Ireland and how they compare with those found in the UK. We choose to focus on the UK for a more detailed analysis for two main reasons. First, the links between the Irish and UK labour markets are particularly strong. Second, the UK is our nearest neighbour not only geographically but also in terms of the ratios of overall tax and income-related taxes to national income, as illustrated in Tables 1 and 2.We now present a comparison of the distribution of METRs in Ireland and the UK, shown in Figure 1 below. In order to maintain comparability with the approach of Adam and Browne (2010), employer social insurance contributions (employer’s PRSI in Ireland, employer’s National Insurance Contributions in the UK) are taken into account. Thus, we measure the proportion of total labour cost (earnings plus employer’s social insurance contributions) which is taken in tax and/or social insurance contributions.
FIGURE 1 Marginal Effective Tax Rates (METRs) for UK and Ireland, 2011
% of workers (y-axis) with METR below value shown on x-axis
Note: UK estimates were kindly provided by Stuart Adam and James Browne of the Institute for Fiscal Studies using the IFS tax and benefit microsimulation model, TAXBEN, run on uprated data from the 2008-09 Family Resources Survey. They refer to working adults. Irish estimates from SWITCH analysis for this paper.
0 20 40 60 80 100
% o
f W
or
k
in
g A
du
lt
s
0 20 40 60 80 100
Marginal Effective Tax Rate (%)
UK 2011 (TAXBEN, IFS)
Figure 1 above should be read as follows. For a given value of the marginal effective tax rate on the x-axis, the graph shows the percentage of workers who have a marginal effective tax rate below that level. Thus, for a given METR level (on the x-axis), if the Irish (continuous) line lies above the UK (dotted) line, a higher proportion of Irish workers have METRs below that level than is the case for UK workers. For example, comparison of the position of the Irish and UK lines at an METR of 50 per cent shows that just under 60 per cent of Irish workers face a METR of 50 per cent or lower while over 80 per cent of workers in the UK have a rate at or below this level. The vertical sections of the graphs occur where large proportions of workers face the same tax rate (e.g., the standard rate of tax, plus 4 per cent PRSI, plus USC).
The main differences are as follows. The UK has more workers on the very lowest tax rates, but for values between 10 and about 35 per cent, Ireland has a higher proportion than the UK facing rates below these levels. The biggest gap, however, occurs because about one-third of Irish workers face the top rate of income tax – leading to a marginal effective tax rate, including employer social insurance, of close to 57 per cent. This ties in with the findings shown in Table 4 – in Ireland a worker on the average wage faces the top tax rate while in the UK the top tax rate does not apply until a worker earns more than four times the average wage. The proportion of UK workers facing such high tax rates is, therefore, much lower.13
As seen in Section 2, income-related taxes account for a similar proportion of GNP in Ireland and the UK. While the UK tax take is of similar size, the UK system gathers this revenue in a way which tends to produce a different pattern of marginal effective tax rates as shown in Figure 1. These differences in tax structure also have implications for the distributional impact of tax policy, which we examine more closely in this section. The choice of the UK for this purpose does not mean that we are recommending a move to a UK-style system. The reason for undertaking the analysis is to begin to clarify what is involved in possible reform choices.
In order to compare the Irish and UK systems more closely, we construct a “UK-style” tax system (including employee social insurance contributions) which can be translated into the Irish context to allow for direct comparisons of the two
13 For both Ireland and the UK, marginal effective tax rates of about 60 per cent or higher indicate that there must be
systems on the same population. The major features of the UK income tax system which are taken into account are:
• A personal allowance of £9,440.
• A standard rate band of £32,010, on which tax is payable at 20 per cent.
• A higher rate band of £117,990, on which tax is payable at 40 per cent.
• A top rate of tax of 45 per cent.
As regards social insurance contributions, the key elements captured in our analysis are:
• An employee contribution rate of 12 per cent, above a low threshold.
• An upper earnings limit close to £41,450.
• A rate of 2 per cent on earnings above this limit.
• For the self-employed, a contribution rate of 9 per cent between lower and upper profits limits (similar to the employee earnings limits), and 2 per cent above the upper limit.
Working and Child Tax Credits are not included in our comparison. Family Income Supplement can be seen as playing a similar role to the Child Tax Credits, though with a different structure, and FIS is therefore retained in our analysis of a UK-styles system. The means-tested assistance provided by Working Tax Credit is not included in the current analysis. The Universal Benefit reforms currently under way involve a move towards a benefit approach rather than a tax credit approach for the future.
This system of income tax and social insurance contributions is used to replace the Irish income tax, employee PRSI and Universal Social Charge. There are, of course, some elements of the UK system which could not, in the time available, be included in the analysis. Chief among these is the fact that the UK system withdraws the Personal Allowance for those with incomes above £100,000 per annum: this feature of the system is not modelled in our current approach.14 The scale of the revenues involved in these features mean that they would have very limited impact on our findings.
14 There are also some smaller items which are not included. The self-employed pay a flat rate of £2.70 per week on
Money value parameters (such as allowances and tax bands) are translated into the Irish context as follows. Initially, we convert all parameters to euro values simply using current exchange rates. Given that there are differences between the Irish and UK income distributions, however, there is no guarantee that this will result in a system which has the same overall average tax rate as the initial Irish system – even though overall average tax ratios for income related taxes are similar for the two countries. In fact, this converted UK system would raise significantly higher revenues than the initial Irish system. However, we then adjust three key parameters – personal allowances, and the widths of the two bands – to ensure that the UK-style system raises the same revenue as the current Irish system. This involves an increase in the allowances and band widths to reach the following values:
• Personal allowance: €13,162
• Standard rate band: €44,632
• Higher rate band: €209,150
These values are similar to those which would be obtained by applying a PPP-adjusted exchange rate.
Direct comparison of these parameters with the existing Irish system is made difficult because the UK system still uses an allowance structure, while Ireland has moved to a tax credit structure. However, the following comparisons can be made:
TABLE 6 Key Tax Parameters: Ireland, 2013 and UK-style Tax System*
Ireland, 2013 Ireland with UK-style System, Adjusted to be
Revenue Neutral
€ €
Value of personal allowance or personal & PAYE tax credit to standard rate taxpayer
3,300 2,632
Threshold for 20% rate 16,500** 13,162
Threshold for 40% or 41% rate 32,800 57,794
Threshold for 45% rate not applicable 266,943
* Annual Values.
** At earnings below this level, the potential tax liability is eliminated (for employees) by the personal and PAYE tax credits.
the higher rate of tax becomes payable is, however, some 75 per cent higher than that for Ireland.
Figure 2 summarises the results regarding marginal effective tax rates as in Section 2. The Irish system here is 2013, and the UK-style system is also calibrated from 2013 values. But the contrast is very similar to that observed in Figure 1, with Irish marginal tax rates initially lower than those for the UK, but then rising to become substantially higher.
FIGURE 2 Marginal Effective Tax Rates (METRs) for Ireland under Actual 2013 Policy and under a UK-style Tax
and Social Insurance System
% of workers (y-axis) with METR below value shown on x-axis
Note: Estimated using SWITCH.
The distributional consequences of the Irish and UK approaches are illustrated in Figure 3. It should be recalled that in this comparison, each system is gathering approximately the same revenue. This is done by construction in our approach, but is also true in reality, as aggregate statistics in Table 2 have shown. The Irish tax system, compared with the UK-style system, gathers less revenue from low and middle income households, and also from what might be termed “upper middle” income groups – deciles 7 and 8. The top one-fifth of households pay more in tax under the Irish system than under the UK-style system. A move from the Irish to the UK-style system would see a rise of about 7 per cent in the
0 40
20 60 80 100
% o
f W
or
k
in
g A
du
lt
s
0 20 40 60 80 100
Marginal Effective Tax Rate (%)
Ireland 2013
[image:29.595.81.516.300.585.2]-6 -4 -2 0 2 4 6 8
Poorest 2 3 4 5 6 7 8 9 Richest
incomes of the top income decile- the 10 per cent of households with the highest disposable incomes, adjusted for family size and composition.
Taken together, the results in Figures 2 and 3 provide a clear illustration of the trade-off between efficiency considerations (low marginal tax rates) and equity considerations (a higher tax burden where there is greater ability to pay). Ireland and the UK have made quite different choices on these issues.15 Many other EU countries have chosen tax systems with an intermediate degree of progressivity. Similar analyses of other EU countries would be informative when exploring potential reforms for Ireland.
FIGURE 3 Distributional Impact of Moving to UK-style Income-Related Taxes, 2013
Note: Estimated using SWITCH.
6
C
ONCLUSIONSIreland is widely perceived as having a very low tax regime, not just for corporate profits but also more generally. Our analysis finds that this view is in need of some correction. The most commonly made international comparisons are based on the ratio of tax revenues to GDP. For most countries GDP is a good measure of taxable capacity, and close to GNP; the other major measure of national income. For Ireland, the role of redomiciled plcs, as shown by FitzGerald (2013), means that close to 5 per cent of GNP is not part of the tax base at all; and the outflow
15 The two countries have also made different choices in the expenditure sphere, e.g., the provision of a National Health
of repatriated profits from multinationals, which forms about one-fifth of GDP, is taxable in Ireland as in most other countries, at relatively low rates.16 When adjustments are made for these factors, the ratio of tax revenues to a better measure of taxable capacity is higher by 5 percentage points. On this basis, Ireland has a moderately low ratio of tax to taxable capacity, somewhat below the UK, but well above that of Spain, Greece and Portugal; the standard GDP-based figures suggest an Irish tax ratio which is the lowest in the EU by a considerable margin.
Much of the gap between the tax to national income ratio in Ireland and in countries such as Germany, the Netherlands, Austria, France and the Nordic countries is due to income-related taxes. An examination of the detailed structure of marginal tax rates across the working population finds that this is due to lower marginal tax rates at low and middle income levels. The structure of Ireland’s marginal effective tax rate is progressive compared with EU partners: low (or zero) marginal rates at the lower and middle income levels, and high rates towards the top. This necessarily limits the revenue generated by the income tax system, because the low marginal tax rates at low income levels apply also to the relevant “slice” of income of those with higher incomes. Thus, if Irish income taxes were to approach European levels, it is likely that marginal tax rates in low to middle income ranges would have to rise. Higher marginal tax rates on these income ranges would then raise extra revenue not just from those at such income levels, but also from those at higher income levels. Changes to top tax rates at very high income levels would have little impact on the gap in income-related taxes collected in Ireland and in most European countries.17
Ireland and the UK raise a similar proportion of national income in the form of income-related taxes.18 Detailed comparisons highlight the different choices made in the two countries as to how to raise this revenue. Ireland has lower marginal tax rates at low incomes, but a substantially higher proportion of the workforce facing the top rate of tax. The top tax rates faced by most UK workers are lower than in Ireland – and in most European countries. These differences have strong implications for the distribution of the tax burden, with the Irish system gathering less revenue from low and middle income earners, and more from those with high incomes. In exploring possibilities for future reform of the Irish tax system, there will be much to be learned from closer investigation of the
16 See Section 2 and IFAC (2012) for details on this latter point. 17 See Section 4 for details.
choices made in other European countries along the lines developed here for Ireland and the UK.
B
IBLIOGRAPHYAdam, S. and J. Browne, 2010. "Redistribution, Work Incentives and Thirty Years of UK Tax and Benefit Reform", Institute for Fiscal Studies Working Paper 10/24.
Adam, S., M. Brewer and A. Shephard, 2006. "Financial Work Incentives in Britain: Comparisons Over Time and Between Family Types", Institute for Fiscal Studies, Working Paper WP06/20.
Adam, S., C. Emmerson and B. Roantree, 2013. “Broad Shoulders and Tight Belts: Options for Taxing the Better-Off”, in C. Emmerson, P. Johnson and H. Miller (eds.), The IFS Green Budget, London: The Institute for Fiscal Studies.
Besley, T., 2012. “Making and Breaking Tax Systems: The Institutional Foundations of Fiscal Capacity”, Economic and Social Research Institute Geary Lecture, 19 October 2012.
Blundell, R., 2011. "Tax Policy Reform: The Role of Empirical Evidence", Journal of the European Economic Association Vol. 10, No. 1, pp 43–77.
Brewer, M., E. Saez and A. Shephard, 2010. "Means-testing and Tax Rates on Earnings" in Institute for Fiscal Studies (ed.), Dimensions of Tax Design, Oxford: Oxford University Press.
Callan, T, N. Crilly, C. Keane, J.R. Walsh and Á. Ní Shúilleabháin, 2011. "Tax, Welfare and Work Incentives", Budget Perspectives 2012, Dublin: Economic and Social Research Institute.
Callan, T., C. Keane, M. Savage, J.R. Walsh, 2012. “Analysis of Property Tax Options”, Dublin: Department of the Environment, Community and Local Government.
Callan, T. and M. Savage, 2013. "Tax and Taxable Capacity: Ireland in Comparative Perspective," Economic and Social Research Institute QEC Research Notes. Callan, T., J.R. Walsh and K. Coleman, 2007. Work Incentives, Poverty and Welfare
in Ireland, Policy Research Series No. 60, Dublin: Economic and Social Research Institute.
Central Statistics Office, 2011. Survey on Income and Living Conditions 2010, Dublin: Stationery Office.
Collins, M.L. and M. Walsh, 2010. “Ireland's Tax Expenditure System: International Comparisons and a Reform Agenda”, Studies in Public Policy No. 24, Dublin, Policy Institute, Trinity College Dublin, 2010, 1 – 64.
Conefrey, T. and J. FitzGerald, 2009. "The Macro-Economic Impact of Changing the Rate of Corporation Tax," Working Paper 273, Economic and Social Research Institute.
Department of Social Protection, 2012. Statistical Information on Social Welfare
Services, www.welfare.ie
Devereux, M. and R. Griffith, 2003. "Evaluating Tax Policy for Location Decisions," International Tax and Public Finance, Springer, Vol. 10, No. 2, pp. 107-26. Elschner, C. and W. Vanborren, 2009. Corporate Effective Tax Rates in an
Enlarged European Union, Taxation Papers 14, Directorate General Taxation and Customs Union, European Commission, revised April 2009.
Feldstein, M. 1995. Effect of Marginal Tax Rates on Taxable Income: A Panel Study of the 1986 Tax Reform Act, Journal of Political Economy, Vol. 103, No. 3, pp. 551-572.
FitzGerald, J., 2013. "The Effect of Re-domiciled Plcs on Irish Output Measures and the Balance of Payments" QEC Research Notes.
Fuest, C., J. Niehues and A. Peichl, 2010. The Redistributive Effects of Tax Benefit Systems in the Enlarged EU Public Finance Review 38 p. 473.
Honohan, P., 2009. Opening Address to the ESRI/Foundation for Fiscal Studies Budget Perspectives Conference, 13 October 2009. http://tinyurl.com/blxmtp7.
Irish Fiscal Advisory Council, 2012. Fiscal Assessment Report, September.
Immervoll, H., 2004. "Average and Marginal Effective Tax Rates Facing Workers in the EU: A Micro-Level Analysis of Levels, Distributions and Driving Factors", Paris, OECD Social, Employment and Migration Working Papers No. 19. Jara, X. and A. Tumino, 2013. “Tax Benefit Systems, Income Distribution and Work
Incentives in the European Union”, International Journal of Microsimulation, Vol. 6., No. 1, pp. 27-62.
Keane, C., T. Callan, M. Savage and J.R. Walsh, 2012. “Property Tax in Ireland: Key Choices”, Economic and Social Research Institute Economic Renewal Series 011.
Kopczuk, W. 2005. “Tax Bases, Tax Rates and the Elasticity of Reported Income”,
Journal of Public Economics, Vol. 89, Nos 11-12, pp. 2093-2119.
McCarthy, C., 2004. “Volatility in Irish Quarterly Macroeconomic Data”, Quarterly Economic Commentary, Dublin: Economic and Social Research Institute. McCarthy, C., 2010. “Fiscal Adjustment and Macroeconomic Re-balancing in
Ireland” Dublin: Journal of the Statistical and Social Inquiry Society of Ireland, Vol. XXXIX, pp.70-78.
OECD, 2011. OECD Economic Surveys: Ireland 2011 Paris: OECD Publishing. OECD, 2012. Benefits and Wages: OECD Indicators www.oecd.org/els/social/
workincentives
Piketty, T., E. Saez and S. Stantcheva 2011. “Optimal Taxation of Top Labor Incomes: A Tale of Three Elasticities”, NBER Working Paper No. 17616.
2. Housing Taxation and Support for
Housing Costs
Stuart Adam
11
I
NTRODUCTIONThe taxation of housing and support for housing costs are important policy issues. They are also live issues in both the UK and Ireland, with significant and controversial reforms recently proposed, implemented or due to be implemented in both countries. This paper considers how housing should be taxed and how support for low-income families with their housing costs should be provided. It draws heavily on work done by the author and others for Tax by Design, the final report of the Mirrlees Review of taxation.2 Like the Mirrlees Review, it uses the UK as a case study to apply principles that are intended to be relevant to any developed economy in the 21st century.
Taxation is not the only instrument of housing policy. The availability of housing in the UK is probably more influenced by the planning regime than by the tax regime. Social housing systems are a major part of the housing landscape in some countries. The regulation of credit can have a significant impact on the housing market. Policymakers sometimes try to make housing more affordable through policies such as mortgage guarantees and equity loans (such as the UK’s recently announced Help to Buy scheme), though with heavily restricted housing supply the main effect of policies that boost demand in this way is usually to bid up house prices rather than making them more affordable overall.
There is, therefore, a place for considering how housing taxation fits into the wider framework of housing policy.3 The focus here, however, is on how housing taxation fits into the wider framework of tax and benefit policy, looking across the taxation of wealth, income, consumption and transactions.
1 Address for correspondence: [email protected]. Thanks to Tim Callan, Carl Emmerson and Robert Joyce for comments on an earlier draft. Any errors or omissions are the responsibility of the author.
2 Mirrlees et al. (2011).
Tax by Design emphasises the importance of considering the tax system as a whole. The different parts of the system need to work together, with each tax used for the objective for which it is best suited: not every tax need address all objectives, as long as the system as a whole does. That is naturally difficult for a paper such as this one, examining just one part of the tax system – housing taxation – but at the very least it means analysing it in the light of how the rest of the tax system is designed. Core to this is the concept of neutrality: taxing similar activities similarly. In general, a system that treats similar economic activities in similar ways for tax purposes will tend to be simpler, avoid unjustifiable discrimination between people and economic activities, and help to minimise economic distortions and scope for tax avoidance. Neutrality is a sensible default option: it is not a good in itself, and is not always desirable. There are good arguments for levying higher taxes on environmentally damaging activities and providing tax advantages for research and development that brings wider spillover benefits. But given the tendency of arbitrary boundaries in the tax system to generate complexity and unintended effects on behaviour, the hurdle for departing from neutrality should be high.
How, then, should we think about housing’s place in the economy? Housing has two main attributes that are relevant for tax design:
• First, by living in a house, you consume a flow of services. If we have a consumption tax such as a VAT, a reasonable presumption is that housing should in some way be covered by it.
• Second, homeowners also own a valuable asset; indeed, it is usually their
most valuable asset. The value of the house may go up and down. In that sense, owner-occupied housing is like any other asset, and we should seek to tax it like other assets.
removed. As we will see, achieving such ideal treatment in practice would be difficult. But it is important to be clear what we would like to aim for.4
I take the first of these attributes – the consumption properties of housing – first. Section 3 then moves on to consider how housing should be taxed as an asset.
One of the problems with taxing housing – unlike most other consumption and income – is that it is not associated with a cash flow. Section 4 discusses the possibility of allowing housing taxes to be deferred for those who own a valuable home but may nevertheless struggle to find the cash to pay a housing tax as it arises each year.
In some cases, the problem is not current cash-flow but an underlying lack of resources. Governments may tax people who own or occupy a lot of housing, but they also provide help to those who need it with their housing costs – including, but not limited to, housing taxes themselves. Housing is a major component of the cost of living and it is essential that those with few or no private resources can still afford accommodation. But this support should also be designed to achieve clear objectives in as well targeted a way as possible, fitting in with principles that underlie low-income support more generally. Without taking a view on how generous support should be or how rapidly it should be removed as income rises, Section 5 of this paper examines some issues that are particularly pertinent in the design of housing benefits. Section 6 concludes.
2
T
AXINGH
OUSINGC
ONSUMPTIONThe UK and Ireland – like all developed countries except the USA – charge VAT on the consumption of goods and services. There should be a presumption to tax consumption of all goods and services equally, not least for reasons of simplicity. Housing is an extreme example of one particular type of good: it can be thought of as a large consumer durable, like a very big fridge or car. Durables deliver a stream of consumption: the benefit of using them. The purest way to levy a consumption tax on them would be to value the stream of services delivered in a particular period and tax it. In practice, when considering the taxation of most consumer durables, we start instead from the presumption that it would be
4 Some might argue that there are benefits to wider society (over and above any benefits to the individual concerned)
appropriate to impose VAT on their purchase price when new. This is because the price of the durable itself reflects the present value of the stream of services it is expected to yield. VAT paid on the newly bought good is, in effect, a prepayment on the stream of services yielded. Since the purchase price of new goods is observed, it is much easier to tax the purchase upfront than to try to value the stream of services each period. A natural starting point is that the same approach should be applied to housing.
BOX 1: Land Value Taxation
A property can be thought of as having two components: the building and the land on which it stands. The taxation of land and the taxation of buildings can, in principle, be separated.
There is a long tradition arguing in favour of land value taxation: that is, levying a tax on what the land would be worth without any building on it. Since land, unlike buildings, is in completely fixed supply (aside from a few minor complications such as land recovered from the sea) and the tax would be payable regardless of what (if anything) was built on it, a land value tax would not affect incentives to buy, use or develop land. Unlike with other taxes, economic activity that would be worthwhile without a land value taxation remains worthwhile with it. Meanwhile the state would share in the benefit of any rise in land values (e.g., through improvements in local amenities), which occur through no particular merit or effort on the part of the landowner.
Tax by Design proposed introducing a land value tax for non-residential property, subject to confirming the practical feasibility of valuing plots of land separately from the buildings on them. However, unlike in the case of business property (discussed in Chapter 16 of Tax by Design), with housing there is a strong case for taxing the buildings as well as the land. It is the building, not just the land, that provides consumption services, and the disincentive to development created by taxing housing is no different from the disincentive to producing other goods created by VAT. Of course, ideally we would like to avoid discouraging economic activity at all; but most taxes inevitably do so, and the argument for a tax on residential buildings is that there is no reason for the tax system to discourage housing development less than it discourages other forms of activity.
have such a tax. But there is a cost to doing this. If we want to tax the buildings as well as the land, there is obvious merit in avoiding the considerable additional complexity associated with valuing and taxing residential land and buildings separately.
In what follows, therefore, I discuss taxation of the land and buildings taken together. But if a land value tax could first be successfully implemented in the non-domestic sector (as proposed in Tax by Design), there may in future be a case for reconsidering its application to domestic property as well.
Yet the case for taxing the stream of services rather than the upfront purchase price is stronger in the case of housing than other durables. Relative to other consumer durables, the sheer value of housing and the potential scale of tax payments involved makes accepting the administrative burden of valuing the stream of services a more palatable option. But houses differ from other consumer durables not only in size. For one thing, they last a very long time – hundreds of years in many cases. Because houses are so long lived, their consumption value may change a great deal over time. Hence, their up-front price may prove to be a bad approximation to the value of consumption services they eventually provide. Ideally, if a house delivered more (less) valuable services than was originally envisaged and built into the purchase price, we would like to tax (subsidise) this difference. This is true in principle for all durables, but on a much larger scale for housing. So the economic benefits of taxing the stream of services are greater for housing than for other durables, while the practical costs are smaller relative to the amounts of tax involved.
Of course, it is not necessarily a binary choice between these two options: a government could opt for a combination, levying some VAT on new build and some tax on the stream of services, perhaps such that the combined rates equalled the main VAT rate – though this would of course involve two sets of administration.
been subject to full VAT in the past then moving to a system of levying VAT only for future new build would give windfall gains to current homeowners at the expense of non-owners.5
The UK is starting from an unusual position: alone among OECD countries, it applies a zero rate of VAT to the construction and sale of residential property.6,7 It also has a large existing tax, council tax, levied annually and loosely related to property value. For the UK, therefore, it makes much more sense to leave new build zero-rated and instead transform council tax into a tax that more closely reflects the consumption value of the property. I now illustrate what this would involve.
2.1 Council Tax in Britain
Council tax is charged to all occupiers of domestic property in Britain.8 In England and Scotland, council tax operates by placing every house into one of eight bands (A to H): the higher the band, the higher the council tax paid – though not in a proportional fashion, as Table 1 shows. The valuation bands are based on the estimated market value of each house on 1 April 1991: there has been no revaluation of properties at all in England or Scotland since the tax was introduced.9 The ratios between the council tax bills charged for each band are set centrally, but the overall level of council tax is set locally (although local authorities must now seek approval in a referendum if they propose increases deemed excessive by central government) and the revenue from the tax is locally retained.
A 25 per cent discount is applied where there is a sole occupant; second and empty homes are also subject to discounts, determined locally. There are also reductions for those with low current incomes and assets, which are discussed in
5 An alternative, proposed by Crawford, Keen and Smith (2010), would be to levy VAT both on new build and on
existing properties the next time they are sold – taxing the stream of consumption services they are expected to yield thereafter without retrospectively taxing the consumption services enjoyed to date. But this would act to discourage mutually beneficial transactions as people sought to defer the tax – since only housing services consumed after the next transaction would be taxed, the tax would be minimised by delaying a transaction as long as possible – and has the potential to be avoided altogether by the simple expedient of waiting for a future government to repeal the tax, before entering into any transaction.
6 Since VAT in the UK is generally charged on refurbishing existing pr