SOME IMPORTANT CHANGES IN THE STRUCTURE OF IRISH SOCIETY. A REVIEW OF PAST
DEVELOPMENTS AND A PERSPECTIVE ON THE FUTURE
J.J.Sexton
February 2001
CONTENTS
Introductory Note..……….3
I. Output and Employment Growth..………4
Past Performance………..………...4
Medium-Term Outlook………,,………..4
II. Population Trends………..………6
Past Trends………..……….…6
Outlook………..………...6
III. Structural Changes in Irish Society……….8
The Economy………...…...8
Sectors………..…....8
Occupations……….…10
Population……….…..12
Ageing……….….12
Dependency……….14.
INTRODUCTORY NOTE
I. OUTPUT AND EMPLOYMENT GROWTH Past Performance
It is appropriate to begin this paper by briefly reviewing the trend of output and employment in the Irish economy during recent decades.
Output growth was very low in Ireland during the 1980s, the rate of increase in GNP averaging only just over 2 per cent annually when measured in real terms (see Table 1). The global downturn which began in the early part of this decade hit Ireland particularly hard, not only in its intensity, but also in terms of its duration. The Irish economy languished in recession until well into the second half of the 1980s, long after other Western economies had recovered and had begun to achieve some employment expansion.1 This created a sharp divergence in labour market conditions between Ireland and other countries, particularly the United Kingdom, which led to a resumption of emigration on a significant scale. Even though the economy began to improve and employment rose towards the end of the decade, Table 2 shows that the level of employment in 1990 was still somewhat lower than that which prevailed in 1980.
By this time, however, at the end of the 1980s, a range of developments had occurred which had the potential to transform the economy. Foremost among these were significant steps to correct the national finances and a series of moderate national wage agreements. The former had the effect of boosting confidence in the economy, while the latter enhanced competitiveness and improved industrial relations. The international environment also began to improve, the fall in interest rates being especially beneficial. While real GNP growth remained sluggish during the global recession in the early years of the 1990s, there was some modest employment expansion. The total number of persons at work increased by about 0.5 per cent per year on average between 1990 and 1993, or by some 6,000 per annum when viewed in absolute terms – a reasonably creditable performance in the context which then prevailed.
The period between 1993 and 2000 has been unprecedented in terms of both output and jobs growth. National output increased by almost 8 per cent each year on average while employment growth was nearly 5 per cent. When viewed in absolute terms, the latter represents a net annual rise of over 60,000, a level of job creation never previously achieved. This is equivalent to nearly 440,000 over the full seven-year period, most of which related to full-time employment.
Medium-Term Outlook
The outlook for the period up to 2005 envisages a moderation in both output and employment growth rates. However, when viewed historically, these will still be substantial. Annual average GNP growth is expected to be about 5 per cent between 2000 and 2005. This should in turn lead to an expansion of just over 2 per cent each year in total employment, which is equivalent to just under 35,000 (net) on an annual average basis. The unemployment rate, which is currently as low as 3.6 per cent, is predicted to fall somewhat further, and is now approaching the point where it will be largely frictional in nature.
1 The reason for the extended duration of recession in Ireland at this time can be mainly attributed to domestic
Table 1. Output and Employment Growth, 1980-2005
Period Real GNP Employment
(Annual Average Rates of % Change)
1980-1990 2.1 - (-)
1990-1993 2.0 0.5 (6,000)
1993-2000 7.9 4.7 (62,000)
2000-2005 5.1 2.0 (34,000)
Sources: (a) CSO National Accounts Publications
(b) Dept. of Finance Research Paper 1/90 (1990). Long –Run National Accounts Data. (b) Annual series of Labour Force Surveys
(c) ESRI Medium Term Review, 1999-2005.
Note. The employment data are defined according to “principal economic status” (PES) concepts. The CSO has now (since 1998) changed the employment concepts used in publishing labour market data to accord with International Labour Office (ILO) definitions. The previous concept is used her as it enables one to show retrospective estimates. Furthermore existing employment forecasts are compiled in this way.
Table 2. Total Employment, 1980-2005
Year Employment (000)
1980 1156
1990 1134
1993 1152
2000 1588
2005 1757
Sources (a) CSO Annual Series of Labour Force Surveys (b) ESRI Medium Term Review, 1999-2005.
The anticipated reduction in the growth rate in the economy is generally excepted as being necessary in order to consolidate recent gains, and to allow scope to upgrade and extend the economic and physical infrastructure.
II. POPULATION TRENDS
Past Trends
Turning to a consideration of population trends, Table 3 shows that population growth was noticeably sluggish during the 1980s. The total rose moderately from 3,443,000 in 1981 to 3,541,000 in 1986. During the following five years the total population actually fell slightly. The 1991 Census recorded a population total of 3,526,000, some 15,000 less than the figure recorded at the preceding census in 1986. This was due principally to the large migratory outflows (see Table 4) which followed the prolonged period of recession in the 1980s, which more than offset the natural increase in the population.
The population resumed its upward path after 1991 according as the net migratory outflow diminished. By 1996 the total had reached 3,541,000. Since the-mid 1990s the booming economy has given rise to an increased migratory inflow as former emigrants returned and (increasingly) non-nationals began to enter the country to avail of the expanding employment opportunities. Net immigration has been estimated at over 76,000 between 1996 and 2000, which has contributed to more rapid population growth. Table 4 shows that the estimated gross inflow during the same period was as high as 178,000, which was offset by an outflow of nearly 102,000.2 As a result of the changes as described, the population is estimated to have reached 3,787,000 in April 2000, more than 160,000 higher than the 1996 total of 3,626,000.
Outlook
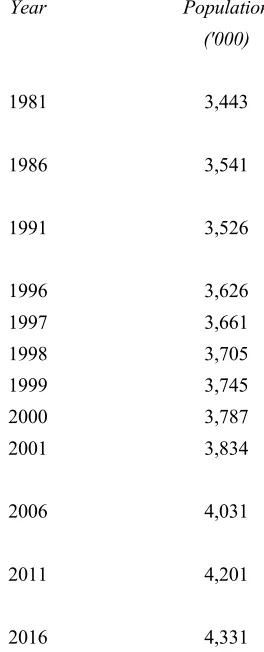
Looking ahead, the picture that emerges is one involving a continuation of moderate population growth. Current CSO projections indicate that the total Irish population will increase from its current level of about 3,800,000 to about 4,030,000 by 2006; thereafter it is projected to rise to just over 4,200,000 by 2011 and to 4,330,000 by 2016. The assumptions on which these forecasts are based involve a continuation of significant net immigration (even if declining) over the projection period indicated, as well as decreasing fertility up to 2011. 3
2 It is interesting to note, therefore that emigration continued at a significantly high level even during the recent
boom years, indicating how fluid and volatile the external flows are.
3 Central Statistics Office (1999). Population and Labour Force Projections 2001 to 2031. Dublin. The
Table 3. Population of Ireland, 1981-2016
Year Population
('000)
1981 3,443
1986 3,541
1991 3,526
1996 3,626
1997 3,661
1998 3,705
1999 3,745
2000 3,787
2001 3,834
2006 4,031
2011 4,201
2016 4,331
Sources: (a) CSO (1997). Census of Population 1996, Vol I. Population Classified by Area.
(b) CSO (2000). Population and Migration Estimates, April 2000.
(c)CSO (1999). Population and Labour Force Projections 2001 to 2031.
Table 4. Gross and Net Migration Flows, 1987-2000.
Year Outward Inward Net
(ending April)
(000)
1987 40.2 17.2 -23.0
1988 61.1 19.2 -41.9
1989 70.6 26.7 -43.9
1990 56.3 33.3 -22.9
1991 35.3 33.3 -2.0
1992 33.4 40.7 +7.4
1993 35.1 34.7 -0.4
1994 34.8 30.1 -4.7
1995 33.1 31.2 -1.9
1996 31.2 39.2 +8.0
1997 29.0 44.0 +15.0
1998 21.2 44.0 +22.8
1999 29.0 47.5 +18.5
[image:7.595.192.404.521.720.2]III. STRUCTURAL CHANGES IN IRISH SOCIETY
While the global economic and social trend indicators are revealing, the picture becomes even more interesting when the different socio-economic changes are considered from a structural viewpoint.
The Economy
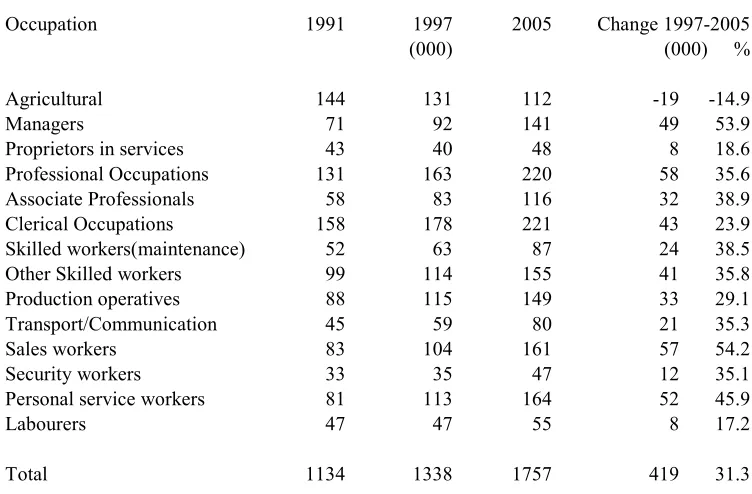
Turning first to the likely changes in the structure of the economy, these are illustrated in terms of employment for the medium term context under two headings – Sectors and Occupations. In this regard Table 5 shows a broad classification by sector or industry for those at work in the Irish economy in selected years over the period from 1990 to 2005. Table 6 shows a similar classification for occupations.
Sectors
Looking first at the retrospective sectoral data, the figures show that most of the jobs growth in the 1990s occurred in market services. In the boom period between 1995 and 2000 the numbers at work in this sub sector rose by more than 180,000, accounting for more than one half of the total employment expansion over this time span. Employment in non-market (mainly public) services rose by 62,000, most of this relating to health and education activities. The numbers employed in building and construction increased by more than 80,000, which represents a doubling of total employment in this sector over the five year period in question. Employment in the industrial sphere rose more moderately by 38,000, all of this increase being attributable to the “hi-tech” area covering the manufacture of computer products, engineering, instrumentation and chemicals. Employment in the more traditional sphere of manufacturing relating to clothing, textiles, food etc. declined slightly between 1995 and 2000.
The outlook for the period up to 2005, as envisaged in the ESRI Medium Term Review, is somewhat different than that just described. While the total numbers in employment are expected to continue to rise, by about 34,000 per year on average, this represents a significantly reduced rate when compared with the performance of recent years. Job gains in manufacturing are expected to be much less, not only because of a deceleration in the rate of expansion in the hi-tech sector, but also due to reductions in employment in more traditional areas. The reasons underlying this trend relate, in the main, to a somewhat less favourable international environment, and some reduction in competitiveness as costs rise according as more of the proceeds of economic growth are taken in the form of earnings rather than employment expansion. The numbers at work in building and construction are expected to rise much more slowly (by about 8,000 in the five-year span in question) according as the level of employment in the sector reaches the point where it is sufficient to meet the ongoing level of demand. It should be noted that an outcome of this kind is in contrast to earlier periods, when boom conditions were often followed by falling output and sharp decreases in employment.
Table 5. Numbers at Work by Sector, 1990-2005
Year Change
Sector
1990 1995 2000 2005
1995-2000
2000 – 2005
(000) (000)
Agriculture 169 143 122 106 -21 -16
Manufacturing 245 267 305 316 38 11
Hi-Tech 93 105 146 165 41 19
Other Manufacturing 152 162 159 151 -3 -8
Building & Construction 76 83 164 172 81 8
Market Services 416 486 667 793 181 126
Distribution 172 186 233 277 47 44
Other Services 244 300 434 516 134 82
Non-Market Services 228 268 330 370 62 40
Public Admin & Defence 65 73 81 89 8 8
Health & Education 163 195 249 281 54 32
Total 1134 1247 1588 1757 341 169
Sources. (I) Labour Force Surveys, 1990 and 1997.
(ii) Quarterly National Household Survey (QNHS) 2000, Second Quarter
[image:9.595.71.447.494.741.2](iii) The sectoral employment forecasts for 2005 are based on the estimates contained in the most recent ESRI Medium-Term Review, published in October 1999. These figures have been revised to take account of the trends indicated by more recent labour force data.
Table 6. Employment by Occupation, 1991-2005
Occupation 1991 1997 2005 Change 1997-2005
(000) (000) %
Agricultural 144 131 112 -19 -14.9
Managers 71 92 141 49 53.9
Proprietors in services 43 40 48 8 18.6
Professional Occupations 131 163 220 58 35.6
Associate Professionals 58 83 116 32 38.9
Clerical Occupations 158 178 221 43 23.9
Skilled workers(maintenance) 52 63 87 24 38.5
Other Skilled workers 99 114 155 41 35.8
Production operatives 88 115 149 33 29.1
Transport/Communication 45 59 80 21 35.3
Sales workers 83 104 161 57 54.2
Security workers 33 35 47 12 35.1
Personal service workers 81 113 164 52 45.9
communications as well as professional, business and personal services. A smaller, but still significant increase of some 38,000 (13 per cent) is forecast for the broad public service area, in line with the assumption that as significant growth is maintained, State services should be moderately enhanced in terms of both volume and quality.
These figures, therefore, signal a significant shift towards services employment in the Irish economy, a feature which has been a characteristic of other economies at broadly similar stages of development.4
Occupations
It is of further interest to consider the occupational implications of the sectoral employment estimates. In this regard much work has been done by the ESRI in recent years as part of the joint FÁS/ESRI Manpower Forecasting Studies Project. The results given in Table 6, which give an occupational sub-division of employment for 1991 and 1997, along with forecasts for 2005, are based on occupational forecasts contained in the most recent report in this series.5
These forecasts, which for most occupations involve estimates that are numerically greater than those originally published, have been revised to take account of more recent trends in the Irish labour market. However the revisions are somewhat rudimentary and simply involve a pro rata increase for employment in each occupation, calculated on the basis of the overall (upward) change in the total employment level as forecast for 2005. Current work, the results of which will be published soon, is being undertaken in order to refine these adjustments to reflect differential rates of employment expansion for different industries.
The largest percentage increases are predicted to occur in the case of sales workers and managers in which the numbers employed are anticipated to rise by nearly 55 per cent over the forecast period. The next most rapid growth rate relates to persons engaged in personal services (more than 45%) followed by associate professionals and skilled maintenance workers for which the projected increase is nearly 40 per cent in each case. These are followed by a somewhat mixed group consisting of transport and communications workers, other skilled manual workers, professionals and those engaged in security – all predicted to increase in number by somewhat more than one third between 1997 and 2005. Semi-skilled production operatives are forecast to increase in number by just under 30 per cent and clerical workers by a somewhat smaller percentage. The smallest increases in the period 2000-2005 are indicated for proprietors in services and unskilled labourers, both of the order of 18 per cent. These changes are set out in graphical form in Figure 1.
Clearly a somewhat different perspective emerges if the forecast employment changes are viewed in absolute or numerical terms, as shown in Figure 2. This shows that the largest absolute increases will relate to professional workers and those in sales, both with projected gains of nearly 60,000 over the 1997-2005 period. These are followed by personal service
4 A more detailed description of the assumptions underlying these sectoral forecasts is given in Section 5.4 of
Chapter Five of the 1999 ESRI Medium Term Review publication.
5 Hughes, McCormack, Sexton (2000). Occupational Employment Forecasts 2005. FÁS/ESRI Manpower
Figure 1. Changes in Occupational Employment Employment (%), 1997-2005
-20.0 -10.0 0.0 10.0 20.0 30.0 40.0 50.0 60.0
Agricultural Labourers Proprietors in services Clerical Occupations Production operatives Total Security workers Transport etc Professionals Other Skilled workers Skilled workers(maint) Assoc Professionals Personal service workers Managers Sales workers
[image:11.595.43.562.54.792.2]%
Figure 2. Changes in Occupational Employment (000), 1997-2005.
workers and managers, for which the net rise in employment is expected to be about 50,000 in each case.
It of interest to note that if one considers the wider high skill group comprising professionals at both degree and diploma level (i.e. including associate professionals) and managers, the forecast net jobs requirement in the period up to 2005 is substantial, about 140,000. Generally speaking, however, taking into account the projected increases in other less skilled activities, the broader picture suggests a continuing need for labour across the full skill spectrum in the medium-term.
Population
Let us now consider the changing population structure, which is illustrated in terms of age classifications given in Table 7.
Ageing
The major changes which are revealed here relate to the following:
• The child population aged less than 15 years in falling, but is expected to rise again after the year 2006. It is currently estimated at 830,000 and is expected to reach about 875,000 in 2016. The indications are, however, that the population in this age band will begin to fall again after that date.
• Perhaps the most notable feature, however, relates to the youth population aged between 15 and 24 years. This is currently reaching a peak, will decline from just under 655,000 in 2001 to less than 540,000 in 2016, a reduction of 115,000, or nearly 18 per cent. Thereafter the numbers in this age category will increase somewhat, but only moderately.
• While the numbers in the 25 to 44 year age band will undergo some increase, substantial expansion is anticipated in all of the older age categories. In particular, the numbers aged between 55 and 64 years will increase by nearly 50 per cent from some 336,000 in 2001 to almost 500,000 in 2016.
• The older population aged 65 years or over (428,000 in 2001) is projected to show only a moderate rise in the period up to 2006. However, after 2011 the numbers in this age category will begin to escalate, reaching 585,000 in 2016 and nearly 770,000 in 2026.
Table 7. Population Projections 1996-2026
Year 0-14 15-24 25-44 45-54 55-59 60-64 65+ Total
(000)
1996 859 633 1016 412 154 138 414 3626
2001 828 654 1116 471 186 150 428 3834
2006 845 599 1222 509 225 181 452 4031
2011 878 538 1278 542 243 219 504 4201
2016 874 539 1269 566 261 237 585 4331
2021 841 570 1199 620 275 255 673 4434
2026 796 578 1127 685 287 270 767 4510
Sources (a) Census of Population, 1996.
(b) Central Statistics Office (1999). Population and Labour Force Projections, 2001-2031.
Note. (1). These projections are based on the “M1F2” assumptions as set out in the CSO report as referenced. These involve a continuation of significant net immigration (even if declining) over the entire projection period, and decreasing fertility up to 2011.
Table 8. Population Dependency Ratios, 1996-2026
Year Total
Dependency DependencyOld Age Pop(55-64)/Pop(15-64)
%
1996 54.1 17.6 12.4
2001 48.7 16.6 13.0
2006 47.4 16.5 14.9
2011 49.0 17.9 16.4
2016 50.8 20.4 17.3
2021 51.8 23.0 18.2
2026 53.0 26.0 18.9
(1). Total Dependency = Sum of the population aged less than 15 years and 65 years or over divided the population aged 15 to 64 years.
[image:13.595.76.413.412.566.2]Dependency
These changes have implications for the pattern of “dependency” in the Irish population. In this regard Table 8 shows population dependency ratios distinguishing “total dependency” and “old age” dependency. The former entity (total dependency) represents the sum of the population aged less than 15 years and 65 years or over taken as a ratio of the “active population” aged between 15 and 64 years. On the other hand “old age dependency” is based on a calculation in which the population aged 65 years or over only is divided by the “active” population. The table shows that total dependency will remain static, or even fall slightly, throughout the rest of this decade due to the offsetting effects of a fall in the youth population and increasing numbers of older people. The relevant ratio, which is currently estimated at 48.7, will be at much the same level in 2011, having fallen slightly in the intervening period. It is anticipated to show only slight increases for some considerable time thereafter.
The old age dependency ratio now which is currently is about 16.5 is forecast to show only a moderate increase throughout this decade, rising to just under 18 by 2011. Thereafter, however, it will begin to increase more rapidly reaching 20.4 in 2016 and 23 in 2021.
IV. POLICY IMPLICATIONS
There are some important policy implications set to emerge as a result of the changing socio-economic pattern in Irish society.
One of the most significant developments concerns the impact of falling youth population numbers, i.e., those aged 15 to 24 years. This will impact significantly on the education sector over the next fifteen years, especially at the upper cycle of second level and, more acutely, in higher education. The impact of these population trends has already been felt at primary level and a degree of stabilisation has been reached. In these circumstances, it is not proposed to comment on this aspect.
The extent of the forecast decline in population numbers is such that it is only realistic to expect some scaling down of resources in education - but not necessarily to the same relative degree as the population fall in the age groups in question. In the first place the sectoral and occupational forecasts have indicated that, even with moderating employment growth, there will be a continuing need for a sizeable inflow of highly qualified workers into the labour market. In this regard it should be noted that the forecasts shown relate to net
increases. The gross inflow requirements would be greater – a feature which the ESRI, as part of its work under the joint FAS/ESRI Manpower Forecasting Project, is currently carrying out research.
Reference has also been made to the desirability of catering for a greater number of mature students at third level. While this in itself may be a commendable objective, it would be significantly more acceptable, and command wider support, if it were pursued in a manner which involved a distinct social aim to extend participation in Higher Education to those previously by-passed, 6 and not seen merely as a device designed to boost student numbers.
One cannot, of course, look at one sector in isolation in the context of such a wide consideration of national resource allocation. The measures of dependency presented earlier, crude as they are, signal a need for a realignment of available resources. The ageing of the population, even though it is gradual and will not begin to have a significant impact until late in this decade, will require increasing expenditure on health supports, an area which is already beset with acute supply problems. At a later stage (i.e., after 2015) pension related expenditures will begin to rise rapidly, alongside growing outlays on health and other needs associated with a more elderly population. It should be noted, however, that the old age component of the dependency measures referred to (which are the standard ones normally used) relate only to those aged 65 years and over. There is, as of now, a substantial degree of ageing occurring in the population below this threshold, which has more immediate implications for health related expenditure. This trend can be see from the final column of Table 8.
It is also worth noting that the changes in the population structure are likely to lead to a realignment of political or electoral influence. The very fact that there will be significantly greater numbers of older people will lead to increasing pressures for expanded expenditures on health and other age related needs - a feature to which governments and the political community generally are likely to respond, as has happened in other countries.