GROWING UP IN IRELAND
KEY FINDINGS: INFANT COHORT
AT 7/8 YEARS
NO. 1
SCHOOL AND LEARNING
INTRODUCTION
This is the first in a series of Key Findings from the fourth wave of data collection from the Infant Cohort in Growing Up in Ireland.
The families of just over 11,100 infants were first interviewed between September 2008 and March 2009, when the child at the centre of the study was 9 months old. They were re-interviewed when the child was 3 years old and again at 5 years of age. In 2016, a fourth wave of data was collected from the child’s primary caregiver (mainly their mother1) through a postal survey
when the child was 7/8 years old.
This Key Finding focuses on mothers’ reports of how their children were doing in terms of their schooling and learning. Children’s early experiences of the classroom, their transition to formal school and their acquisition of key skills such as literacy and numeracy typically have a lasting effect on their short- and long-term educational development.
At the time of the postal survey 36% of the children in the study were 7 years old and the rest were 8 years old. At this stage, most of them had been in Primary School for 2-3 years. Overall, 69% started school in 2012 (mostly in September), the remainder in 2013. Just over 1% of the children were in Junior or Senior Infants, 32% were in First Class and 66% in Second Class. Just less than 1% were in third class, home-schooled or at a special school.
1 As almost all Primary Caregivers were the child’s mother they will be referred to collectively as ‘mothers’ in this Key Finding.
SETTLING IN TO SCHOOL
THE MAJORITY OF CHILDREN WERE REPORTED TO HAVE ADJUSTED EASILY TO SCHOOL, BUT
SOME DIFFICULTIES WERE IDENTIFIED
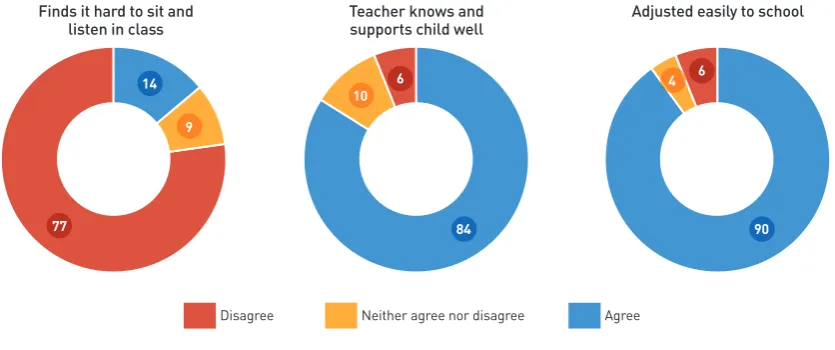
[image:2.595.79.497.214.389.2]As children who adjust better to school tend to make better progress in learning, mothers were asked how well their child had settled into school. The results are presented in Figure 1.
Figure 1: Percentage of mothers agreeing and disagreeing with three statements on how their child settled in to school.
Most children were reported to have adjusted well to school. Over three-quarters (77%) of mothers said their 7/8-year-old did not find it difficult to sit still and listen in class, although 14% did report they found it difficult. 84% of mothers reported that their child’s teacher knew their child well and provided the support they needed. 90% of mothers reported that that their child had adjusted easily to school.
IN GENERAL, GIRLS ADJUSTED TO SCHOOL BETTER THAN BOYS
Figure 2 shows that a higher percentage of boys than girls were reported to find it difficult to sit still and listen
in class (19% compared to 8% of girls). Small differences between boys and girls were found in terms of how
[image:2.595.44.432.576.757.2]well the teacher knows the child and gives them the support they need (82% of boys compared to 86% of girls) and their general ease of adjusting to school (87% of boys compared to 92% of girls).
Figure 2: Mothers’ agreement with how well their sons and daughters had adjusted to school by 7/8 years 14
9
77 84
10 6
90 4 6
Finds it hard to sit and
listen in class Teacher knows andsupports child well Adjusted easily to school
Disagree Neither agree nor disagree Agree
Finds it hard to sit and listen in class
Teacher knows and supports child well
Adjusted easily to school
Disagree Neither agree nor disagree Agree 0
20 40 60 80 100
Girls Boys
Girls Boys
Girls Boys
% of 7/8-year-old
s
19
8
82 86 87 92
12
7
12 8 6 3
69
85
LIKING AND GETTING ON AT SCHOOL
ABOUT THREE QUARTERS OF ALL CHILDREN FELT POSITIVELY ABOUT SCHOOL
[image:3.595.24.555.199.424.2]Positive feelings among children towards their school are important for fostering good peer relationships, integration and academic performance. Mothers were asked how their child felt about school. Figure 3 shows that most mothers thought their child was generally positive about school.
Figure 3: Attitudes of 7/8-year-olds to school as reported by their mothers
Figure 4, however, shows that although the majority of mothers reported their children were positive about school, there were differences by mother’s level of education. Mothers with higher levels of education were less likely to say that their child was frequently reluctant to go to school or complained about it than mothers with lower levels of education. Only 8% of mothers with degree-level education said their child complained about going to school more than once a week compared to 17% of mothers who had Junior Cert level education (or less).
Figure 4: 7/8 year olds’ attitudes to school (expressed more than once a week), reported by mothers with the lowest and highest levels of education
When these children were 5 years of age, their teacher had been asked to provide information on the child’s disposition and attitudes towards school and learning2. The children whose teachers had described them as
having the most negative disposition at 5 years of age3 were more likely to be reported by mothers as negative
about school when they were they were 7/8 years old. Figure 5 shows that children with the most negative disposition as reported by their teachers at age 5 were more likely to complain about or to be reluctant to go to school more than once a week than other children, and tended to be less positive about it, when they were older – according to their mothers.
2 A 10-item teacher-reported sub-scale on children’s dispositions and attitudes to school and learning (known as the Early Years Foundation Stage Profile) was used. This included questions about whether children showed an interest in classroom activities, displayed involvement, were motivated and excited to learn and maintained attention and concentration
3 Based on the lowest decile - 10% - in the teacher scale mentioned above.
Not at all Once a week or less More than once a week
Positive f
eelings
Negativ
e
feelings
Said good things about school
Looked forward to school
Complained about school
Reluctant to go to school
0% 10% 20% 30% 40% 50% 60% 70% 80% 90% 100%
80 63
6 4
16 27
20 24
4 10 74
72
0 10 20 30 40 50 60 70 80 90
Negative feelings Positive feelings
% of 7/8 year-olds
Said good things about school Looked forward
to school Complained about
school Reluctant to go
to school
Degree Junior Cert
7
17
67
62
4 8
77 75
Most children
were positive
about school
‘more than once
a week’.
Boys complained about school more often
than girls: 43% compared to 31%.
Boys were more likely than girls to be
[image:3.595.41.439.534.703.2]Figure 5: Differences in mother’s reports of attitudes to school among 7/8 year-olds (expressed ‘more than once a week’), according to whether or not their teacher at 5 years had rated them as having a more negative disposition towards school
PACE OF LEARNING AND COPING WITH SCHOOLWORK
MOST MOTHERS FELT THE PACE OF LEARNING AT SCHOOL WAS JUST RIGHT FOR THEIR CHILD
While 86% of mothers felt that the pace of learning at school was just right for their 7/8-year-old, 5% said it was
too fast and 9% that it was too slow. Mothers who had degree-level education were less likely to say it was too fast (3%) compared to mothers with lower levels of education (6%), as shown in Figure 6.
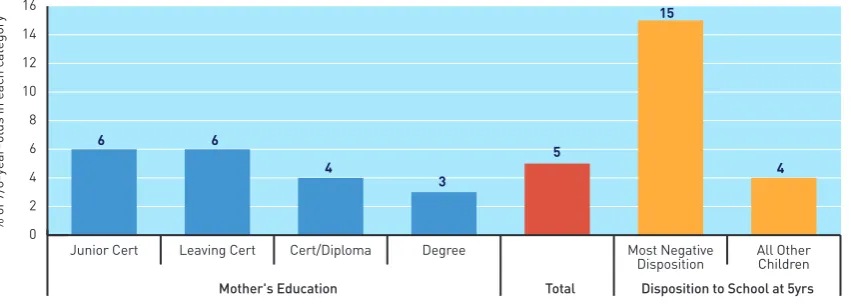
[image:4.595.42.468.507.661.2]Figure 6 also compares mothers’ views on the pace of learning at 7/8 years according to teachers’ ratings of the child’s disposition towards school at the age of 5 years. Children whose teachers said they were more negatively disposed towards school at 5 years were almost four times more likely to be described (by their mother) as less able than other children to keep up with the pace of learning (15% compared to 4% - Figure 6).
Figure 6: Children reported by mothers as finding the pace of learning too fast, classified according to mothers’ level of education (left) and teacher reports of child’s disposition to school at 5 years (right)
Over half of mothers (52%) said their child never found school-work hard while just 3% usually found it hard. The remaining 45% sometimes found it hard. Figure 7 shows that mothers who had third-level education were less likely to say their child usually found schoolwork hard (2%), compared to mothers who had left school at Junior Cert level or earlier (5%). Children whose teachers said they had the most negative disposition to school at 5 years were almost six times more likely than other children to usually find schoolwork hard at 7/8 years (11% compared to 2% - Figure 7).
Negative disposition Positive disposition
Said good things about school Looked forward
to school Complained about
school Reluctant to go
to school
Most negative disposition at 5 years All other children at 5 years 0 10 20 30 40 50 60 70 80
% of 7/8-year-olds
ex pr es sed mo re than onc
e a week per attitude gr
oup 8 15 65 60 3 9 76 74
Mother's Education Total Disposition to School at 5yrs
% of 7/8-year-olds in each
Figure 7: Children reported by mothers as usually finding their schoolwork hard, according to mothers’ education level (left) and teacher reports of the child’s disposition to school at 5 years of age (right)
[image:5.595.70.483.395.549.2]Mothers were asked how their child was doing in Reading, Writing and Maths. Figure 8 shows that only a minority of mothers felt their child was below average in these subjects. A majority of mothers described their child as above average for reading and maths, at 62% and 59%, respectively. Somewhat fewer mothers gave their child the above average rating for writing however (47%).
Figure 8: Mothers’ ratings of the child’s ability in the areas of reading, writing and maths
Mothers were more likely to rate girls as being above average at reading (65% for girls, 60% for boys) and writing (54% for girls, 41% for boys). In contrast, they were more likely to rate boys as being
above average in maths (63% for boys compared to 55% for girls).
Children who were felt by their teacher to have the most negative disposition towards school two years previously were much less likely to be rated as above average by their mothers when they were 7/8 years old (Figure 9). The early identification of children who have less positive dispositions and attitudes towards school can clearly help to target those who need greater support from an early stage.
Mother's Education Total Disposition to School at 5yrs
% of 7/8-year-olds in each
ca
tegory
All Other Children Most Negative
Disposition Degree
Cert/Diploma Leaving Cert
Junior Cert 0
2 4 6 8 10 12
5
4
2 2
3
11
2
Reading Writing Maths
Below average Average
Above Average
30
62 8
47 9
44 59
6
Figure 9: Percentage of mothers rating their 7/8-year-old as ‘above average’ in Reading, Writing and Maths, according to whether or not the the teacher rated their disposition to school in the lowest decile at age 5 years
LEARNING ACTIVITIES
MOST MOTHERS DID A VARIETY OF LEARNING ACTIVITIES WITH 7/8-YEAR-OLDS IN THE HOME
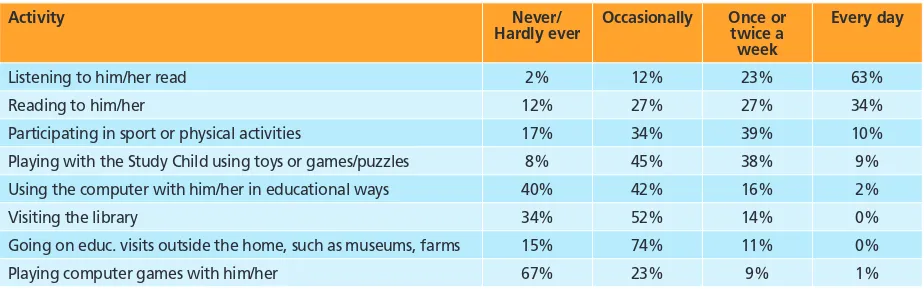
[image:6.595.41.368.128.283.2]The educational activities which parents undertake with their children at home are very important for supporting and encouraging the child’s learning in school. Mothers were asked how often they did any of eight different types of activities which are supportive of the child’s educational development to varying degrees. Table 1 shows how frequently each activity was carried out with the 7/8-year-old.
Table 1: Frequency of educational activities with the 7/8-year-old as reported by mothers
Activity Never/
Hardly ever Occasionally Once or twice a week
Every day
Listening to him/her read 2% 12% 23% 63%
Reading to him/her 12% 27% 27% 34%
Participating in sport or physical activities 17% 34% 39% 10% Playing with the Study Child using toys or games/puzzles 8% 45% 38% 9% Using the computer with him/her in educational ways 40% 42% 16% 2%
Visiting the library 34% 52% 14% 0%
Going on educ. visits outside the home, such as museums, farms 15% 74% 11% 0% Playing computer games with him/her 67% 23% 9% 1%
Other children Most negative disposition at 5 years
0 10 20 30 40 50 60 70
Maths Writing
Reading
% of 7/8-year-olds rated as 'above average'
in each disposition gr
oup
37
27
34 65
51
62
A poor
disposition
rating
from a teacher at age 5
years was linked to a
lower parental rating of
achievement
by the time the
child was 7/8 years old.
Activities involving reading were the most
frequent parent-child learning activity: 34%
read to the child and 63% listened to him/her
read
every day.
Computer-based activities were the least
frequent activity: 67%
never/hardly
ever
played computer games with their
7/8-year-old and 40%
never/hardly
ever
used the
[image:6.595.67.529.443.588.2]In general, there were few significant differences in the frequency of home learning activities among mothers with different levels of education, except in three areas: ‘playing computer games’, ‘reading to the child’, and ‘participating in sport or physical activities’ (Figure 10). There were few significant differences observed between boys and girls.
Figure 10: Percentage of mothers participating in selected parent-child activities 1-2 times per week or more often: a comparison of mothers with Junior Cert or degree level education.
Degree Junior Cert
Participating in sport or physical activities Reading to child
Playing computer games
% mothers doing activity at l
eas
t
onc
e a week
0 10 20 30 40 50 60 70 80
15
53
42
7
67
54
DISCUSSION POINTS
• In general, 7/8-year-olds appeared to be settling into school well, with most described by their mothers as being able to sit and listen in class, having teachers who support their needs and doing well in reading and maths.
• Overall, in common with other Western countries, girls appear to have adjusted to school better than boys.
• Social disadvantage (largely as reported in this Key Finding according to maternal education) was generally associated with more problems adjusting to school and keeping up with the pace of learning.
Institute (ESRI) and Trinity College Dublin (TCD).
The study tracks the development of two nationally representative cohorts of
children over time. One is the Infant Cohort, interviewed initially at 9 months,
subsequently at 3 years, 5 years and, most recently, 7/8 years (on a postal basis).
The second is the Child Cohort, initially interviewed at 9 years and subsequently
at 13 and, most recently, 17/18 years of age.
The first round of fieldwork with the families in the Infant Cohort involved
just over 11,100 9-month-olds, their parents and carers. Interviews took place
between September 2008 and March 2009. The second round of interviews
took place when the children were 3 years of age, between January and
August 2011, and the third round of interviews, when the children were
5 years of age, was completed between March and September 2013. All
interviews in these rounds of fieldwork were carried out on a face-to-face
basis in the Study Child’s home. The response rate at the first wave of
interviews was 65% and 90% at both the second and third waves.
The fourth round of data collection (which forms the basis of the current series
of Key Finding) was conducted on a postal basis (between March and October
2016), when the children were 7/8 years of age. The questionnaire can be found
at http://www.growingup.ie.
The response rate to the postal survey was 55 per cent, representing 5,308
families. The information recorded in the postal surveys was statistically adjusted
on the basis of mother’s education, family income and family social class. This
ensures that the data are representative of the population as a whole. All figures
presented in this Key Finding are based on the statistically adjusted data. The
figures presented in this Key Finding are purely descriptive and do not control for
potential interactions or confounding effects. All figures are preliminary and may
be subject to change.
Several indicators of family advantage/disadvantage were used in this set of Key
Findings. These include the family’s income group, level of mother’s education
and family social class.
These background variables have been ‘carried forward’ from the detailed
interviews conducted with the families on a face-to-face basis when the child was
5 years of age
.If you would like further information about Growing Up in Ireland visit www.growingup.ie
email growingup@esri.ie Freephone 1800 200 434
Access to Growing Up in Ireland data: Anonymised versions of all quantitative
and qualitative data collected in Growing Up in Ireland are available for research through the Irish Social Science Data Archive (ISSDA) (http://www.ucd.ie/issda/ data/growingupinirelandgui/) and the Irish Qualitative Data Archive (IQDA) (https://www.maynoothuniversity.ie/iqda/collections).
Thank you to all participants
The success of Growing Up in Ireland is the result of contributions from a large range of individuals, organisations and groups, many of whom helped to recruit the sample and collect the data. We are particularly grateful to the thousands of families from every part of the country who gave so generously of their time on numerous occasions to make this study possible. A very big ‘thank you’ to all the children and their families.