Development of Squid (
Doryteuthis pealeii
)
Maxwell B. Kaplan1,2, T. Aran Mooney2*, Daniel C. McCorkle3, Anne L. Cohen3
1School of Biology, Medical and Biological Sciences Building, University of St Andrews, St Andrews, Fife, United Kingdom,2Biology Department, Woods Hole Oceanographic Institution, Woods Hole, Massachusetts, United States of America,3Geology and Geophysics Department, Woods Hole Oceanographic Institution, Woods Hole, Massachusetts, United States of America
Abstract
Anthropogenic carbon dioxide (CO2) is being absorbed into the ocean, altering seawater chemistry, with potentially negative impacts on a wide range of marine organisms. The early life stages of invertebrates with internal and external aragonite structures may be particularly vulnerable to this ocean acidification. Impacts to cephalopods, which form aragonite cuttlebones and statoliths, are of concern because of the central role they play in many ocean ecosystems and because of their importance to global fisheries. Atlantic longfin squid (Doryteuthis pealeii), an ecologically and economically valuable taxon, were reared from eggs to hatchlings (paralarvae) under ambient and elevated CO2 concentrations in replicated experimental trials. Animals raised under elevated pCO2 demonstrated significant developmental changes including increased time to hatching and shorter mantle lengths, although differences were small. Aragonite statoliths, critical for balance and detecting movement, had significantly reduced surface area and were abnormally shaped with increased porosity and altered crystal structure in elevatedpCO2-reared paralarvae. These developmental and physiological effects could alter squid paralarvae behavior and survival in the wild, directly and indirectly impacting marine food webs and commercial fisheries.
Citation:Kaplan MB, Mooney TA, McCorkle DC, Cohen AL (2013) Adverse Effects of Ocean Acidification on Early Development of Squid (Doryteuthis pealeii). PLoS ONE 8(5): e63714. doi:10.1371/journal.pone.0063714
Editor:Simon Thrush, National Institute of Water & Atmospheric Research, New Zealand
ReceivedNovember 2, 2012;AcceptedApril 6, 2013;PublishedMay 31, 2013
Copyright:ß2013 Kaplan et al. This is an open-access article distributed under the terms of the Creative Commons Attribution License, which permits unrestricted use, distribution, and reproduction in any medium, provided the original author and source are credited.
Funding:This study was supported by a WHOI Student Summer Fellowship and WHOI-MIT Joint Program, the Penzance Endowed Fund, the John E. and Anne W. Sawyer Endowed Fund and NSF Research Grant No. EF-1220034. Additional support came from NSF OCE 1041106 to ALC and DCM, and NOAA Sea Grant award
#NA10OAR4170083 to ALC and DCM. The funders had no role in study design, data collection and analysis, decision to publish, or preparation of the manuscript.
Competing Interests:The authors have declared that no competing interests exist.
* E-mail: amooney@whoi.edu
Introduction
Global atmospheric carbon dioxide concentrations have increased significantly from pre-industrial levels of c.280 ppmv to approximately 390 ppmv today (Earth Science Research Laboratory Global Monitoring Division 2012) as a result of human activity [1]. The world’s oceans are a carbon sink and have absorbed nearly a third of all anthropogenic CO2 since 1800,
without which atmospheric levels would be much higher than they are now [2]. To date, changes in marine carbon chemistry as a result of CO2uptake include reductions in seawater pH, carbonate
ion concentration, and aragonite (CaCO3) saturation state [3].
Projections under the Intergovernmental Panel on Climate Change (IPCC) A1F1 scenario suggest that atmospheric CO2will
increase to ,1000 ppmv by the year 2100 [4,5], with further increases up to 2000 ppmv by the year 2300 [1]. These increasing atmospheric concentrations will lead to further reductions in the global average surface-water pH of 0.3–0.4 units by the year 2100 [6]. Coastal and high latitude pH levels may be decrease more and reductions will likely occur sooner [1,7].
A number of studies have examined possible organismal responses to a more acidic ocean. Some calcifying taxa have reduced calcification rates under acidic conditions [6] including corals (reviewed in [8]), foraminifera (e.g. [9]), coccolithiphores (e.g. [10]), bivalves (e.g. [11,12]), and pteropods (e.g. [13]). However, some other species demonstrate increased calcification
rates, including echinoderms [14–16], decapod crustaceans [15], teleost fish [17], and some juvenile cephalopods [18,19].
Impacts on development and early life history are a particular concern [20–25] because young animals may not be as resilient to physiological stress as juveniles or adults [21,26]. Atlantic cod (Gadus morhua) larvae reared under ocean acidification conditions (1800 and 4200matm) exhibited severe to lethal tissue damage in multiple organs; effects were more pronounced with increasing
pCO2 [26]. In addition, early exposure of estuarine fish larvae
(Menidia beryllina) to elevatedpCO2(up to,1000matm) reduced
survival and larval length [21]. These effects raise concern as recruitment cohorts lay the foundation for population success.
environmental conditions [36,37]. For example, the population size of Illex argentinus in the Southern Ocean has been linked to interannual variation in sea-surface temperature (SST) in a likely hatching area, with SST of 16–18uC most favorable for successful recruitment [38].
A limited number of studies have investigated cephalopod responses to pH orpCO2. Work has focused on the cuttlefish and
experiments suggest that pH is an important measure of water quality for certain squid species [39]. Elevated pCO2 impairs
cephalopod oxygen transport capabilities because oxygen binding to the cephalopod respiratory protein haemocyanin is highly pH dependent [40]. In the European cuttlefish (Sepia officinalis), dorsal mantle lengths and body mass of embryos and hatchlings were significantly shorter under elevated pCO2 (,3700 matm)
com-pared to control concentrations [41]. It was suggested the extreme hypercapnia (elevated blood pCO2) could induce metabolic
depression in developing hatchlings because the degree of sensitivity to reduced seawater pH may be linked to the presence and capacity of ion regulatory structures, which may not be fully formed during early cephalopod life stages [41]. Despite these effects, another experiment that exposed hatched S. officinalisto very high CO2concentrations (,4000 and,6000matm) over a
6-week period found no difference in mantle length between treatments [18]. These seemingly disparate findings between experiments may result from the different life stage at which measurements were taken (i.e., juvenile cuttlefish may have better developed acid-base regulatory abilities than developing embryos). In addition to physiological impacts, internal calcified structures such as squid statoliths may also be affected by reduced seawater pH [18,19,42,43]. Located in paired statocysts and analogous in function and similar in structure to fish otoliths, statoliths are vital for sensing gravity and movement [44]. Squid statolith formation is initiated directly after gastrulation during early embryonic development [45]. Initial results for one squid species,L. vulgaris, suggest statolith surface area may increase with greater pCO2
levels (850 and 1500 matm) [42]; however, aragonite saturation states were not calculated, which makes it difficult to assess these changes. Even small impacts to statolith growth are of concern because improper formation can severely impact balance and orientation [46].
ElevatedpCO2(,6000matm) resulted in increased calcification
rates of the cuttlebone in adult S. officinalis. A more recent experiment on cuttlefish embryos and juveniles also suggests that cuttlebone calcification rates increase even under more moderate levels of seawaterpCO2(,800 and,1400matm) [19]. As these
studies vary in species, life stage andpCO2levels, it is still unclear
how calcification in cephalopods is affected bypCO2.
In particular, there is a need for a focused study to examine how ocean acidification may impact squid. Here we investigate the impacts of elevated pCO2 on the early life history of Atlantic
longfin squid Doryteuthis pealeii (formerly Loligo pealeii) paralarval development (time to hatching and size at hatching), statolith size, and statolith morphology. The study species, D. pealeii, is of significant commercial importance in the North Atlantic [47] and is considered a key prey item for a variety of marine mammal, seabird, and finfish species [27,31].
Materials and Methods
Experiments were conducted at the Woods Hole Oceanograph-ic Institution between June-August 2011. The use and care of the animals was performed with approval from the Woods Hole Oceanographic Institution’s Animal Care and Utilization Com-mittee (IACUC). All necessary permits were obtained for the
described studies including the collection of adult squid. These were gathered by the Marine Biological Laboratory, which has a research permit issued by the Massachusetts Division of Marine Fisheries to collect invertebrates in various life stages for research and education (permit number 152087). No specific permissions were required for these locations/activities because they fall under the permit provisions. The collecting location was not privately owned or protected in any way and the field studies did not involve endangered or protected species.
Collection and husbandry
Squid were captured by trawl in Vineyard Sound on two occasions in 10–30 meters of water. Temperature in the area at the time of capture was 16.7uC and 17.9uC, and salinity was 30.7 and 30.8, respectively (data from the 12 meter node at the Martha’s Vineyard Coastal Observatory). These values are typical for longfin squid recruits, which are primarily found in water ranging from 6–35 m depth, 4–28uC, and with salinity of 30–37 between the spring and fall [29]. Similar to some other inshore squid species,D. pealeiiis able to tolerate temperature and salinity variations [39]. Adults in healthy condition (free of cuts and scrapes) were hand-selected from the group, gently placed in individual buckets, and transported from the Marine Biological Laboratory to a holding tank in the Environmental Systems Laboratory (Woods Hole Oceanographic Institution, Woods Hole, MA) within 1 hour of being caught. To encourage mating, more females than males were selected from the trawl (f:m ratio; 6:2 and 16:3). The holding tank (120 cm diameter; 70 cm depth) contained a layer of fine-grained sand at the bottom (,2 cm thick). The sand was collected from a nearby beach and was rinsed thoroughly with sand-filtered seawater prior to being added to the holding tank. The holding tank was set up in a flow-through system with sand-filtered seawater that was temperature-controlled to,20uC using aquarium heaters and chillers. In accordance with our animal care protocols, squid were fed twice daily with live
Fundulus heteroclitus, which were gathered from a local bay.
Experimental set-up
Individual aquaria (1-litre Solo PET food service containers) were set up in a flow-through system at the beginning of each trial and were equilibrated with different CO2 concentrations. The
PET containers (16 in total) were placed in a water bath in which temperature was maintained at,20uC (monitored using an Onset data logger (pendant model UA-002-64), which recorded ambient light intensity and water temperature every 15 minutes). The containers were covered tightly with lids in which a single hole had been cut (0.5 cm diameter), which allowed the water and gas tubing to fit snugly inside. Vineyard Sound seawater, temperature-controlled to 20uC and 5mm-filtered, was fed into a header tank from which it flowed through 2 ‘H’-shaped equilibration chambers. Seawater in chamber 1 was continuously equilibrated with air pumped from an indoor air compressor, while seawater in chamber 2 was equilibrated with the air from the same source enriched with CO2using Aalborg Mass Flow Controllers (model
GFC17 and GFC37). Both gas mixtures passed through air stones in the equilibration chambers. The concentrations of CO2in the
gases bubbled in the two sets of aquaria were set to 390 matm (control) and 2200matm (treatment), targeting pH levels of 8.0 and 7.3 for the control and elevated pCO2 levels respectively. CO2
concentrations of the gases were analyzed weekly using a Qubit Systems CO2 Analyzer (model s151) with reference to 3 known
of the experiment (mean6SE; control: 39466 ppm; treatment: 2267610 ppm.
Water from the equilibration chambers entered a PVC manifold from which it was supplied individually to the containers to ensure that the egg capsules were well oxygenated and in order for metabolic byproducts to be expediently removed from the containers (as in [48,49]). Flow to each container was approxi-mately 21 liters d21. Each container was also bubbled individually with the same air or air + CO2 mixture to ensure continued
equilibration. Bubbling rates and water flow rates in the ‘‘H’’-shaped equilibration columns (upstream), and in the experimental cups (downstream) were adjusted so that pH was on a plateau and not sensitive to small fluctuations in water flow, water chemistry, or gas flow. Outgoing water dripped out of the container through a hole in the side of the container covered in 500mm mesh to prevent loss of larvae. Water was circulated through the system for several days prior to introducing the eggs, during which the pH in each treatment was tested every other day using a pH meter (Orion 3 Star Plus model 1212001, ThermoElectron Corporation) to ensure that target pH levels had been reached and remained stable. The experiment was carried out in a windowless room that was maintained on a 12:12 light:dark photoperiod by 4 ceiling-mounted fluorescent bulbs.
Multiple females laid several egg capsules in one large egg cluster after 1–2 days in the holding tank prior to the start of both experimental trials. Each egg capsule may contain between 100– 200 fertilized eggs, with considerable inter-capsule variability in the number of eggs per capsule both within and between females [50]. Furthermore, femaleD. pealeiiare able to store sperm from multiple males [51], and their egg capsules are known to contain eggs fertilized by multiple males [52]. Thus, it was likely these egg capsules contained fertilized embryos from multiple males.
The morning after eggs were laid, 2 randomly selected egg capsules from the egg cluster were added to each of 6 containers per trial (3 containers per CO2 concentration per trial). This
balanced the need for numerous embryos with the feasibility of measuring paralarvae immediately after hatching. An additional 4 containers were included in the water bath as blanks (2 per CO2
concentration) and contained no eggs throughout the experiment for comparative purposes so that seawater chemistry measure-ments could be taken independent of potential biotic effects on chemistry parameters.
Seawater Chemistry
Seawater pH was measured using a pH meter every other day and by spectrophotometer weekly throughout the experiment in a method adapted from Clayton & Byrne [53] and Dickson et al.
[54]. Samples for spectrophotometric pH analysis were first taken on 6 July 2011 (day 5 of trial 1) and were taken weekly thereafter from a subset of aquaria. Electrode-based pH measurements were converted from the NBS scale to the total scale and were used for monitoring purposes only; spectrophotometric pH measurements, also expressed on the total scale, were used for seawater chemistry calculations.
Salinity samples were collected in 120 mL glass bottles weekly concurrently with the samples for spectrophotometric analysis, but were analyzed at a later date. Total alkalinity (AT) samples were
also taken weekly in plastic acid-washed 20 mL scintillation vials and poisoned with 11ml of saturated mercuric chloride (HgCl2).
These samples were analyzed using automated Gran titrations of 1 mL samples, run in duplicate and standardized using certified reference materials (from the laboratory of Andrew Dickson, SCRIPPS Institution of Oceanography) (method adapted from Holcombet al. [49]). If there was a discrepancy of more than 4
mequiv/kg, duplicate samples were run again. Using CO2sys software, temperature, pH, salinity, and AT values were used to
calculate aragonite saturation state values (VArag) in each
treatment [55,56] using dissociation constants from Mehrbach
et al.[57] refit by Dickson & Millero [58], sulphate constants from Dickson [59], and carbonate mineral solubilities from Mucci [60].
Measurement Protocol
Containers were checked for hatching daily, and time to first hatching was recorded. Containers continued to be inspected every 24 hours until all eggs had hatched (18 days in trial 1; 19 days in trial 2 from day of egg laying to last hatching). On the day they were observed, all hatchlings were removed from their container and counted in order to calculate the number of animals hatched per day. Larvae were then placed in new containers (one container per treatment containing all of the hatched larvae from that day) to separate the eggs and new hatchlings. Thus, cup densities varied. Paralarvae were not fed, because they hatch with a yolk sac, which fuels their initial (post-hatching) metabolic requirements [61]. Animals were not reared beyond this yolk stage because of the high mortality rate of squid raised in captivity [39]. A subset of the hatchlings (10 paralarvae d21) from each of the 3 containers per treatment and trial (i.e., n = 30 animals per treatment per trial per day) was subjected to morphological analyses. Randomly selected individuals were gently lifted via pipette and placed lengthwise and dorsal-side up on a glass slide in a small drop of water. Multiple photographs of each individual were taken using a Dino-Lite Pro2 AD-413TL USB-microscope (calibrated twice daily prior to taking the first measurement of each treatment by placing a standard in the field of view) and the DinoXcope software. Only photographs of the dorsal side, of undamaged individuals, and of animals that were not moving when the image was captured, were retained for mantle length analysis. In order to facilitate rapid assessments of the hatchings, dorsal mantle length (ML) was determined from the image later using the measurement tools in the DinoXcope software.
Every day another random subset of paralarvae (n = 10 per treatment, pooled across containers) were fixed in 97% ethanol. Statoliths were dissected out of a further subset of these ethanol-fixed paralarvae (pooled across days but separated by CO2
treatment). Only one statolith per dissected individual was retained in order to maintain sample independence. All statoliths were soaked briefly (,15 minutes) in a dilute bleach solution in order to dissolve any remaining tissue. This is a standard method to remove tissue from otoliths and coral skeletons before detailed mass and visual morphological measurements [62–64]; visual assessments of the statoliths indicated that this method did not impact morphol-ogy. We obtained 36 statoliths from control and 22 from treatment CO2-reared individuals available for comparison; unequal
num-bers resulted from the difficult nature of statolith extraction and a limited number of preserved larvae from which samples could be taken. The statoliths were mounted on stubs in a uniform orientation (anterior view) for scanning electron microscopy (SEM) using a fine paintbrush and were sputter-coated with platinum or gold. Images were collected using both a Zeiss NTS Supra 40VP with a field emissions source for the electrons and a JEOL JSM 35CF. Surface area measures were made using the programs Axiovision (Carl Zeiss, USA) and SemAfore (JEOL, Germany) with outline and ROI tools, which captured 2-dimensional surface area. These tools were calibrated individually for each SEM image using the scale bar present.
morphological abnormalities in developing squid by Rosa et al. [66] and was defined as: (1) standard statolith shape and normal/ minimal porosity, (2) standard shape with some abnormalities in the surface structure, slightly porous, and (3) porous and/or abnormal shape. Standard statolith shape is well described elsewhere [44,67–69]. Briefly, statoliths are oriented in the long axis approximately in line with the dorso-ventral plane of the animal [69]. Adult squid statoliths are composed of four parts: dorsal dome, lateral dome, rostrum wing, with variation between species [69]; however, paralarval statoliths are typically droplet-shaped [68]. Abnormalities were defined by varying degrees of pitting in the statolith surface and morphological deformations (i.e., deviations from the droplet shape).
Statistical analysis was carried out in PASW 18.0 and SPSS 19.0 for Windows (IBM Corporation, NY, USA). Values reported are means6SE unless otherwise noted. One-way ANOVAs, General Linear Models (GLMs) and Chi-squared tests were used to compare between treatments and trials. Where ANOVAs were used, data were normally distributed. The hatching data represent counts in a J-by-K table where J is the number of treatments and K is the number of days. We tested the null hypothesis that the distribution of hatching across the days was the same for all treatments using a Chi-squared test. Because egg capsules contained variable numbers of embryos, Fig. 2 shows the proportion hatching per day to better reflect relative differences between treatments and trials. All results were adjusted using the Bonferroni correction, which reduces the critical p value based on the number of parameters tested.
Results
Gas concentrations in both treatments remained stable for the duration of the experiment, and resulted in pH (total scale) of 7.86 (control) and 7.31 (treatment), and correspondingVAragvalues of
1.71 and 0.53 respectively (Table 1). Thus, the control pCO2
condition was supersaturated with respect to aragonite while the elevated pCO2 condition was under-saturated. The pH and
saturation state of the control are lower than what would be expected from equilibration with air, which may reflect variation in near-shore conditions during the course of the experiment and/ or incomplete equilibration of the incoming flow-through water with the control bubbled air. As such, calculatedpCO2levels (from
CO2sys) were 626matm for the control and 2440matm for the treatment (averaged across trials). There were clear differences in pH between control- and treatment-pCO2-equilibrated aquaria.
Temperature, salinity and alkalinity remained steady for the duration of the experiment (Table 1).
While paralarvae first hatched on day 14 of both trials, animals raised in control conditions hatched in higher proportions. On day 14 (first day of hatching) of trial 1, control animals were 62.6% hatched, whereas only 0.7% hatched under treatment conditions (Fig. 2). Hatching proportion difference on the first day of trial 2 hatching was smaller (day 14: 1.8% control; 0.0% treatment). However, the following day, control cups hatched in substantially higher proportions (70.5% control; 37.5% treatment). The time to reach 90% of total hatching was ,24 hours greater for trial 1 paralarvae reared under elevatedpCO2than for trial 1 control
paralarvae. A similar delay was apparent but shorter (,24 h) in trial 2. The temperature range from one day prior to hatching until hatching was complete was 19.9–21.2uC for trial 1 and 19.9– 21.3uC for trial 2, and there were no temperature spikes that may have stimulated early hatching. The overall distributions of proportion hatching differed significantly between treatments in both trials (Chi-squared, trial 1:x2
= 789.l, df = 4, p,0.001; trial 2: x2
= 197.0, df = 5, p,0.001). Hatching was complete after 5 days in trial 1 and after 6 days in trial 2 (resulting in variable degrees of freedom between trials). Thus both initial and final (total) hatching of the CO2 treated embryos was delayed by
approximately 24 hrs in trial 1, and by a smaller margin in trial 2. Mantle length differed significantly between treatments (GLM with mantle length as the dependent variable and trial and treatment as factors: F1,292= 9.241, p,0.003), but the differences
were small. Animals raised in elevated pCO2 conditions had
shorter mantles in both trials (treatment: 1.7860.01 mm; n = 175, c.f. control: 1.8160.01; n = 120). Differences were significant when trials were pooled (Fig. 3), and within trial 1. Trial 2 showed clear, but not significant, differences. The difference between trials in hatchling mantle lengths was significant (F1,292= 13.027,
p,0.001).
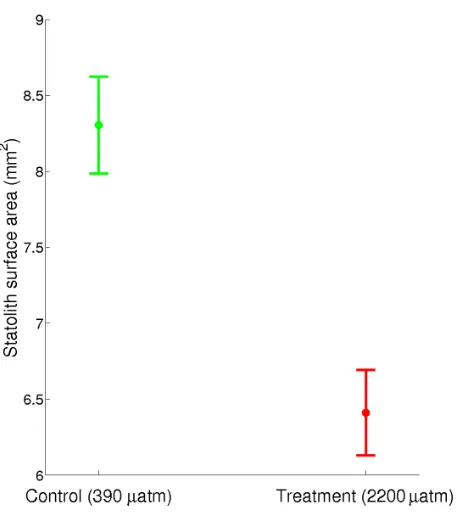
Aragonite statoliths dissected from paralarvae reared in treatment pCO2 had 25% lower surface area (F1,55= 70.722,
p,0.001; Fig. 4). There was no significant difference between trials (F1,54= 2.175, p,0.146). While statoliths from the control
CO2 treatment were normally shaped, statoliths from high CO2
paralarvae typically exhibited abnormal and irregular shapes and were more porous (Fig. 5). In addition, SEM images of statoliths from the control treatment showed crystal size (submicron), shape (acicular), orientation (aligned along long-axes) and arrangement of crystal bundles (arrays radiating out from the primordium) that were typical of statoliths formed under ambientpCO2conditions
[image:4.612.60.374.565.694.2]and consistent with paralarval statoliths of other squid species [48].
Figure 1. Grading criteria for statoliths according to shape and porosity.Grades were given to statoliths based on SEM images. Example diagrams show increasing porosity and malformations with increasing grade.
This highly organized ultra-structure was not observed in statoliths accreted under elevatedpCO2. The distribution of grades given to
statoliths varied significantly between treatments (x2
= 35.796, df = 2, p,0.001; Fig. 6).
Discussion
We observed clear differences between D. pealeii paralarvae reared under control and treatment CO2concentrations. Effects
were found across all variables tested including hatching time, overall body size and internal aragonite statoliths. The spectrum of impacts suggests that young squid may be impacted by ocean acidification conditions projected for the end of this century [7]. Although the CO2and pH levels in this study were high compared
to near-term open ocean estimates [6] they fall within the range of
[image:5.612.62.516.57.334.2]future ocean predictions [1,70], and of current near-shore variation [71–73]. While observations in this area are limited, data from two studies in different years and in different seasons suggests that the aragonite saturation state throughout the coastal range ofD. pealeii can vary between 1.4–2.4, which is similar to values calculated for the control treatment (AOML-NEFSC collaborative project. Data collected on R/V Delaware II, analyzed and hosted by AOML, assembled by N. Rebuck; [74]), and pH may vary from 7.85–8.05 in Massachusetts shelf waters [74]. The species tested is a coastal squid that lives in relatively shallow waters during summer breeding seasons, which last from May to August in New England [47,75]. Thus this experiment took place during the middle of the annual breeding season.
Figure 2. Hatching timeline for squid paralarvae over replicated trials. Paralarvae reared under control CO2concentrations initiated hatching earlier. Hatching numbers were pooled across individual aquaria and the proportion hatching per day was calculated. Distributions of hatching numbers were significantly different (Chi-squared, trial 1:x2= 789.l, df = 4, p
,0.001; trial 2:x2= 197.0, df = 5, p
,0.001). Because egg capsules contained variable numbers of embryos, this figure shows the proportion hatching per day to better reflect relative differences between treatments and trials. In trial 1, hatching of control paralarvae was 90% complete (line) 24 hours earlier than of paralarvae raised under treatment CO2 conditions. Delays were smaller in trial 2 but still notable. Total number of paralarvae hatching (control, treatment): trial 1–577, 855; trial 2–887, 533. doi:10.1371/journal.pone.0063714.g002
Table 1.Carbon chemistry measurements.
Condition Temperature (uC) pHtotal Salinity AT(mmol/kgSW) VArag
390matm Blank 20.58 (0.01) 7.87 (0.02) 30.865 (0.045) 2069.7 (4.7) 1.76 (0.06)
390matm Trial 1 20.53 (0.01) 7.85 (0.01) 30.851 (0.046) 2067.0 (10.0) 1.68 (0.01)
390matm Trial 2 20.62 (0.01) 7.86 (0.01) 30.799 (0.027) 2061.1 (3.5) 1.69 (0.02)
2200matm Blank 20.58 (0.01) 7.32 (0.01) 30.799 (0.032) 2060.7 (5.7) 0.54 (0.01)
2200matm Trial 1 20.53 (0.01) 7.30 (0.01) 30.900 (0.026) 2081.3 (2.3) 0.52 (0.01)
2200matm Trial 2 20.62 (0.01) 7.31 (0.01) 30.756 (0.013) 2058.1 (3.9) 0.53 (0.01)
[image:5.612.63.556.603.712.2]Under elevated pCO2 conditions, paralarval hatching was
significantly delayed. Delayed hatching could result from meta-bolic suppression due to elevatedpCO2[76]. Cephalopod embryos
develop in the perivitelline fluid (PVF) in which, due to gas diffusion properties of the eggshell, pCO2 is very high and pO2
very low [19]. Thus, the PVF may be undersaturated with respect to aragonite even under ambient pH conditions; under seawater
pCO2of,1400matm the PVFpCO2could be as high as,4000
matm [19]. As such, ocean acidification conditions may signif-icantly increase the PVF pCO2, which may lead to additional
metabolic costs (e.g. [14]). Delayed development in cuttlefish has been found when reared at ,3700 matm [41], and elevated seawaterpCO2has also been linked to longer development times
in other marine invertebrate species [77,78]. However, other rearing experiments on cephalopods have found no evidence for delayed development under seawaterpCO2ranging from 900 to
1400matm [42], suggesting that there may be threshold levels at which ocean acidification will affect cephalopods. Because squid egg sacs are a food resource for many fishes [28], extended development time would increase the probability of being preyed upon. In addition, increased development time may also put additional metabolic obligations on marine invertebrates that could lead to the depletion of egg yolk nutrients, with negative implications for survival.
Mantle length was significantly reduced in elevated pCO2
[image:6.612.61.432.60.271.2]-reared paralarvae but the differences were small. Similar results have been reported for cuttlefish reared at,3700matm [41]. In fish, reduced larval size at hatching increases the likelihood of predation due to extended development durations, and results in higher overall mortality rates [79,80]. Fish larval swim speeds and distances travelled are positively correlated with larval size [81]. As squid paralarvae are highly mobile and migratory, reduced size may impact travel speed, ability to swim in currents, and migration distance. The relative differences in mantle length were more pronounced in trial 1 than trial 2. This heterogeneity may have resulted from a number of factors including pre-fertilization environmental and genetic differences between groups. Environ-mental conditions of the egg can impact larval size and development in fish and cephalopods [39,82], and maternal condition may also affect egg quality [83–85]. Given that this experiment used eggs from female squid that were caught on two separate occasions, it is possible that the two groups had been exposed to different feeding opportunities, but prior to egg laying the captured squid were all fed the same fish diet and thus there were no dietary differences in the days immediately prior to
Figure 3. 95% confidence intervals for paralarval mantle lengths of squid raised in control and treatment CO2conditions.Mantle lengths were significantly longer (F1,292= 9.241, p,0.003) for paralarvae reared under control conditions (1.8160.01; n = 120) compared to treatment (1.7860.01; n = 175).
doi:10.1371/journal.pone.0063714.g003
Figure 4. Statolith surface area. 95% confidence intervals for statolith surface area pooled across trials. Statoliths from paralarvae reared under control conditions were significantly larger in area (F1,55= 70.722, p,0.001, 8.360.16 mm2) than those from animals reared in treatment CO2(6.460.14 mm2).
[image:6.612.61.289.413.671.2]spawning in the laboratory. Therefore, while female condition was uncertain, we do not expect that it was a major determinant in the impacts seen here. No differences in mantle length were found in
Loligo vulgaris paralarvae when reared under 380, 850 and 1500
matmpCO2[42]. Thus, adverse effects of ocean acidification on
cephalopods may only be present at significantly elevatedpCO2
(i.e., the levels used in the present experiment and in that of Hu
et al. [41]).
The control water was supersaturated with respect to aragonite (Varag<1.7) and the treatment water was under-saturated
(Varag<0.5). In under-saturated conditions, aragonite should tend
towards dissolution in seawater rather than precipitate out of it. Although several studies have shown that corals, molluscs and calcifying plants can continue to accrete aragonite structures even in under-saturated conditions (e.g. [15,20,86,87]), undersaturation usually has strong, negative impacts on both the amount of aragonite these organisms produce and the morphology and
organization of crystals (e.g. [20]). In this study, paralarval squid statoliths had significantly reduced surface area in animals reared under elevated pCO2. Conversely, in young fish and cuttlefish,
both of which accrete internal aragonite structures, structure size and calcification rate have been shown to increase in low pH conditions [17,19]. Calcification rates of the cuttlebone have been shown to increase in the cuttlefish atpCO2ranging from,800 to ,6000 matm [18,19] while cuttlebone density did not differ between pCO2 levels. Similar results have been shown for the
squidL. vulgaris, in which statolith surface area increased under elevatedpCO2(,850 and,1500matm) [42]. Unlike the variation
in development times and mantle lengths between experiments, differences in the growth of calcified structures do not follow a clear trend across studies in terms of effects that vary withpCO2
[image:7.612.59.457.62.211.2]level or life stage. As such, further investigation is necessary to better characterize the variability in cephalopod calcification acrosspCO2levels, structures, developmental stage, and species. Figure 5. SEM images of paralarval statoliths.Six squid statoliths imaged using SEM (scale bar (white line) = 20mm). Statoliths of squid raised in elevatedpCO2(2200matm) concentrations were more porous and more irregular in shape, compared to statoliths from individuals reared under control (390matm) CO2levels. Statoliths A1 and A2 (both control) are grade 1 and are indicative of normal paralarval statolith shape and structure. Statoliths B1 (control) and B2 (treatment) are grade 2. B1 is indicative of a moderate degree of porosity and B2 shows some malformation in structure. Statoliths C1 and C2 (both treatment) are grade 3 and both demonstrate a major degree of porosity and malformation. (A1: 138mm long, 8.3 mm2; B1: 130mm long, 7.2 mm2; C1: 118mm long, 6.4 mm2
. A2: 150mm long, 9.9 mm2; B2: 122mm long, 6.4 mm2; C2: 123mm long, 6.3 mm2). doi:10.1371/journal.pone.0063714.g005
Figure 6. Statolith grades in two treatments.Statoliths were graded based on the following criteria outlined in Figure 1: (1) standard statolith shape and normal/minimal porosity, (2) standard shape with some abnormalities in the surface structure, slightly porous, and (3) porous and/or abnormal shape. The distribution of grades differed significantly between treatments (x2
[image:7.612.60.376.491.676.2]In addition to reduced surface area, many statoliths removed from high pCO2-reared individuals in this experiment were
malformed, and showed abnormal crystal structure. Squid statoliths, including those of Doryteuthis spp, typically consist of crystal bundles arranged in arrays radiating out from the primordium [88–91]. Here, the statolith crystal structure of controlpCO2-reared hatchlings was consistent in size, shape and
orientation with paralarval statoliths of other squids reared under control conditions [48]. However, high pCO2-reared paralarval
statoliths lacked a highly organized ultra-structure, were more porous, and deviated from the typical droplet shape. Mis-shapen statoliths may have severe consequences for squid because the statolith is required for proper swimming and orientation as they migrate, find food and avoid predators. We were unable to obtain adequate videos of swimming behavior in this study, but malformed statoliths have been shown to disable swimming abilities [46,92], and sensory abilities are impaired when statoliths are not present [93].
Our results suggest that exposure of embryos and early larval stages to elevatedpCO2and/or lowered pH may be particularly
detrimental. However, this and other squid species dynamically migrate [47,94] and encounter oceanographic regions of high CO2 during their lifetimes [76,95]. Pacific Humboldt squid
(Dosidicus gigas) are able to suppress their metabolism when vertically migrating through oxygen minimum zones [96]. Other squid, such asVampyroteuthis infernalis, exist almost solely in these environments and thus are presumed to have vital rates adapted to higher CO2 and lower O2 levels [97]. The high reproductive
output of most cephalopod species suggests that their potential for
adaptation to a changing environment may be high. Results thus far suggest that there may be pCO2 threshold levels at which
effects on cephalopod embryonic development time and size-at-hatching are demonstrated [41]. Indeed, some studies that have examined ocean acidification effects on older (i.e., juvenile) animals or that have used lowerpCO2levels have found no such
effects [18,42,43]. The cephalopod calcification response to ocean acidification does not appear to follow a clear trend, which suggests that further investigations with other squid species under similar experimental conditions are required to determine the range of responses. Likewise, experiments across a range of CO2
concentrations will be needed in order to determine whether there are threshold ocean acidification levels for impacts on calcification rates in cephalopods.
Acknowledgments
We thank R. Hanlon for providing initial advice on squid husbandry and M. White for technical advice and training. We also thank M. Jacobs, L. Kerr, I. Davidson, A. Brierley, M. McCafferty, K. Rose, A. Tarrant, J. Yoder, A. Sharr, A. Streets, A. Solow, M. Wilsterman, L. Mullineaux, N. Rebuck, S. Gallagher, S. Zacarias, and A. York for assistance in various parts of this work, and two anonymous reviewers for their helpful comments on an earlier draft of the manuscript.
Author Contributions
Conceived and designed the experiments: MBK TAM DCM ALC. Performed the experiments: MBK TAM. Analyzed the data: MBK TAM DCM ALC. Contributed reagents/materials/analysis tools: MBK TAM DCM ALC. Wrote the paper: MBK TAM DCM ALC.
References
1. Caldeira K, Wickett ME (2003) Anthropogenic carbon and ocean pH. Nature 425: 365–365.
2. Sabine CL, Feely RA, Gruber N, Key RM, Lee K, et al. (2004) The oceanic sink for anthropogenic CO2. Science 305: 367–371.
3. Doney SC, Fabry VJ, Feely RA, Kleypas JA (2009) Ocean Acidification: The Other CO2Problem. Ann Rev Mar Sci 1: 169–192.
4. Friedlingstein P, Houghton RA, Marland G, Hackler J, Boden TA, et al. (2010) Update on CO2emissions. Nat Geosci 3: 811–812.
5. Poruschi L, Dhakal S, Canadell JG (2010) Ten Years of Advancing Knowledge on the Global Carbon Cycle and its Management. Tsukuba: Global Carbon Project.
6. Orr JC, Fabry VJ, Aumont O, Bopp L, Doney SC, et al. (2005) Anthropogenic ocean acidification over the twenty-first century and its impact on calcifying organisms. Nature 437: 681–686.
7. Steinacher M, Joos F, Fro¨licher TL, Plattner GK, Doney SC (2009) Imminent ocean acidification in the Arctic projected with the NCAR global coupled carbon cycle-climate model. Biogeosciences 6: 515–533.
8. Hoegh-Guldberg O, Mumby PJ, Hooten AJ, Steneck RS, Greenfield P, et al. (2007) Coral reefs under rapid climate change and ocean acidification. Science 318: 1737–1742.
9. Spero HJ, Bijma J, Lea DW, Bemis BE (1997) Effect of seawater carbonate concentration on foraminiferal carbon and oxygen isotopes. Nature 390: 497– 500.
10. Riebesell U, Zondervan I, Rost B (2000) Reduced calcification of marine plankton in response to increased atmospheric CO2. Nature 407: 364–367.
11. Waldbusser G, Bergschneider H, Green M (2010) Size-dependent pH effect on calcification in post-larval hard clamMercenariaspp. Mar Ecol Prog Ser 417: 171–182.
12. Gazeau F, Quiblier C, Jansen JM, Gattuso JP, Middelburg JJ, et al. (2007) Impact of elevated CO2on shellfish calcification. Geophys Res Lett 34: 1–5.
13. Comeau S, Gattuso JP, Nisumaa AM, Orr J (2012) Impact of aragonite saturation state changes on migratory pteropods. Proc Biol Sci 279: 732–738. 14. Wood HL, Spicer JI, Widdicombe S (2008) Ocean acidification may increase
calcification rates, but at a cost. Proc Biol Sci 275: 1767–1773.
15. Ries JB, Cohen AL, McCorkle DC (2009) Marine calcifiers exhibit mixed responses to CO2-induced ocean acidification. Geology 37: 1131–1134.
16. Gooding RA, Harley CDG, Tang E (2009) Elevated water temperature and carbon dioxide concentration increase the growth of a keystone echinoderm. Proc Natl Acad Sci USA 106: 9316–9321.
17. Checkley DM, Dickson AG, Takahashi M, Radich JA, Eisenkolb N, et al. (2009) Elevated CO2enhances otolith growth in young fish. Science 324: 1683–1683.
18. Gutowska MA, Po¨rtner HO, Melzner F (2008) Growth and calcification in the cephalopodSepia officinalisunder elevated seawaterpCO2. Mar Ecol Prog Ser
373: 303–309.
19. Dorey N, Melzner F, Martin S, Oberha¨nsli F, Teyssie´ JL, et al. (2012) Ocean acidification and temperature rise: effects on calcification during early development of the cuttlefishSepia officinalis. Mar Biol: Online Publication. 20. Cohen AL, McCorkle DC, de Putron S, Gaetani GA, Rose KA (2009)
Morphological and compositional changes in the skeletons of new coral recruits reared in acidified seawater: Insights into the biomineralization response to ocean acidification. Geochemistry Geophysics Geosystems 10.
21. Baumann H, Talmage SC, Gobler CJ (2011) Reduced early life growth and survival in a fish in direct response to increased carbon dioxide. Nat Clim Chang: 6–9.
22. Simpson SD, Munday PL, Wittenrich ML, Manassa R, Dixson DL, et al. (2011) Ocean acidification erodes crucial auditory behaviour in a marine fish. Biol Lett 7: 917–920.
23. Po¨rtner HO (2008) Ecosystem effects of ocean acidification in times of ocean warming: a physiologist’s view. Mar Ecol Prog Ser 373: 203–217.
24. Po¨rtner HO, Farrell AP (2008) Physiology and Climate Change. Science: 690– 692.
25. Kurihara H (2008) Effects of CO2-driven ocean acidification on the early
developmental stages of invertebrates. Mar Ecol Prog Ser 373: 275–284. 26. Frommel AY, Maneja R, Lowe D, Malzahn AM, Geffen AJ, et al. (2011) Severe
tissue damage in Atlantic cod larvae under increasing ocean acidification. Nat Clim Chang: 1–5.
27. Clarke MR (1996) Cephalopods as prey. III. Cetaceans. Philos Trans R Soc Lond B Biol Sci 351: 1053–1056.
28. Boyle PR, Rodhouse P (2005) Cephalopods: Ecology and fisheries. Oxford, UK: Blackwell Science.
29. Jacobson LD (2005) Longfin Inshore Squid, Loligo pealeii, Life History and Habitat Characteristics. NMFS. Woods Hole, MA. 52p.
30. Zeidberg LD, Robison BH (2007) Invasive range expansion by the Humboldt squid,Dosidicus gigas, in the eastern North Pacific. Proc Natl Acad Sci USA 104: 12948–12950.
31. Overholtz W, Link JS, Suslowicz LE (2000) Consumption of important pelagic fish and squid by predatory fish in the northeastern USA shelf ecosystem with some fishery comparisons. ICES J Mar Sci 57: 1147–1159.
33. Rosas-Luis R, Salinas-Zavala CA, Koch V, Luna PDM, Morales-Za´rate MV (2008) Importance of jumbo squidDosidicus gigas(Orbigny, 1835) in the pelagic ecosystem of the central Gulf of California. Ecol Modell 218: 149–161. 34. Xavier JC, Croxall JP, Reid K (2003) Interannual variation in the diets of two
albatross species breeding at South Georgia: implications for breeding performance. Ibis: 593–610.
35. CaCOFI (2011) CaCOFI Report: Review of Selected California Fisheries for 2010: Coastal Pelagic Finfish, Market Squid, Ocean Salmon, Groundfish, Highly Migratory Species, Dungeness Crab, Spiny Lobster, Spot Prawn, Kellet’s Whelk, and White Seabass. California Department of Fish and Game. 36. Rodhouse PG (2001) Managing and forecasting squid fisheries in variable
environments. Fish Res 54: 3–8.
37. Robin JP, Denis V (2001) Squid stock fluctuations and water temperature: temporal analysis of Channel Loliginidae. J Appl Ecol 36: 101–110. 38. Waluda CM, Rodhouse PG, Podesta´ GP, Trathan PN, Pierce GJ (2001) Surface
oceanography of the inferred hatching grounds ofIllex argentinus(Cephalopoda: Ommastrephidae) and influences on recruitment variability. Mar Biol 139: 671– 679.
39. Hanlon RT, Hixon RF, Hulet WH (1983) Survival, Growth and Behaviour of the Loliginid SquidsLoligo plei,Loligo pealei, andLolliguncula brevis(Mollusca: Cephalopoda) in Closed Sea Water Systems. Biol Bull 165: 637–685. 40. Po¨rtner HO, Langenbuch M, Reipschla¨ger A (2004) Biological Impact of
Elevated Ocean CO2Concentrations: Lessons from Animal Physiology and
Earth History. Journal of Oceanography 60: 705–718.
41. Hu MYA, Tseng YC, Stumpp M, Gutowska MA, Kiko R, et al. (2011) Elevated seawater pCO2differentially affects branchial acid-base transporters over the
course of development in the cephalopodSepia officinalis. Am J Physiol Regul Integr Comp Physiol 300: R1100–R1114.
42. Lacoue-Labarthe T, Re´veillac E, Oberha¨nsli F, Teyssie´ JL, Jeffree R, et al. (2011) Effects of ocean acidification on trace element accumulation in the early-life stages of squidLoligo vulgaris. Aquat Toxicol 105: 166–176.
43. Gutowska MA, Melzner F, Po¨rtner HO, Meier S (2010) Cuttlebone calcification increases during exposure to elevated seawater pCO2in the cephalopodSepia officinalis. Mar Biol 157: 1653–1663.
44. Arkhipkin AI, Bizikov VA (2000) Role of the statolith in functioning of the acceleration receptor system in squids and sepioids. J Zool 250: 31–55. 45. Arnold JM, Williams-Arnold LD (1976) The Egg Cortex Problem as Seen
Through the Squid Eye. Amer Zool 16: 421–446.
46. Colmers WF, Hixon RF, Hanlon RT, Forsythe JW, Ackerson MV, et al. (1984) ‘‘Spinner’’ cephalopods: defects of statocyst suprastructures in an invertebrate analogue of the vestibular apparatus. Cell Tissue Res 236: 505–515. 47. NMFS (2011) 51st
Northeast regional stock assessment workshop (51st
SAW): Assessment summary report (2nd Edition).
48. Villanueva R (2000) Effect of temperature on statolith growth of the European squidLoligo vulgarisduring early life. Mar Biol 136: 449–460.
49. Holcomb M, McCorkle DC, Cohen AL (2010) Long-term effects of nutrient and CO2enrichment on the temperate coralAstrangia poculata(Ellis and Solander,
1786). J Exp Mar Bio Ecol 386: 27–33.
50. Maxwell MR, Hanlon RT (2000) Female reproductive output in the squidLoligo pealeii: multiple egg clutches and implications for a spawning strategy. Mar Ecol Prog Ser 199: 159–170.
51. Buresch KC, Maxwell MR, Cox MR, Hanlon RT (2009) Temporal dynamics of mating and paternity in the squidLoligo pealeii. Mar Ecol Prog Ser 387: 197–203. 52. Buresch K, Hanlon R (2001) Microsatellite DNA markers indicate a high frequency of multiple paternity within individual field-collected egg capsules of the squidLoligo pealeii. Mar Ecol Prog Ser 210: 161–165.
53. Clayton TD, Byrne RH (1993) Spectrophotometric seawater pH measurements: total hydrogen results. Deep Sea Res Part 1 40: 2115–2129.
54. Dickson AG, Sabine CL, Christian JR (2007) Guide to Best Practices for Ocean CO2Measurements. 175 p.
55. Pierrot D, Lewis E, Wallace DWR (2006) MS Excel Program Developed for CO2System Calculations. Oak Ridge, Tennessee: Carbon Dioxide Information
Analysis Center, Oak Ridge National Laboratory, U.S. Department of Energy. 56. Lewis E, Wallace DWR (1998) Program Developed for CO2 System
Calculations. ORNL/CDIAC-105. Oak Ridge, Tennessee: Carbon Dioxide Information Analysis Center, Oak Ridge National Laboratory, U.S. Depart-ment of Energy.
57. Mehrbach C, Culberson CH, Hawley JE (1973) Measurement of the apparent dissociation constants of carbonic acid in seawater at atmospheric pressure. Limnol Oceanogr 18: 897–907.
58. Dickson AG, Millero FJ (1987) A comparison of the equilibrium constants for the dissociation of carbonic acid in seawater media. Deep Sea Res A 34: 1733– 1743.
59. Dickson AG (1990) Standard potential of the reaction: AgCl(s)+1/2 H2(g) =
Ag(s)+HCl (aq), and the standard acidity constant of the ion HSO42in synthetic sea water from 273.15 to 318.15 K. J Chem Thermodyn 22: 113–127. 60. Mucci A (1983) The solubility of calcite and aragonite in seawater at various salinities, temperatures, and one atmosphere total pressure. Am J Sci 283: 781– 799.
61. Vidal EAG, Dimarco FP, Wormuth JH, Lee PG (2002) Influence of Temperature and Food Availability on Survival, Growth and Yolk Utilization in Hatchling Squid. Bull Mar Sci 71: 915–931.
62. Huxham M, Kimani E, Newton J, Augley J (2007) Stable isotope records from otoliths as tracers of fish migration in a mangrove system. Journal of Fish Biology 70: 1554–1567.
63. Marshall AT, Wright A (1998) Coral calcification: autoradiography of a scleractinian coral Galaxea fascicularis after incubation in 45 Ca and 14 C. Coral Reefs 17: 37–47.
64. Smith LW, Barshis D, Birkeland C (2007) Phenotypic plasticity for skeletal growth, density and calcification ofPorites lobatain response to habitat type. Coral Reefs 26: 559–567.
65. Roger LM, Richardson AJ, McKinnon AD, Knott B, Matear R, et al. (2012) Comparison of the shell structure of two tropical Thecosomata (Creseis aciculaand
Diacavolinia longirostris) from 1963 to 2009: potential implications of declining aragonite saturation. ICES J Mar Sci 69: 465–474.
66. Rosa R, Pimentel MS, Boavida-Portugal J, Teixeira T, Tru¨benbach K, et al. (2012) Ocean warming enhances malformations, premature hatching, metabolic suppression and oxidative stress in the early life stages of a keystone squid. PloS One 7: e38282–e38282.
67. Arkhipkin AI, Seibel BA (1999) Statolith microstructure from hatchlings of the oceanic squid, Gonatus onyx (Cephalopoda, Gonatidae) from the Northeast Pacific. J Plankton Res 21: 401–404.
68. Arkhipkin AI (2005) Statoliths as ‘black boxes’ (life recorders) in squid. Mar Freshw Res 56: 573–583.
69. Clarke MR (1978) The Cephalopod Statolith – An Introduction To Its Form. J Mar Biol Assoc UK 58: 701–712.
70. Caldeira K, Wickett ME (2005) Ocean model predictions of chemistry changes from carbon dioxide emissions to the atmosphere and ocean. J Geophys Res 110: 1–12.
71. McCorkle DC, Weidman C, Cohen AL (2012) Time series of pCO2, pH and
aragonite saturation state in Waquoit Bay National Estuarine Research Reserve. Ocean Sciences. Salt Lake City, UT.
72. Feely RA, Alin SR, Newton J, Sabine SL, Warner M, et al. (2010) The combined effects of ocean acidification, mixing, and respiration on pH and carbonate saturation in an urbanized estuary. Estuar Coast Shelf Sci 88: 442– 449.
73. Cai W, Hu X, Huang W, Murrell MC, Lehrter JC, et al. (2011) Acidification of subsurface coastal waters enhanced by eutrophication. Nat Geosci 4: 766–770. 74. Wang ZA, Wanninkhof R, Cai WJ, Byrne RH, Hu X, et al. (2013) The marine inorganic carbon system along the Gulf of Mexico and Atlantic coasts of the United States: Insights from a transregional coastal carbon study. Limnol Oceanogr 58: 325–342.
75. Hatfield EMC, Cadrin SX (2002) Geographic and temporal patterns in size and maturity of the longfin inshore squid (Loligo pealeii) off the northeastern United States. Fish Bull 100: 200–213.
76. Rosa R, Seibel BA (2008) Synergistic effects of climate-related variables suggest future physiological impairment in a top oceanic predator. Proc Natl Acad Sci USA 105: 20776–20780.
77. Findlay HS, Kendall MA, Spicer JI, Widdicombe S (2009) Future high CO2in
the intertidal may compromise adult barnacleSemibalanus balanoidessurvival and embryonic development rate. Mar Ecol Prog Ser 389: 193–202.
78. Walther K, Anger K, Po¨rtner H (2010) Effects of ocean acidification and warming on the larval development of the spider crabHyas araneusfrom different latitudes (54uvs. 79uN). Mar Ecol Prog Ser 417: 159–170.
79. Bailey KM (1984) Comparison of laboratory rates of predation of five species of marine fish larvae by three planktonic invertebrates: effects of larval size on vulnerability. Mar Biol 79: 303–309.
80. Andersen JT (1988) A review of size dependent survival during pre-recruit stages of fished in relation to recruitment. J Northwest Atl Fish Sci 8: 55–66. 81. Leis JM, Carson-Ewart BM (1997)In situswimming speeds of the late pelagic
larvae of some Indo-Pacific coral-reef fishes. Mar Ecol Prog Ser 159: 165–174. 82. Paulsen H, Kjesbu O, Buehler V, Case R, Clemmesen C, et al. (2009) Effects of egg size, parental origin and feeding conditions on growth of larval and juvenile codGadus morhua. J Fish Biol 75: 516–537.
83. Laine P, Rajasilta M (1999) The hatching success of Baltic herring eggs and its relation to female condition. J Exp Mar Bio Ecol 237: 61–73.
84. McCormick MI (2003) Consumption of Coral Propagules after Mass Spawning Enhances Larval Quality of Damselfish through Maternal Effects. Oecologia 136: 37–45.
85. Steer MA, Moltschaniwskyj NA, Nichols DS, Miller M (2004) The role of temperature and maternal ration in embryo survival: using the dumpling squid
Euprymna tasmanicaas a model. J Exp Mar Bio Ecol 307: 73–89.
86. Ries JB, Cohen AL, McCorkle DC (2010) A nonlinear calcification response to CO2-induced ocean acidification by the coralOculina arbuscula. Coral Reefs 29:
661–674.
87. Krief S, Hendy EJ, Fine M, Yam R, Meibom A, et al. (2011) Physiological and isotopic responses of scleratinian corals to ocean acidification. Geochim Cosmochim Ac.
88. Lipinski MR, Durholtz MD (1994) Problems associated with ageing squid from their statoliths: towards a more structured approach. Antarct Sci 6: 215–222. 89. Recksiek CW, Frey HW (1978) Biological, oceanographic and acoustic aspects of
the market squid,Loligo opalescensBerry. California Department of Fish and Game.
hyadesi(Teuthoidea: Ommastrephidae) at the Antarctic Polar Frontal Zone and on the Patagonian Shelf Edge. Antarct Sci 6: 259–267.
91. Kristensen TK (1980) Periodical growth rings in cephalopod statoliths. Dana 1: 39–51.
92. Hanlon RT, Bidwell JP, Tait R (1989) Strontium is required for statolith development and thus normal swimming behaviour of hatchling cephalopods. J Exp Biol 141: 187–195.
93. Mooney TA, Hanlon RT, Christensen-Dalsgaard J, Madsen PT, Ketten DR, et al. (2010) Sound detection by the longfin squid (Loligo pealeii) studied with auditory evoked potentials: sensitivity to low-frequency particle motion and not pressure. J Exp Biol 213: 3748–3759.
94. Hanlon RT, Messenger JB (1996) Cephalopod Behavior. New York, NY: Cambridge University Press.
95. Gilly WF, Markaida U, Baxter CH, Block BA, Boustany A, et al. (2006) Vertical and horizontal migrations by the jumbo squid Dosidicus gigas revealed by electronic tagging. Mar Ecol Prog Ser 324: 1–17.
96. Rosa R, Seibel BA (2010) Metabolic physiology of the Humboldt squid,Dosidicus gigas: Implications for vertical migration in a pronounced oxygen minimum zone. Prog Oceanogr 86: 72–80.