in focus
TRANSPORT
THEME 7 - 3/2000
C o n t e n t s
Fewer road deaths despite
more traffic
1
Death rate lowest in Sweden
and in the United Kingdom
2
Breakdown of persons killed in
road accidents in 1997
3
Rail fatalities low, variable from
year to year
5
Deaths per thousand million
pkm travelled
6
100 000
80 000
60 000
40 000
20 000
-Transport safety
Carine Collin
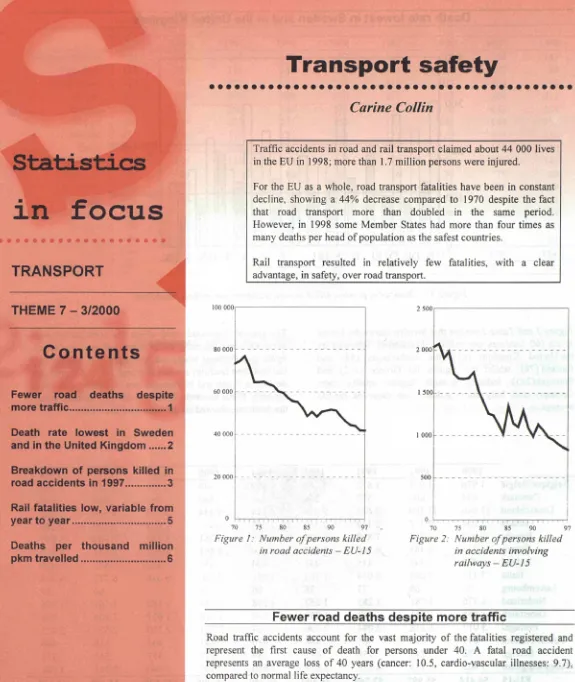
Traffic accidents in road and rail transport claimed about 44 000 lives
in the EU in 1998; more than 1.7 million persons were injured.
For the EU as a whole, road transport fatalities have been in constant
decline, showing a 44% decrease compared to 1970 despite the fact
that road transport more than doubled in the same period.
However, in 1998 some Member States had more than four times as
many deaths per head of population as the safest countries.
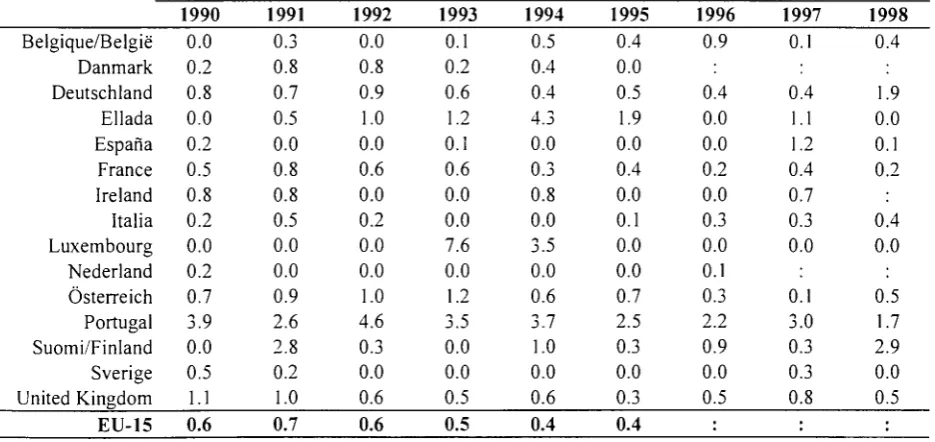
Rail transport resulted in relatively few fatalities, with a
advantage, in safety, over road transport.
clear
2
5002
0001500
I
000-
L■
¡
[image:1.595.11.586.14.696.2]70 75 80 85 90
Figure 1 : Number of persons killed
in road accidents — EU-15
70
75
80
85
90
97
Figure 2: Number of persons killed
in accidents involving
railways — EU-15
■
Fewer road deaths despite more traffic
Manuscript completed on: 06.06.2000
ISSN 1562-1324
Catalogue number: CA-NZ-OO-003-EN-C
Price in Luxembourg per single copy
(excl. VAT): EUR 6
© European Communities, 2000
Road traffic accidents account for the vast majority of the fatalities registered and
represent the first cause of death for persons under 40. A fatal road accident
represents an average loss of 40 years (cancer: 10.5, cardio-vascular illnesses: 9.7),
compared to normal life expectancy.
A large number of measures for increased road safety have been taken in the past
on Community, national and local level. Improved road design, changes in legislation
on drink-driving, higher safety-standards of vehicles, introduction of speed limits,
stricter rules on truck and bus driving times, better monitoring of the roadworthiness
of vehicles have considerably reduced the number of road transport related fatalities,
despite the constant increase of traffic.
Death rate lowest in Sweden and in the United Kingdom
300
200
100
n
1-1-1-1
-,
ρ.
- i
|-
1-1EU-15 1970
EU-15 1997
Β DK D EL E
F IRL I
L NL A Ρ FIN S UK
□ 1970 [=11997
[image:2.595.146.486.73.301.2]Figure 3:
Number of persons killed in road accidents per million inhabitants
Figure 3
and
Table 2
outline that Sweden shows the lowest
levels (60 fatalities per million inhabitants), followed by
the United Kingdom (61), the Netherlands (68) and
Finland (78), whilst the figures for Greece (212) and
Portugal (243) indicate a much higher fatality rate.
Germany and Italy show a death rate close to the EU
averaae.
The general downward trend which has been predominant
in the EU since the early 1970s is not followed by Greece,
Spain and Portugal where car ownership has grown very
fast and road fatalities are still at a high level. A significant
decline in Spain and in Portugal was registered only from
the early 1990s onwards. Greece is the only country where
the death rate showed no decrease over the 1990s.
Belgique/België
Danmark
Deutschland
Ellada
España
France
Ireland
Italia
Luxembourg
Nederland
Österreich
Portugal
Suomi/Finland
Sverige
United Kingdom
EU-15
Index 1990=100
1990
1976
634
11 046
2 050
9 032
11215
478
7 137
71
1376
1558
3 017
649
772
5 402
56 414
100
1991
1 873
606
11300
2 112
8 836
10 483
445
8 083
80
1281
1 551
3218
632
745
4 753
55 997
99
1992
1 672
577
10 631
2 158
7818
9 900
415
8014
73
1285
1403
3 084
601
759
4 379
52 769
94
1993
1660
559
9 949
2 159
6 378
9 867
431
7 163
78
1252
1 283
2 700
484
632
3 814
48 409
86
1994
1692
546
9 814
2 253
5 615
9019
404
7 091
66
1298
1338
2 504
480
589
3 650
46 359
82
1995
1449
582
9 454
2411
5 751
8 891
437
7 020
70
1 334
1210
2711
441
572
3 765
46 098
82
1996
1 356
514
8 758
2 068
5 483
8 541
453
6 676
71
1 180
1 027
2 730
404
537
3 740
43 538
77
1997
1 364
489
8 549
2 199
5 604
8 444
472
6712
60
1 163
1 105
2 521
438
541
3 741
43 402
77
1998
1 500
449
7 792
2 226
5 957
8918
429
6314
57
1 066
963
2 425
400
531
3 581
42 608
[image:2.595.37.567.476.711.2]76
Table 1: Number of persons killed in road accidents
Β
Statistics in focus
— Theme
7 —
3/2000 ·
m
Belgique/België
Danmark
Deutschland
Ellada
Espana
France
Ireland
Italia
Luxembourg
Nederland
Osterreich
Portugal
Suomi/Finland
Sverige
United Kingdom
EU-15
Index 1990=100
1990
198
123
139
202
232
198
136
126
186
92
202
305
130
90
94
155
100
1991
187
118
141
206
227
184
126
142
207
85
199
326
126
86
82
153
99
1992
166
112
132
209
200
173
117
141
186
85
177
313
119
88
75
143
93
1993
165
108
123
208
163
171
121
126
196
82
161
273
96
72
66
131
85
1994
167
105
121
216
143
156
113
124
163
84
167
253
94
67
63
125
81
1995
143
111
116
231
147
153
121
123
171
86
150
273
86
65
64
124
80
1996
134
98
107
197
140
146
125
116
171
76
127
275
79
61
64
117
75
1997
134
93
104
209
143
144
129
117
143
75
137
253
85
61
64
116
75
1998
[image:3.595.40.578.56.296.2]147
85
95
212
151
152
116
110
143
68
119
243
78
60
61
114
73
Table 2: Number of persons killed in road accidents per million inhabitants
Breakdown of persons killed in road accidents in 1997
There were more drivers killed (63.6%) than any other type
of road user.
Younger drivers (less than 34 years) are particularly
vulnerable (40.6% of all drivers killed) and more than
a quarter (25.7%) of those were in the under 25 age group.
Pedestrians, particularly older pedestrians (aged 65 and
over), remain very much at risk from death on the roads.
In 1997, 44.0% of pedestrians killed were aged 65 and over.
15.3%
6.0%
□ Pedestrians
■ Drivers and passengers of cycles, mopeds and motor cycles
Ξ Drivers and passengers of passenger cars
□ Other drivers and passengers
Figure 4: Breakdown of persons killed in road accidents
by category of user in 1997 - EU-15
[image:3.595.208.410.461.690.2]%
26.2
11.3
18.8
20.4
15.9
14.5
12.4"
12.8
10.3
19.1
9,3
10.9
15.8
2.3
<10
10-24 25-34
35-44
45-54
55-64
>65
□ Persons killed in road accidents □Population
Figure 5: Breakdown of persons killed in road accidents
and population by age group in 1997 - EU-15
In general, road accidents are more likely to occur
on roads in built-up urban areas. However, fatal
accidents happen much more likely on the faster
roads (68.6%).
Most accidents occur towards the end of the week,
on Fridays (14.7%), on Saturdays (16.9%) and
on Sundays (16.6%).
In 1997, the majority (74.9%) of fatal accidents
occurred when the road surface was dry and more
than half (57.3%) in daylight.
33.8%
14.5%
51.7%
Figure 6: Breakdown of persons killed in road accidents
by type of accident in 1997 - EU-15
All accidents
24.6%
44.3%
Figure 7: Breakdown of persons killed in road accidents
by type of accident in 1997
-
EU-15
Inside built-up areas
Statistics in f o c u s
— Theme 7 — 3/2000 ·
[image:4.595.178.459.56.251.2] [image:4.595.366.521.438.597.2] [image:4.595.108.275.439.605.2]Rail fatalities low, variable from year to year
The situation differs for accidents linked to railways.
At EU level, the absolute number of deaths fluctuated around
1 000 victims per year since 1990. A slight decrease can be
observed in recent years, although strong fluctuations exist
between individual years. This is particularly visible
in
Table 3,
where the number of fatalities per country is
presented.
Table 4
indicates that only a minority of victims are
passengers travelling in trains. Most fatalities are registered in
accidents occurring at railway level crossings (victims
travelling in road vehicles are counted here as rail accident
victims), accidents during shunting procedures and track
maintenance works, without however claiming victims among
the passengers travelling in this transport mode. This should
be taken into account when looking at
Figure 2
and
Figure 8
where these victims are considered.
Accidents in rail transport do not occur very frequently,
especially in small countries. Thus, statistics fluctuate strongly
and limit the comparability of modes. Moreover, in some
cases the definition of'accidents' and 'injured persons' differs
between countries and comparison of statistics should be done
carefully.
Belgique/België
Danmark
Deutschland
Ellada
España
France
Ireland
Italia
Luxembourg
Nederland
Osterreich
Portugal
Suomi/Finland
Sverige
United Kingdom
EU-15
index 1990=100
EU-15 per mio inhab.
Belgique/België
Danmark
Deutschland
Ellada
España
France
Ireland
Italia
Luxembourg
Nederland
Österreich
Portugal
Suomi/Finland
Sverige
United Kingdom
EU-15
index 1990=100
EU-15 per mio inhab.
[image:5.595.24.576.224.469.2]1990
20
6
250
34
30
188
14
83
2
43
54
131
36
18
78
987
100
2.7
1990
0
1
50
0
4
30
1
9
0
2
6
22
0
->
5
37
165
100
0.5
1991
18
13
304
50
30
222
11
96
4
39
76
139
34
26
68
1130
114
3.1
Table 3: Number
1991
2
4
42
1
0
47
1
24
0
0
8
15
9
1
31
185
112
0.5
1992
22
16
325
28
30
203
11
116
1
34
31
148
31
29
39
1064
108
2.9
of persons
1992
0
4
54
2
0
38
0
8
0
0
10
26
1
0
18
161
98
0.4
1993
23
8
283
61
32
171
3
86
4
35
66
132
20
19
40
983
100
2.7
killed in
1993
1
1
35
2
1
34
0
0
2
0
11
19
0
0
16
122
74
0.3
1994
30
9
272
42
31
150
11
83
5
35
52
149
30
11
42
952
96
2.6
1995
20
10
275
49
22
129
7
120
3
49
68
95
17
9
28
901
91
2.4
accidents involving railways
1994
3
2
26
6
0
20
1
0
1
0
6
19
->
j0
17
104
63
0.3
1995
3
0
34
3
0
22
0
4
0
0
7
12
1
0
10
96
58
0.3
1996
26
252
42
21
136
8
106
3
36
47
122
12
17
25
1996
6
25
0
0
14
0
14
0
1
3
10
3
0
17
1997
18
235
43
37
117
14
98
3
23
119
21
11
48
1997
1
28
2
20
22
1
16
0
1
14
1
2
26
1998
30
225
47
13
138
97
1
35
97
24
17
36
1998
3
114
0
1
14
16
0
4
8
10
0
18
Table 4: Number of railway passengers killed in accidents involving railways
[image:5.595.23.575.500.749.2]Deaths per thousand million pkm travelled
Figure 8
(EU-15),
Table 5
and
Table 6
(by Member
State) outline the number of deaths per thousand
million passenger-kilometre (pkm) travelled. It should
be noted that for the road data, pedestrians and cyclists
killed by passenger cars are included.
These data demonstrate the continuing advantage of rail
transport, which has about one-twentieth of the number
of passenger deaths per passenger-kilometre, compared
to road transport.
However, there has been a proportionately greater
reduction in road deaths than in rail deaths over the
period 1970-1997.
70 75 80 8591)
95 97Figure 8: Deaths per 1 000 mio pkm
EU-15
Belgique/België
Danmark
Deutschland
Ellada
España
France
Ireland
Italia
Luxembourg
Nederland
Österreich
Portugal
Suomi/Finland
Sverige
United Kingdom
EU-15
Belgique/België
Danmark
Deutschland
Ellada
España
France
Ireland
Italia
Luxembourg
Nederland
Österreich
Portugal
Suomi/Finland
Sverige
United Kingdom
[image:6.595.78.548.291.516.2]EU-15
1990
22
11
14
31
31
17
22
12
16
9
22
40
11
8
8
15
1990
0.0
0.2
0.8
0.0
0.2
0.5
0.8
0.2
0.0
0.2
0.7
3.9
0.0
0.5
1.1
0.6
1991
20
10
15
31
29
16
19
13
17
9
20
41
11
7
7
15
Table 5:
1991
0.3
0.8
0.7
0.5
0.0
0.8
0.8
0.5
0.0
0.0
0.9
2.6
2.8
0.2
1.0
0.7
1992
17
10
13
31
24
15
17
12
15
8
18
37
10
8
7
14
Deaths per
1992
0.0
0.8
0.9
1.0
0.0
0.6
0.0
0.2
0.0
0.0
1.0
4.6
0.3
0.0
0.6
0.6
1993
17
9
12
30
19
14
17
10
16
8
16
29
8
6
6
12
/
000 millior
1993
0.1
0.2
0.6
1.2
0.1
0.6
0.0
0.0
7.6
0.0
1.2
3.5
0.0
0.0
0.5
0.5
1994
17
9
12
30
16
13
15
10
13
8
17
24
8
6
6
12
pkm in
1994
0.5
0.4
0.4
4.3
0.0
0.3
0.8
0.0
3.5
0.0
0.6
3.7
1.0
0.0
0.6
0.4
1995
14
9
12
31
16
12
15
10
14
8
15
24
8
6
6
11
road acci
1995
0.4
0.0
0.5
1.9
0.0
0.4
0.0
0.1
0.0
0.0
0.7
2.5
0.3
0.0
0.3
0.4
1996
13
8
11
25
15
12
15
9
14
7
13
23
7
5
6
11
dents
1996
0.9
0.4
0.0
0.0
0.2
0.0
0.3
0.0
0.1
0.3
2.2
0.9
0.0
0.5
:
1997
13
7
11
26
15
11
14
9
11
7
14
21
7
5
6
10
1997
0.1
0.4
1.1
1.2
0.4
0.7
0.3
0.0
0.1
3.0
0.3
0.3
0.8
:
1998
14
6
10
25
15
12
13
9
10
6
12
19
7
5
5
10
1998
0.4
1.9
0.0
0.1
0.2
0.4
0.0
0.5
1.7
2.9
0.0
0.5
Table 6: Deaths of railway passengers killed per I 000 million pkm in accidents involving railways
Statistics in focus
— Theme 7 — 3/2000 ■
m
[image:6.595.80.548.538.759.2]> ESSENTIAL INFORMATION - METHODOLOGICAL NOTES
Number
of persons killed
in road
accidents
Persons killed are all persons killed within 30 days of the accident. For Member States not using this definition [Greece (3 days up to 1995), Spain (1 day up to 1992),
France (6 days), Italy (7 days), Austria (3 days up to 1991) and Portugal (1 day)] corrective factors were applied (Greece 1.18, Spain 1.3, France 1.09 up to 1993 and
1.057 from 1994, Italy 1.078, Austria 1.12 and Portugal 1.3).
Category of user
Driver:
Any person who drives a motor vehicle or other vehicle (including a cycle), or who guides cattle, singly or in herds, or flocks, draught, pack or
saddle animals on a road.
Passenger: Any person, other than the driver, who is in or on a vehicle.
Pedestrian: Any person other than a driver or a passenger according to the above definitions. Persons pushing or pulling a child's carriage, a bath chair or
invalid chair, or any other small vehicle without an engine, or pushing a cycle or moped, and handicapped persons travelling in invalid chairs
propelled by such persons or moving at walking pace shall be treated as pedestrians.
Cycle: Any road vehicle which has at least two wheels and is propelled solely by the muscular energy of the person(s) on that vehicle, in particular by
means of a pedal system, lever or handle (e.g. bicycles, tricycles, quadricycles and invalid carriages).
Moped: Any two-wheeled or three-wheeled road vehicle which is fitted with an internal combustion engine having a cylinder capacity not exceeding 50
cc.(3.05 cu. in.) and a maximum design speed not exceeding 50km (30 miles) per hour.
Motor cycle: Two-wheeled road motor vehicle with or without side-car, including motor scooter, or three-wheeled road motor vehicle not exceeding 400kg
(900 lb) unladen weight. This term does not include mopeds.
Passenger car: P.oad meter vehicle, other than a motor cy;!·.·, intended for the transport of passengers and seating not more than nine persons (including the
driver). The term "passenger car" therefore covers taxis and hired vehicles, provided that they have fewer than ten seats.
Accidents between vehicle and pedestrian:
Single vehicle accidents:
Accidents between vehicles:
All accidents:
Built-up area:
Type of accident
Accidents involving one or several vehicles and pedestrians irrespective of whether the pedestrian was involved in
the first or a later phase of the accident and whether the pedestrian was injured or killed on or off the road.
Accidents involving no collision with other road users, even through the may be involved, i.e., vehicle trying to
avoid collision and veering off the road, or accidents caused by collision with obstructions or animals on the road.
Collisions with parked vehicles belong to the next type.
Remainder of the two previous types.
Accidents occurred on motorways, inside built-up areas and outside built-up areas.
An area with entries and exits especially sign-posted
as
such.
Data not adjusted for different definitions of deaths (see above).
Figure 1 & Figure 3
Railwavs
Persons killed are all persons killed within 30 days of the accidenti (definition not applied by all Member States).
Deaths per 1 000 million pkm travelled
Road: Passenger-kilometre performed by passenger cars, buses and coaches are taken into consideration.
Sources
Road: Eurostat/UN-ECE/ECMT
Rail: Eurostat/UN-ECE/ECMT/UIC
Tables 3. 4 and 6:
United Kingdom: National statistics
Figure 2 and Figure 8 (for rail and railway
passengers):
EU-15 total for 1996 and 1997 are
estimated
Symbols a
%
1990=100
ECMT
EU
EU-15
nd abbreviations
Per cent
Not available
Reference year
European Conference of Ministers
ofTrasnport
European Union
European Union of 15 Member
States
Eurostat
inhab.
mio
pkm
UIC
UN-ECE
Statistical Office of the European
Communities
Inhabitants
Million
Passenger-kilometre
Internationa Union of Railways
United Nations - Economic
Commission for Europe
Further information:
>
Databases
New Cronos Theme 7
Domain Rail, collection RAACCIDT
Domain Road, collection ROACCIDT
To obtain information or to order publications, databases and special sets of data, please contact the
Data Shop
network:
B E L G I Q U E / B E L G I Ë D A N M A R K D E U T S C H L A N D E S P A N A F R A N C E I T A L I A - R o m a Eurostal Data Shop
Pianistit Belgique 124 Rue du Commerce Handelsstraat 124
B-1000 BRUXELLES/BRUSSEL
Tel. (32-2) 234 67 50
Fax (32-2) 234 67 51 E-Mail: datashopgplanistatbe
DANMARKS STATISTIK Bibliotek og Information Eurostat Data Shop Sejrøgade 11 DK-2100 KØBENHAVN 0 Tel. (45-39)17 30 30 Fax (45-39) 17 30 03 E-Mail: bibgdstdk
STATISTISCHES BUNDESAMT Eurostat Data Shop Berlin Otto-Braun-Straße 70-72 D-10178 BERLIN Tel. (49-30) 23 24 64 27/28 Fax (49-30) 23 24 64 30 E-Mail:
dalashop@stafstik-bund.de
INE Eurostat Data Shop Paseo de la Castellana, 183 Oficina 009
Entrada por Estèbanez Calderón E-28046 MADRID Tel. (34-91) 583 91 67 Fax (34-91) 579 71 20
INSEE Info Service Eurostat Data Shop 195, rue de Bercy Tour Gamma A F-75582 PARIS CEDEX 12 Tel. (33-1) 53 17 88 44 Fax (33-1) 53 17 88 22 E-Mail: datashop eurostat@ine.es E-Mail: datasrtop@insee.fr
ISTAT
Centro di Informazione Statistica Sede di Roma, Eurostat Data Shop Via Cesare Balbo, 11a 1-00184 ROMA Tel. (39-06) 46 73 31 02/06 Fax (39-06) 46 73 31 01/07 E-Mail: dipdiff@istat.it
I T A L I A - M i l a n o
LUXEMBOURG
NEDERLAND
NORGE
PORTUGAL
S C H W E I Z / S U I S S E / S V I Z Z E R A ISTATUfficio Regionale per la Lombardia Eurostat Data Shop
Via Reno 3 1-20123 MILANO Tel. (39-02) 8061 32460 Fax (39-02) 8061 32304 E-mail: mileuro@tin.it
Eurostat Data Shop Luxembourg BP453
L-2014 LUXEMBOURG 4, rue A. Weicker L-2721 LUXEMBOURG Tel. (352) 43 35 22 51 Fax (352) 43 35 22 221 E-Mail: dslux@eurostaldatashop.lu
STATISTICS NETHERLANDS Eurostat Data Shop-Voorburg pò box 4000
2270 JM VOORBURG Nederìand
Tel. (31-70)337 49 00
Fax (31-70) 337 59 84 E-Mail: datashop@cbs.nl
Statistics Norway Library and Information Centre Eurostat Data Shop Kongens gate 6 P. b. 8131. dep. N-0033 OSLO
Tel. (47-22)864643
Fax (47-22) 86 45 04 E-Mail: datashop@ssb.no
Eurostat Data Shop Lisboa INEIServiço de Difusão Av. António José de Almeida. 2 Ρ-1000-043 LISBOA Tel. (351-21)84261 00 Fax (351-21 ) 842 63 64 E-Mail: data.shop@ine.pt
Statistisches Amt des Kantons Zürich, Eurostat Data Shop Bleicherweg 5 CH-8090 Zürich Tel. (41-1)2251212 Fax (41-1) 225 12 99 E-Mail: datashop@zh.ch Internetadresse: http://www.zh.ch/statistik S U O M I / F I N L A N D S V E R I G E U N I T E D K I N G D O M U N I T E D K I N G D O M U N I T E D S T A T E S O F A M E R I C A
Eurostat Data Shop Helsinki Tilasto kirjasto Postiosoite: PL 2B
Käyntiosoite: Tyópajakatu 13 Β, 2 krs FIN-00022 Tilastokeskus Tel. (358-9) 17 34 22 21 Fax (358-9) 17 34 22 79
S-posti datashcp tìtastc*eskus@lil3stokeikus fi internetadresse
Http JHHH flastokeskus MkAk/dKashop.hort
STATISTICS SWEDEN Information service Eurostat Data Shop Karlavägen 100-Box 24 300 S-104 51 STOCKHOLM Tel. (46-8)50 69 48 01
Fax (46-8) 50 69 48 99
E-Mail: infoservice@scb.se URL: htJpt/Vwww.scb.se/tnfo/datashop/ eudatashop.asp
Eurostat Data Shop Enquiries & advice and publications
Office for National Statistics Customers & Electronic Services Unit 1 Drummond Gate-B1/05 UK-LONDON SW1V2QQ Tel. (44-171)533 56 76 Fax (44-1633) 812 762 E-Mail eurostatdatashop@ons.gov.uk
Eurostat Data Shop Electronic Data Extractions, Enquiries & advice · R.CADE Unit 1L Mountjoy Research Centre University of Durham UK - DURHAM DH1 3SW Tel: (44-191) 374 7350 Fax: (44-191) 3844971 E-Mail: r-cadeloidur.ac.uk URL hHpï/www-rcade.dur.ac.uk
HAVER ANALYTICS Eurostat Data Shop 60 East 42nd Street Suite 3310
USA-NEW YORK, NY 10165 Tel. (1-212)986 93 00 Fax (1-212) 986 58 57 E-Mail: eurodata@haver.com Media Support Eurostat (for professional journalists only).
Bech Building Office A3/48 · L-2920 Luxembourg · Tel. (352) 4301 33408 · Fax (352) 4301 32649 · e-mail: eurostat-mediasupport@cec.eu.int
For information on methodology
Carine Collin, Eurostat/C2, L-2920 Luxembourg, Tel. (352) 4301 35074, Fax (352) 4301 32289, E-mail: Carine.Collin@cec.eu.int
ORIGINAL: English
Please visit our web site at www.europa.eu.int/comm/eurostat/ for further information!
A list of worldwide sales outlets is available at the Office for Official Publications of the European Communities.
2 rue Mercier - L-2985 Luxembourg
Tel. (352) 2929 42118 Fax (352) 2929 42709
Internet Address http:iieur-op.eu .¡nt/fr/generatJs-ad.htm e-mail: info.info@cec.eu.int
BELGIQUE/BELGIE - DANMARK - DEUTSCHLAND - GREECEÆLLADA - ESPAÑA - FRANCE - IRELAND - ITALIA - LUXEMBOURG - NEDERLAND - OSTERREICH PORTUGAL - SUOMI/FINLAND - SVERIGE - UNITED KINGDOM - ¡SLAND - NORGE - SCHWEIZ/SUISSE/SVIZZERA - BALGARIJA - CESKÁ REPUBLIKA - CYPRUS EESTI - HRVATSKA - MAGYARORSZAG - MALTA - POLSKA - ROMANIA - RUSSIA - SLOVAKIA - SLOVENIA - TURKIYE - AUSTRALIA - CANADA - EGYPT - INDIA ISRAEL - JAPAN - MALAYSIA - PHILIPPINES - SOUTH KOREA - THAILAND - UNITED STATES OF AMERICA