The Evolution of Edge Vortices Underneath a Diffuser Equipped Bluff Body
by
S. Mahon (1), X. Zhang (2) and C. Gage
School of Engineering Sciences,
University of Southampton,
Southampton, SO17 1BJ, UK
(1)E-Mail: [email protected] (2)
E-Mail: [email protected]
ABSTRACT
NOMENCLATURE
CD =
CL =
d =
coefficient of drag, D/q8S coefficient of downforce, L/q8S model half -width, 0.157m
D h hr
l L q8
= = = = = =
drag force
height of model, 0.324m ride height
length of model, 1.315m downforce
freestream dynamic pressure, ?8U82/2
Re = Reynolds number, ?U8l/µ
S = frontal area of the model
U8 = freestream streamwise velocity
u, v,w = streamwise, vertical and spanwise components of velocity
x,y,z = cartesian coordinates: x +ve downstream, y +ve up, z +ve to port
µ = viscosity
? = density
? = vorticity, dv/dx-dw/dy
O = non-dimensional vorticity, ?d/U8
? = diffuser expansion angle
1. INTRODUCTION
The performance of modern cars, both on the road and the racetrack, is strongly influenced by aerodynamics. Modern racing cars are designed to maximise the amount of negative lift (downforce) produced working in conjunction with the mechanical grip, to improve the acceleration, braking, and cornering speed of the car. Many aerodynamic devices are deployed to achieve this goal, the most obvious being inverted wings mounted at the front and rear of the car. Although less visible, shaping of the underside of the car is responsible for a large percentage of the total downforce generated.
There exists a lack of previous investigations into diffuser equipped bluff bodies. In 1981 Frost (Frost, 1981) investigated a bluff body with a rear diffuser in ground effect. Ramp angles of up to 20° were investigated without diffuser endplates. The flow visualisation indicated that the vortex formation occurred by the flow “rolling” around the side of the body to the underside of the ramp. This is obviously fundamentally different to diffusers with end fences, as the end fences would have prevented this flow pattern and method of vortex formation. Increasing the ramp angle had the effect of increasing the strength of the vortices. When the diffuser angle was increased to 20°, the vortices were no longer symmetric, but no breakdown occurred, and no flow separation was seen from the ramp surface. George (George, 1981) performed a similar study to Frost, and also concluded that the vortices prevented flow separation in the diffuser ramp. He went on to suggest that mounting vortex generators on the diffuser ramp would maintain vortex flow at low speeds, increasing the diffuser performance in conditions that would usually lead to vortex breakdown. This is outside the scope of the current investigation.
downforce was found to be produced when using a diffuser less than half the length of the bluff body, demonstrating that short diffusers provide the best performance. The lower the ramp angle, the shorter the diffuser ramp required for peak performance.
Most recently the investigations of Senior & Zhang (Senior and Zhang, 2001) and Ruhrmann & Zhang (Ruhrmann and Zhang, 2003) investigated a diffuser equipped bluff body in ground effect with end fences. Senior & Zhang observed the presence of two counter-rotating vortices that were recorded in previous studies (Cooper et al., 1998; Cooper et al., 2000). As in other s tudies, these vortices remained attached to the diffuser ramp, however the flow was seen to detach from the ramp surface just before the diffuser exit due to the adverse pressure gradient. Contrary to the fixed ground study by Burgin et al. (Burgin et al., 1986), reducing ride height was found to increase both drag and downforce. At the point of maximum force, the flow detached from the centre of the ramp surface, although the flow pattern remained symmetric. As the ride height was reduced further, the flow in the ramp broke down and became asymmetric resulting in a sharp decrease in drag and lift. Up to the point where the flow detached from the ramp, this was similar to the behaviour observed by Frost, although the peak CL and
CD values were approximately 30% smaller in the Frost study.
Ruhrmann & Zhang (Ruhrmann and Zhang, 2003) further investigated diffuser flow using the model used in the present investigation, with end fences. Looking at the flow under the diffuser ramp, it was noted that for ramp angles of 10° and less, vortex breakdown was the cause of force reduction at small ride heights. This breakdown was strongly influenced by the underbody boundary layer. As the ramp angle was increased, the vortices were no longer strong enough to prevent flow separation on the ramp, and force reduction was caused by a combination of vortex breakdown and flow separation. Force reduction at these higher ramp angles was seen to exhibit hysteresis. The flow was observed to be unsteady after breakdown.
Although previous investigations into the vortical flow field generated by a diffuser equipped bluff body in ground effect exist, the streamwise evolution of the edge vortices and the influence of ride height has not been investigated. This investigation has applications in both automotive and aerospace aerodynamics. The evolution of a vortex in an adverse pressure gradient and any subsequent breakdown has applications to flap side edge aeroacoustics (Khorammi et al., 1999), a topic which is currently at the fore-front of aeroacoustics research. An additional application may be found in the validation of computational schemes such as detached eddy simulations (Kapadia et al., 2003) and large eddy simulations (Verzicco et al., 2002). The aims of this investigation are two-fold; a) to investigate the effect of ride height on the edge vortices generated by a diffuser equipped bluff body in ground effect, and b) to investigate the streamwise evolution of the edge vortices and identify any subsequent breakdown.
2. DESCRIPTION OF EXPERIMENTS
2.1 Wind Tunnel
The experimental investigations were performed in the 2.1m by 1.7m wind tunnel at the University of Southampton. The tunnel is of a conventional closed jet, closed circuit design and is equipped with a moving ground facility. In order for the ground plane to be correctly modelled a two -stage boundary layer removal system is located directly upstream of the moving ground. The majority of the boundary layer is scooped away using a vertical slot, aided by suction, and exp elled outside the test section. The remainder of the boundary layer is removed using a horizontal, perforated plate across which suction is applied. This setup produces a velocity profile, perpendicular to the ground plane, which is equal to the freestream value at a height of 2mm, corresponding to hr /d < 0.013. The freestream turbulence
intensity within the test section is less than 0.2%. 2.2 Wind Tunnel Model
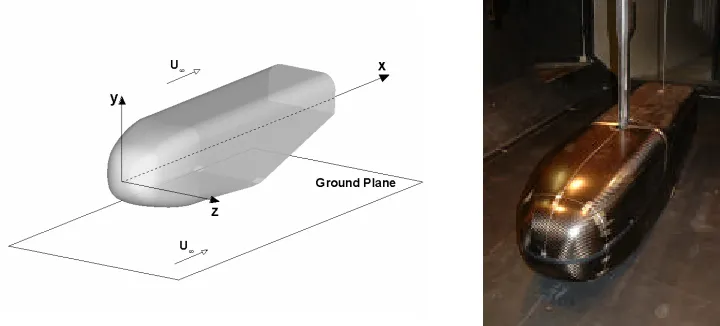
The origin of the model was defined as the nose of the model with the Cartesian coordinate system set such that x was positive downstream, y was positive up and z was positive to port (Fig. 1(a)). The ride height (hr) of the model was defined as the vertical distance between the ground plane and the start of
the diffuser section. In order for the ride height to be continuously varied, with the model in situ, an automated motion and data logging system was used. The mo del was attached to the movement system via two struts, a main upstream strut and a lesser downstream pitch strut as shown in figure 1(b). Downforce and drag forces were obtained using a two -component load cell located between the main strut and the model.
[image:4.596.103.463.188.351.2](a) Definition of the origin and coordinate system (b) Model installation in the tunnel Figure 1: Schematic of the test rig and installation within the wind tunnel
During all tests the model was positioned centrally, in a spanwise sense, within the test section and the yaw and pitch of the model were set at 0°. The ride height of the model was varied between 5mm (hr /d=0.031) and 130mm (hr /d=0.803). A wire 0.4mm in diameter was placed around the nose of the
model at x=100mm in order to fix the boundary layer transition to turbulent and therefore ensure that transition occurred at the same located for each test. The wind and ground speeds were synchronized at a constant dynamic pressure of 56.25mm of water (U8˜30ms-1) during all tests, corresponding to a Reynolds number (Re) of 2.7×10⁶ based on the length of the model.
2.3 Experimental Procedures
Particle Image Velocimetry (PIV) was performed using a Dantec PowerFlow system, with the laser mounted outside the test section and the camera located directly downstream of the model. This setup allowed the flow field directly beneath the port edge of the diffuser to be investigated obtaining z-y
planes at a fixed streamwise location. A diffuser expansion angle (?) of 10°, relative to the horizontal, was investigated since the force data obtained previously by Ruhrmann & Zhang (Ruhrmann and Zhang, 2003) indicated that a 10° expansion angle possessed features of both the high- and low-angle diffusers. The raw data obtained with the PIV system was analysed using a cross -correlation on a 32 by 32 pixel grid, a range validation of the resulting vectors generating a 157 by 125 grid and a moving average algorithm. A high resolution cross-correlation, using a 16 by 16 pixel region was performed at
hr /d=0.127 and x/d= 6.66. The location and size of the vortex did not change compare d to the lower
resolution cross-correlation, but the computational cost was increased significantly therefore a 32 by 32 cross-correlation was used for all the results presented in this paper.
The investigation into the port edge vortex and the corresponding flow field was two fold: a) the effect of ride height on the vortex was initially investigated at non-dimensional ride heights (hr /d) of 0.045,
2.4 Errors and Uncertainties
The yaw and pitch of the model were set to within ±0.05°, and the ride height was set to within ±0.1mm. During all tests belt lift was not observed. The tunnel speed was run at a constant dynamic pressure of 56.25mm of water ±0.05mm (U8˜30ms-1) in order for variations in density to be taken into account. Using procedures detailed by Moffet (Moffet, 1982) the errors in CL and CD were calculated
using the addition method and a 95% confidence. The worst case was found to occur at a ride height of 0.318d, corresponding to a CL of 0.7314±0.0024 and CD of 0.3041±0.0017.
3. RESULTS AND DISCUSSION 3.1 Force Variations
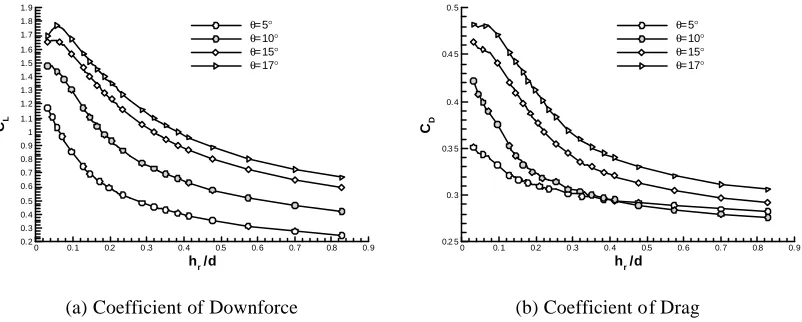
Prior to investigating the flow field of the edge vortices the effects of ride height and diffuser expansion angle on the forces generated by the model were quantified. Figure 2 presents the variation in downforce (fig. 2(a)) and drag (fig. 2(b)) with non-dimensional ride height and diffuser expansion angle. For all ride heights, increasing the diffuser expansion angle resulted in an increase in both downforce and drag, with the exception of ?=5° and 10° at hr /d=0.414 where the trend in reversed.
Considering the ratio between the area at the diffuser inlet and the area at the diffuser exit it is clear that increasing the ramp angle will increase this ratio. In turn this increase in ‘diffuser pumping’ perturbates upstream increasing the mass flow rate beneath the model, as illustrated in the results of Ruhrmann & Zhang (Ruhrmann and Zhang, 2003), therefore increasing the downforce generated.
hr/d
CL
0 0.1 0.2 0 .3 0.4 0.5 0.6 0.7 0.8 0.9
0.2 0.3 0.4 0.5 0.6 0.7 0.8 0.9 1 1.1 1.2 1.3 1.4 1.5 1.6 1.7 1.8 1.9
θ=5° θ=10° θ=15°
θ=17°
hr/d
CD
0 0.1 0.2 0 .3 0.4 0.5 0.6 0.7 0.8 0.9
0.2 5 0.3 0.3 5 0.4 0.4 5 0.5
θ=5° θ=10° θ=15°
θ=17°
[image:5.596.100.501.356.517.2](a) Coefficient of Downforce (b) Coefficient of Drag Figure 2: Variation in forces with non-dimensional ride height and diffuser expansion angle
Upon inspecting the variation in downforce with ride height a clear distinction between the behaviour of large divergence angles (15° and 17°) and the sma llest divergence angle (5°) is observed. The 10° diffuser includes characteristics of both behaviour types. For non-dimensional ride heights above 0.0573, decreasing the ride height resulted in an asymptotic increase in downforce for all diffuser angles, referred to as the ‘force enhancement region’ by Senior & Zhang (Senior and Zhang, 2001). Ruhrmann & Zhang (Ruhrmann and Zhang, 2003)redefine this flow region as ‘type a’. Decreasing the ride height results in a two-fold effect; 1) the flow underneath the model in accelerated more due to continuity effects, resulting in a decreased static pressure at the diffuser inlet (Ruhrmann and Zhang, 2003), which in turn causes, 2) the adverse pressure gradient within the diffuser to increase. The overall result is a more negative pressure within the diffuser and hence more downforce. With a 5° diffuser this force variation with ride height continues until a minimum value of ride height was achieved (hr /d=0.0318).
Below a non-dimensional ride height of 0.0573 for diffuser angles of 15° and 17°, the downforce (CL)
linked to the bursting of one vortex resulting in an asymmetric diffuser pattern (Senior and Zhang, 2001; Ruhrmann and Zhang, 2003), however the advers eness of the pressure gradients within those diffusers were large due to the presence of side fences. Since this case does not include side fences it can be assumed that the streamwise pressure gradients within the diffuser are less severe. Two possible e xplanations for this force behaviour exist. Firstly the ride height small enough such that the boundary layer on the underside of the model could essentially choke the diffuser inlet and therefore reduce the mass flow rate. Secondly the adverseness of the pressure gradients within the diffuser could be severe enough that either one or both of the vortices will breakdown.
The force variation with ride height for a diffuser angle of 10° possesses characteristics of both the high (15° and 17°) and low angle (5°) diffusers. A maximum value of downforce of 1.48 is observed at
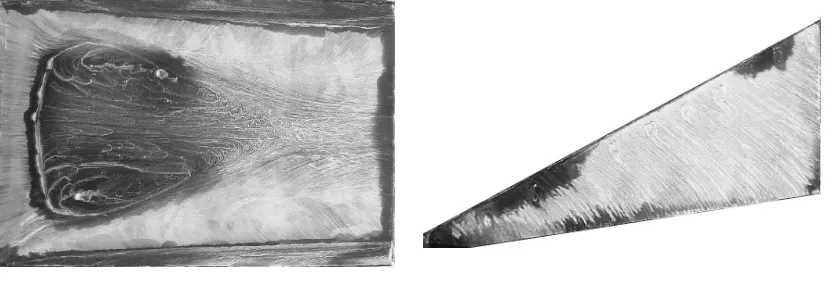
hr /d=0.0446. Figure 3(a) presents an oil flow visualisation of the diffuser ramp at this maximum
downforce ride height for a diffuser angle of 10°. Two vortices are indicates originating from the corners of the diffuser inlet. These expand as they move downstream along the ramp, moving inboard at the same time. A closed separation bubble, starting some distance from the diffuser inlet, is present in the centre of the ramp with the twin vortices bounding the edges of the separation bubble. While the vortices are expanding as they move downstream, there is no indication of vortex breakdown at this ride height.
[image:6.596.93.509.302.449.2](a) Diffuser ramp (b) Port side of model
Figure 3: Oil flow visualisation at hr /d=0.0446 with ?=10°, freestream flow from left to right
3.2 Effect of Ride Height on the Edge Vortex
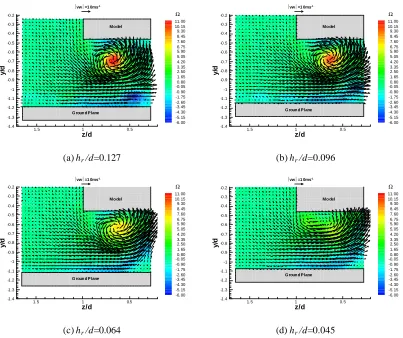
The obtained forces have indicated that decreasing the ride height causes the diffuser flow field to alter creating two different flow regimes; a force enhancement and a force reduction region. In order to study the effect of ground proximity on the edge vortices PIV techniques were utilised allowing for streamwise slices of the vortex, and the associated vertical and spanwise velocities to be obtained. Figure 4 presents contours of non-dimensional vorticity (O) at the diffuser exit (x/d=8.38) at ride heights of 0.127d, 0.096d, 0.064d and 0.045d. Additional PIV surveys were obtained at x/d=5.81, 6.66 and 7.52 however the variations in vortex structure were less perceivable but did possess the same trends as those observed at x/d=8.38 and are therefore not presented in this paper.
z/d y /d 0.5 1 1.5 -1 .4 -1 .3 -1 .2 -1 .1 -1 -0 .9 -0 .8 -0 .7 -0 .6 -0 .5 -0 .4 -0 .3 -0 .2 11.00 10.15 9.30 8.45 7.60 6.75 5.90 5.05 4.20 3.35 2.50 1.65 0.80 -0.05 -0.90 -1.75 -2.60 -3.45 -4.30 -5.15 -6.00 Ω
vw=1 0ms-1
G roun d Plane Mo del z/d y /d 0.5 1 1.5 -1 .4 -1 .3 -1 .2 -1 .1 -1 -0 .9 -0 .8 -0 .7 -0 .6 -0 .5 -0 .4 -0 .3 -0 .2 11.00 10.15 9.30 8.45 7.60 6.75 5.90 5.05 4.20 3.35 2.50 1.65 0.80 -0.05 -0.90 -1.75 -2.60 -3.45 -4.30 -5.15 -6.00 Ω
vw=1 0ms-1
G roun d Plane Mo del
(a) hr /d=0.127 (b) hr /d=0.096
z/d y /d 0.5 1 1.5 -1 .4 -1 .3 -1 .2 -1 .1 -1 -0 .9 -0 .8 -0 .7 -0 .6 -0 .5 -0 .4 -0 .3 -0 .2 11.00 10.15 9.30 8.45 7.60 6.75 5.90 5.05 4.20 3.35 2.50 1.65 0.80 -0.05 -0.90 -1.75 -2.60 -3.45 -4.30 -5.15 -6.00 Ω
vw=1 0ms-1
Mo del
G roun d Plane
z/d y /d 0.5 1 1.5 -1 .4 -1 .3 -1 .2 -1 .1 -1 -0 .9 -0 .8 -0 .7 -0 .6 -0 .5 -0 .4 -0 .3 -0 .2 11.00 10.15 9.30 8.45 7.60 6.75 5.90 5.05 4.20 3.35 2.50 1.65 0.80 -0.05 -0.90 -1.75 -2.60 -3.45 -4.30 -5.15 -6.00 Ω
vw=1 0ms-1
Mo del
G roun d Plane
[image:7.596.99.502.76.414.2](c) hr /d=0.064 (d) hr /d=0.045
Figure 4: Contours of non-dimensional vorticity at x/d=8.38 various ride heights
Decreasing the ride height to 0.096d (fig. (b)) causes the vortex to become less concentrated, indicated by a reduction in vorticity within the vortex. The location and overall size of the vortex remains consistent with that observed at the higher ride height as does the size of the ground boundary layer. Further reductions in ride height to 0.064d (fig. 4(c)) cause the vortex core to seemingly breakdown, indicated by a dilation in the core (Lambourne and Brye, 1962), resulting in a region of anti-clockwise recirculation. The location of this recirculation remains consistent with the vortex core location observed at higher ride heights. At this ride height the ground boundary layer is seemingly separated from the ground and entrained into the region of recirculation towards the centre span of the diffuser. Figure 4(d) presents the flow field at the maximum downforce ride height of 0.045d. The vortex present at higher ride heights has undergone complete breakdown and is replaced by a region of weak anti-clockwise recirculation. The ground boundary layer is still entrained into the recirculation as before.
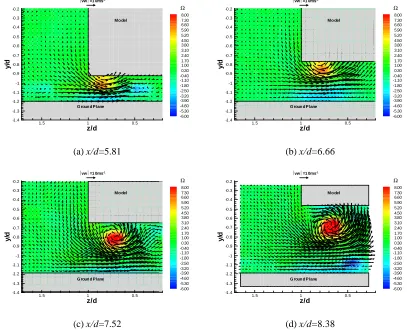
3.3 Streamwise Evolution of Edge Vortex
Figure 5 presents contours on non-dimensional vorticity at various streamwise locations along the diffuser (?=10°) at a ride height of 0.127d. At the most upstream location of x/d=5.81 (fig. 5(a)) the freestream flow is entrained into the diffuser causing the flow to separate off the edge of the diffuser. A region of recirculation in observed attached to the ramp of the diffuser, with the centre of the recirculation located at y/d=-1.02 and z/d=0.87. A region of weak negative vorticity directly beneath the diffuser just above the ground plane is observed, corresponding to the ground boundary layer described previously. Moving downstream to x/d=6.66 (fig. 5(b)) results in the region of recirculation becoming stronger and moving inboard (z/d=0.78) while still attached to the diffuser ramp. The ground boundary layer has grown in height but still remains attached to the ground plane.
z/d y /d 0.5 1 1.5 -1 .4 -1 .3 -1 .2 -1 .1 -1 -0 .9 -0 .8 -0 .7 -0 .6 -0 .5 -0 .4 -0 .3 -0 .2 8.00 7.30 6.60 5.90 5.20 4.50 3.80 3.10 2.40 1.70 1.00 0.30 -0.40 -1.10 -1.80 -2.50 -3.20 -3.90 -4.60 -5.30 -6.00 Ω Mo del
G roun d Plane
vw=1 0ms-1
z/d y /d 0.5 1 1.5 -1 .4 -1 .3 -1 .2 -1 .1 -1 -0 .9 -0 .8 -0 .7 -0 .6 -0 .5 -0 .4 -0 .3 -0 .2 8.00 7.30 6.60 5.90 5.20 4.50 3.80 3.10 2.40 1.70 1.00 0.30 -0.40 -1.10 -1.80 -2.50 -3.20 -3.90 -4.60 -5.30 -6.00 Ω Mo del
G roun d Plane
vw=1 0ms-1
(a) x/d=5.81 (b) x/d=6.66
z/d y /d 0.5 1 1.5 -1 .4 -1 .3 -1 .2 -1 .1 -1 -0 .9 -0 .8 -0 .7 -0 .6 -0 .5 -0 .4 -0 .3 -0 .2 8.00 7.30 6.60 5.90 5.20 4.50 3.80 3.10 2.40 1.70 1.00 0.30 -0.40 -1.10 -1.80 -2.50 -3.20 -3.90 -4.60 -5.30 -6.00 Ω Mo del
G roun d Plane
vw=1 0ms-1
z/d y /d 0.5 1 1.5 -1 .4 -1 .3 -1 .2 -1 .1 -1 -0 .9 -0 .8 -0 .7 -0 .6 -0 .5 -0 .4 -0 .3 -0 .2 8.00 7.30 6.60 5.90 5.20 4.50 3.80 3.10 2.40 1.70 1.00 0.30 -0.40 -1.10 -1.80 -2.50 -3.20 -3.90 -4.60 -5.30 -6.00 Ω
vw=1 0ms-1
Mo del
G roun d Plane
(c) x/d=7.52 (d) x/d=8.38
Figure 5: Contours of non-dimensional vorticity at hr /d=0.127
x/d
y
/d
5 .5 6 6.5 7 7.5 8 8.5
-1.6 -1.4 -1.2 -1 -0.8 -0.6 -0.4 -0.2 0 0.2 0.4
hr/d=0.03 2 hr/d=0.04 5 hr/d=0.05 7 hr/d=0.06 4 hr/d=0.07 6 hr/d=0.09 6 hr/d=0.12 7
U∞
x/d
z
/d
5 .5 6 6.5 7 7.5 8 8 .5
0
0.2
0.4
0.6
0.8
1
1.2
1.4
1.6
1.8
2
hr/d =0.0 32 hr/d =0.0 45 hr/d =0.0 57 hr/d =0.0 64 hr/d =0.0 76 hr/d =0.0 96 hr/d =0.1 27
Diffuser Side U∞
[image:9.596.103.499.79.241.2](a) Vertical location (b) Spanwise location
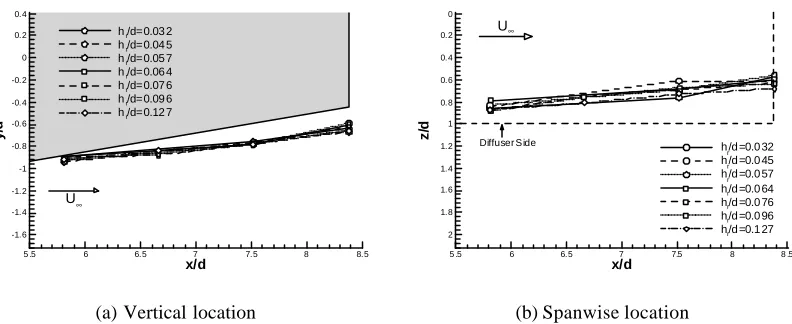
Figure 6: Streamwise location of the port vortex core at various ride heights
The PIV surveys at various streamwise locations indicate that the edge vortex evolves from a weak region of recirculation attached to the diffuser ramp, into a strong detached concentrated vortex. Near the inlet of the diffuser the physical space between the diffuser ramp and the ground plane is small constraining the swirl of the flow and hence limiting the size and strength of the recirculation region. As the distance between the diffuser ramp and the ground plane increases, i.e. an increase in streamwise location, the flow is less constrained and can therefore generate a vortex detached from the model. The PIV surveys in figure 5 indicate that the vortex does not undergo breakdown since the streamwise pressure gradient is not adverse enough. However it has been shown that reducing the ride height causes the vortex to breakdown (fig. 4). It could therefore be hypothesized that reducing the ride height would alter the evolution of the vortex in such a way as to promote breakdown prior to the exit of the diffuser.
4. SUMMARY REMARKS
The generation, evolution and in certain cases breakdown of the edge vortices generated by a diffuser equipped bluff body have been experimentally investigated. PIV, force and oil flow visualisation techniques were used in conjunction, to analyse the flow field and any variations due to ride height. The forces indicate that the edge vortices enhance the downforce as the ride height is reduced until a maximum value of downforce is achieved. Beyond this point the downforce decreases due to the edge vortices breaking down as a result of the adverse pressure gradient within the diffuser becoming too severe. At large values of ride height the edge vortices are generated close to the inlet of the diffuser and are attached to the diffuser ramp. Further downstream the vortices evolve to become concentrated and detached from the diffuser ramp, moving inboard as they evolve. It is hypothesized that at lower values of ride height the edge vortices do not evolve properly and undergo breakdown prior to the exit of the diffuser.
ACKNOWLEDGEMENTS
The authors wish to thank Andreas Rurhmann, Willem Toet and BARf1 for the technical support and the manufacture of the model investigated.
REFERENCES
Frost, R.L.L. (1981), “Experimental investigations of the base pressures found on a bluff body in ground effect”, Aeronautical Journal, Feb., pp. 63-70
Cooper, K.R., Bertenyi, T., Dutil, G., Syms, J. and Sovran, G. (1998), “The aerodynamic performance of automotive underbody diffusers ”, SAE Paper 980030
Cooper, K.R., Sovran, G. and Syms, J. (2000), “Selecting automotive diffusers to maximis e underbody downforce”, SAE Paper 2000-01-0354
Senior, A.E. & Zhang, X. (2001), “The force and pressure of a diffuser-equipped bluff body in ground effect”, Journal of Fluids Engineering, 123, (1), pp. 105-123
Rurhmann, A., & Zhang, X. (2003), “Influence of diffuser angle on a bluff body in ground effect”, Journal of Fluids Engineering, 125, (2), pp. 332-338
Burgin, K., Adey, P.C., Beatham, J.P. (1986), “Wind tunnel tests on road vehicle models using a moving belt simulation of ground effect”, Journal of Wind Engineering and Industrial Aerodynamics , 22, pp. 227 – 236
Khorammi, M.R., Singer, B.A., and Radeztsky, R.H. Jr. (1999), “Reynolds-Averaged Navier-Stokes computations of a flap-side-edge-flowfield”, AIAA Journal, 37, (1), pp. 14-22
Kapadia, S., Roy, S. and Wurtzler, K. (2003), “Detched eddy simulation over a reference Ahmed car model”, AIAA Paper 2003-0857, 41st Aerospace Sciences Meeting & Exhibit, Reno, Navada, 6-9 January.
Verzicco, R., Fatica, M., Iaccarino, G., Moin, P. and Khalighi, B. (2002), “Large eddy simulation of a road vehicle with drag-reduction devices”, AIAA Journal, 40, (12), pp. 2447-2455
Moffet, R. (1982), “Contributions to the theory of single-sample uncertainty analysis ”, Journal of Fluids Engineering, 104, pp. 250-260
Lambourne, N.C. and Bryer, D.W. (1962), “The bursting of leading-edge vortices-some observations and discussion of the phenomenon”, Aeronautical Research Council, R&M No. 3282