The supply of part-time higher
education in the UK
This series of Research reports published by Universities UK will present the results of research that we have commissioned or undertaken in support of our policy development function. The series aims to disseminate project results in an accessible form and there will normally be a discussion of policy options arising from the work.
This report was produced for Universities UK by Professor Claire Callender and Anne Jamieson Birkbeck, University of London, and Geoff Mason National Institute of Economic and Social Research
Acknowledgements
Our thanks go to a range of people and
organisations who have helped with this study. Specifically, to Tony Bruce, Janet Manning, Kevin McGladdery, and Jovan Luzajic at Universities UK who have been supportive throughout the duration of the project. Next we would like to thank all the universities that participated in the study to the individuals who we interviewed and gave their time so freely – without their help this study could not have happened.
The copyright for this publication is held by Universities UK. The material may be copied or reproduced provided that the source is acknowledged and the material, wholly or in part, is not used for commercial gain. Use of the material for commercial gain requires the prior written permission of Universities UK.
5 Preface
6 Summary
1
10 Introduction
10 Study aims, objectives and scope 10 Our approach
12 Definition of part-time provision 12 Outline of the report
2
14 Trends in part-time higher education enrolments in the UK
3
17 Characteristics of UK part-time students
4
25 Entry qualifications and intensity of study: English-domiciled undergraduates
5
27 The regional distribution of part-time higher education in the UK
27 Part-time higher education provision in Government Office regions
29 Part-time higher education provision at city-region level
6
37 Part-time provision: range and types
37 Undergraduate level provision: types of awards 37 Models of provision
38 Location of provision 39 Hours of provision
39 Trends in the volume of part-time provision 7
41 Institutional factors affecting part-time provision
41 Legacy, mission and strategy 42 No incentive to change?
42 Ways of supporting different sorts of part-timers 42 The characteristics of the part-time student
undergraduate population
44 Information and communications technology (ICT)
45 Staffing issues 45 Subject portfolios
8
46 External factors affecting part-time provision: the local context
46 The local labour market, industries and employers
Contents The supply of part-time higher education in the
48 Competing and complementary higher education providers
48 Partnerships with further education colleges
9
50 Labour government policies affecting part-time provision
50 Signals and incentives from government and the funding council
51 The shifting public priorities towards part-time provision
51 Equivalent and lower qualifications (ELQ) 52 HEFCE funding methodology
54 Funding higher education teaching and research
54 Tuition fees
57 Government-funded support for students 10
61 Summary and conclusions 61 Universities’ legacy and mission 61 HEFCE’s funding methodology and
additional student numbers 62 Credit-based learning
62 Local context, employer-related provision and co-funding
63 Risk
64 Tuition fees and financial support for students
64 Conclusion Appendix 1
66 City-region hot spots and cold spots Appendix 2:
28 Table 16 Part-time undergraduate student numbers in UK universities per 1,000 working age population, analysed by Government Office region, 2007 – ordered by part-time undergraduate ratios 29 Table 17 Part-time undergraduate student
numbers in universities per 1,000 working age population without NVQ4 qualifications, analysed by Government Office region, 2007 – ordered by part-time
undergraduate ratios
29 Table 18 Reported travelling times for part-time students in the UK, 2006 31 Table 19 Part-time undergraduate student
numbers in UK universities per 1,000 working age population without NVQ4 qualifications, analysed by city-region, 2007 – ordered by part-time
undergraduate ratios 56 Table 20 Factors associated with
employers contributing to tuition or course fees
57 Table 21 Fee grant and course grant: rates for 2009/2010
59 Table 22 Factors associated with students who receive a government fee grant
59 Table 23 Factors associated with students who receive help via a government course grant
60 Table 24 Shortfalls in government financial support for part-time students 66 Table 25 England: city-region hot spots by
qualification aim
66 Table 26 England: city-region hot spots by number of students and
universities
67 Table 27 England: city-region cold spots by qualification aim – entire
institutions
67 Table 28 England: city-region cold spots by number of students and
universities
70 Table 29 Proportion of students studying part-time by qualification aim at case study universities
Tables
15 Table 1 Higher education enrolments analysed by mode of study and domicile, UK, 2003/04 to 2007/08
16 Table 2 Part-time students as a proportion of total higher education students, analysed by mode of study and domicile, UK, 2003/04 to 2007/08
17 Table 3 Higher education students,
UK-domiciled, analysed by qualification aim, 2007/08
18 Table 4 UK-domiciled students, 2007/08, analysed by mode of study, gender, age group and ethnic background
18 Table 5 UK-domiciled students, 2007/08, analysed by mode of study, entry qualifications and subject area 19 Table 6 Part-time students, UK-domiciled,
analysed by gender and qualification aim, 2007/08
19 Table 7 Age distribution of part-time students, UK-domiciled, analysed by qualification aim, 2007/08
20 Table 8 Ethnic backgrounds of part-time students, UK-domiciled, analysed by qualification aim, 2007/08
21 Table 9 Highest entry qualifications of part-time students, UK-domiciled, analysed by qualification aim, 2007/08
21 Table 10 Main subject of study of part-time students, UK-domiciled, analysed by qualification aim, 2007/08
22 Table 11 Distribution of part-time students across UK universities, UK-domiciled students, 2007/08
23 Table 12 Part-time higher education students, UK-domiciled, analysed by qualification aim and full-time equivalent ratio, 2007/08
23 Table 13 Part-time higher education students, UK-domiciled, analysed by qualification aim and distribution of full-time
equivalent ratios, 2007/08
24 Table 14 Part-time higher education students, UK-domiciled, analysed by qualification aim and location of study, 2007/08 25 Table 15 Part-time English-domiciled
undergraduates, analysed by entry qualifications and intensity of study, 2007/08
Charts
14 Chart 1 Part-time higher education students in further education institutions as a proportion of total part-time higher education students, UK, 1996/97 to 2008/08, analysed by qualification aim 33 Chart 2 Total part-time students (undergraduate
and postgraduate) in universities per 1,000 working age population without NVQ4 qualifications, UK, 2007, analysed by city-region
34 Chart 3 Total part-time undergraduate students per 1,000 working age population without NVQ4 qualifications, UK, 2007, analysed by city-region
35 Chart 4 Total part-time first-degree students in universities per 1,000 working age population without NVQ4 qualifications, UK, 2007, analysed by city-region 36 Chart 5 Employment as a proportion of working
age population, UK city-regions, 2007 37 Chart 6 The supply of part-time higher education 55 Chart 7 Sources used to pay for tuition or course
fees
56 Chart 8 Percentage of students receiving employer contribution to tuition or course fees
58 Chart 9 English-domiciled part-time students’ highest entry qualification by
qualification aim, 2007/08
In Universities UK’s evidence to the independent review of higher education funding and student finance chaired by Lord Browne, it has proposed changes to the system of student finance that would enable government to devise an affordable solution for the expansion of loans to the other groups of students, including part-time students. The submission recognises the challenges of doing so at a time when public finances are under severe pressure but reform is essential if part-time higher education provision is to continue to meet the needs of students and society.
This report explores the supply of part-time higher education in the UK, with particular consideration to the study of part-time undergraduate provision in England. It is the final publication in the series of reports on individual student markets that were
commissioned by Universities UK following the publication of the reports on theFuture size and shape of the higher education sectorin 2008/09. It considers the factors facilitating and inhibiting the supply and growth of undergraduate part-time higher education. The study charts the scale and nature of both the undergraduate and postgraduate part-time student population in the UK and maps the geography of part-time higher education, highlighting regions with high and low levels of part-time provision. The study includes case studies of 15 English universities located in regions with high and low levels of provision. The case studies aim to explain the regional distribution of part-time undergraduate courses and to understand the external and internal factors that promote and hinder part-time undergraduate higher education.
The final section examines part-time student funding and finances and explains why the present arrangements represent an important barrier to the development of this market. Universities UK supports as a long-term aim the movement towards a system of student support that is indifferent as to the incentives to pursue full-time or part-time undergraduate study. The introduction of variable fees in 2006 was based on the principle of a graduate contribution from full-time home and EU undergraduate students, but did not extend this to other groups. As a result part-time students – unlike full-time undergraduates – are required to make upfront fee payments unless they can secure a
contribution from their employer. The absence of a graduate contribution scheme has also made it more difficult for universities to charge part-time fees pro rata to full-part-time fees, and thus secure the quality of the experience for these students.
Part-time provision: range and types
Part-time undergraduate higher education, like the part-time undergraduate population, is heterogeneous – there is no typical part-time course. Amongst the case study universities we looked at, there are a number of models for organising and delivering part-time courses. Similarly, where, how, and when part-time teaching took place varies considerably. Although nationally there has been a decline in part-time enrolments, some of the universities we examined are experiencing a rise in
enrolments while others are seeing no change or a decline. Consequently, institutions’ perceptions of the demand for part-time courses vary, which in turn influences their internal policies,
allocation of resources, and attitudes toward the provision of part-time higher education.
Internal and external factors affecting part-time provision
The nature of a university’s legacy and mission is a good indication of the probable levels of its part-time undergraduate provision and any prospects for future expansion. This does not mean that ‘old’ or ‘new’ university is a handy predictor for a university’s involvement in part-time higher education. ‘Old’ universities tend to have less part-time provision than ‘new’ universities, especially employer-related vocational courses. However, among our case studies several ‘old’ universities have high levels of non-vocational liberal arts provision: some ‘new’ universities that we looked at have very little part-time undergraduate provision.
A far more significant determinant of the overall patterns of part-time undergraduate higher education, and its potential future growth, are government policies and particularly the funding of institutions delivering part-time courses, the level of tuition fees they can charge, and the financial support available to students to pay for their fees and other costs.
The current HEFCE funding model favours full-time provision at the expense of part-full-time. It financially disadvantages institutions providing part-time courses and fails adequately to cover the additional costs and risks associated with delivering part-time courses. Part-time courses are less lucrative than full-time courses, and the market for part-time courses is more volatile and demand more difficult to predict.
Consequently, there are now clear incentives for mixed mode institutions to grow their full-time undergraduate provision and run down their part-time undergraduate programmes. This report is about time students and
part-time study, and the factors facilitating and inhibiting the supply and growth of
undergraduate part-time higher education. The study consists of three components. First, a statistical review of Higher Education Statistics Agency (HESA) data which charts the scale and nature of both the undergraduate and
postgraduate part-time student population in the UK. This review also maps the geography of part-time higher education highlighting regions with high and low-levels of part-time provision. Secondly, case studies of 15 English universities located in regions with high and low-levels of provision. These case studies sought to explain the regional distribution of part-time
undergraduate courses and to understand the external and internal factors that promote and hinder part-time undergraduate higher education. Thirdly, an analysis of part-time student funding and finances which calls upon the findings of a recent survey of 3,704 part-time UK undergraduates.
The study was commissioned by Universities UK. It was undertaken by Professor Claire Callender and Anne Jamieson of Birkbeck, University of London and Geoff Mason of the National Institute of Economic and Social Research.
Statistical review
Since the early 2000s, part-time undergraduate and postgraduate enrolments in UK universities have increased at a slower rate than for full-time students. There has been some weakening in the growth of part-time student numbers, especially since 2006/07. The data suggest that future growth of part-time higher education student numbers is not to be taken for granted – at least, not so far as UK-domiciled students are
concerned.
In the UK, 39 per cent of all higher education enrolments in 2007/08 were part-timers.
Compared to full-time students, part-timers are typically older, more likely to be female and more likely to hold vocational qualifications or general education qualifications below A level on entering higher education courses.
There are marked geographical differences in the provision of part-time undergraduate higher education. For example, in some city-regions the ratio of part-time undergraduates per 1,000 persons in the working-age population is four times the national average. At the other extreme, some city regions have no part-time
Where and how part-time teaching takes place also varies – it is not always exclusively at an institution’s main site or campus. Sometimes it is:
p
in partnership with or at other educationalinstitutions, typically further education colleges
p
at employers’ premises – work-basedprovision
p
electronically – via distance learning.Sometimes part-time provision is delivered during normal university hours from
9.00am–6.00pm on weekdays, sometimes after ‘normal’ hours and at weekends. There is also in-fill provision: part-timers are taught
alongside their full-time peers, and sometimes part-timers are taught separately.
The statistical review shows an overall decline in part-time enrolments since 2006/07. However, in recent years some universities among the case studies had experienced a rise in
enrolments, while others had seen no change or a fall. Consequently, institutions’ perceptions of demand varied – some perceived there was no demand, others believed there was considerable unmet demand, and sought to create demand. A rise in demand for part-time learning was most often associated with the current economic cycle and internal institutional changes,
including improved marketing and changes in the courses offered.
A fall in demand was associated with financial constraints, the current economic crisis, and changes in government policies, especially the policy about equivalent and lower qualifications (ELQs).
Chapter 7 – Institutional factors affecting part-time provision
Interviews with 15 universities in England that made up the case studies highlighted a range of internal institutional factors that both facilitated and hindered their part-time provision.
Universities had control over these issues and so could shape them in ways to promote or curtail part-time provision.
The funding mechanisms limit the scope for growth and changes in patterns of part- time provision. They are largely inappropriate for delivering flexible, part-time provision that can respond to the needs of employers and
employees.
The only way to expand part-time undergraduate provision among institutions with a full
complement of full-time undergraduates and little provision for part-time students is a strong steer from government about the importance of part-time study, backed up by additional HEFCE funding to incentivise undergraduate part-time study alongside earmarked additional student numbers.
The system of student financial support favours full-time students at the expense of part-time students. All full-time undergraduates are eligible for government-funded loans to pay for their fees once they graduate. In contrast, part-time students have to pay their fees up front. Only 10 per cent receive any government-funded support towards their fees and this support is inadequate. This limits the fees institutions can charge for their part-time courses.
Radical reforms to student financial support are required to incentivise part-time study.
Detailed Findings
Chapter 6 – Part-time provision: range and types
p
Part-time undergraduate higher education,like the part-time undergraduate population, is heterogeneous – there is no typical part-time course.
p
There are a variety of models for organisingthe delivery of part-time provision including:
p
provision that is fully integrated withfull-time provision
p
mixed – where part-time provision isintegrated with full-time provision but some part-time courses are provided separately
p
separate part-time provision which is theChapter 8 – External factors affecting part-time provision: local context
A range of local external factors over which universities had limited control, both facilitated and hindered part-time provision. This local context is particularly significant for
understanding patterns of part-time provision because part-time students usually attend their local university or an institution within an hour’s commute of their home or place of work. Three interconnected factors help to explain variations in universities’ part-time provision and the regional distribution of part-time provision, especially the scale, nature, and patterns of employer-related part-time study:
p
The nature and composition of a university’slocal labour market and the skills base of the local population – universities in regions with a highly educated workforce and local
population could expect more demand for part-time courses than those in regions where the local populace had low educational
aspirations.
p
The nature and of a university’s localindustrial base and hinterland, combined with a university’s subject portfolio and how well it met the needs of the industrial sectors of local establishments and employers, particularly large ones – the presence of nearby public sector employment was especially significant. However, the existence of local employers in the public or the private sectors did not guarantee employment engagement
opportunities, nor did their absence preclude employer-related provision.
p
Employers’ ability or willingness to co-fundand sponsor their employees and courses, especially given cuts in their education and training budgets.
Competition from neighbouring education institutions, such as further education colleges and private providers, sometimes affected part-time provision, especially where competitor institutions were tapping similar pools of students.
The number of partnerships – for instance, with further education colleges – rather than their presence or absence, help to explain the amount of part-time provision and its regional
distribution. The quantity of partnerships was often associated with an institution’s legacy and mission.
The most important institutional factors
influencing patterns of part-time provision were a university’s legacy and mission and how these were integrated into its strategic plans. Legacies and missions varied widely both within and between different types of institutions or to which mission group they belonged; high and low levels of part-time provision were found in both ‘old’ and ‘new’ universities.
The interplay between the characteristics of the part-time student population and the
infrastructure required to support part-time students and to deliver part-time and flexible study was another significant factor explaining the patterns of part-time provision. The tailoring of an institution’s infrastructure to the needs of both part-time students and part-time study facilitated provision, while its absence constrained provision and its expansion. The extent to which universities were willing to invest in this infrastructure reflected:
p
the size and nature of their part-timeprovision
p
their perceptions of the demand for part-timeand flexible study
p
the additional costs associated withdeveloping such an infrastructure
p
the opportunity costs – where demand forfull-time provision was seen to exceed capacity. Staff attitudes towards teaching part-timers similarly facilitated or hindered part-time provision and were largely influenced by the institution’s culture and mission. Staff concerns focused primarily on:
p
additional teaching loads, andp
the demands of teaching part-time andnon-traditional students.
An institution’s accessibility also affected its provision. It had a direct impact on a university’s potential pool of students, their participation in part-time courses, and the type of part-time provision. The location of some institutions, especially those in rural and/or sparsely populated areas, shaped the nature of their catchment area, their provision, and mode of delivery.
Chapter 9 – Government policies affecting part-time provision
Government policies are probably the most significant factor facilitating or hindering patterns of part-time provision.
Case study universities thought government policies sent very mixed messages about the importance of part-time provision. There are not many policies aimed directly at promoting and incentivising part-time undergraduate provision. Universities believed that these were essential to main current provision and its expansion.
Several government and funding council policies in effect, had, undermined some forms of part-time provision and directly contributed to its decline; vocational courses and qualifications have been prioritised at the expense of liberal arts/continuing education.
The ELQ ruling was seen as a major reason for the decline in part-time numbers and as a potential inhibitor to existing provision and further growth, particularly non-vocational provision in separate departments of continuing education. Employer-related courses have similarly been affected as some employers are unable or unwilling to pay the higher fees which universities would have to charge for ELQ students.
The Higher Education Funding Council for England’s current funding mechanism for teaching was believed to have the effect of favouring full-time provision at the expense of part-time students and part-time study. It was seen as an inappropriate model for delivering flexible part-time provision that could respond to the needs of employees and employers.
Particular concerns that disadvantaged part-time providers included:
p
time targeted allocations – or thepart-time premium, which was considered inadequate to meet the additional costs of teaching part-time students and delivering part-time courses
p
assumed fee income – institutions believedthat this should be based on the actual tuition fee income
p
grant adjustments – institutions wanted amore flexible system that recognised achievement irrespective of mode, type and place of study.
All institutions were concerned about the cap on student numbers and felt the only way they could expand their part-time provision was through additional student numbers (ASNs).
Tuition fee policies varied but the payment of fees upfront was seen as a barrier to part-time provision and its growth. A survey of part-time undergraduates showed that in 2007/08 the mean fee was £1,166 and the median £900. This varied considerably depending on students’ qualification aim, subject of study, where they study, and their intensity of study.
The survey showed that a third of part-time undergraduates had all their fees paid for by their employer. However, employers were very selective in terms of which employees they were willing to invest in and help financially. Those most likely to receive such help were the least in need of employer support – they were the most privileged workers in full-time jobs, already with a Level 4 or 5 qualification, studying a vocational qualification, in vocationally orientated subjects, and from households with medium to high incomes.
This report explores the supply of part-time higher education in the UK, with particular consideration to the supply of part-time
undergraduate provision in England. Numerous recent official documents and research reports suggest that the demand for part-time study, especially at the undergraduate level is likely to grow in the near future. For example, meeting Leitch’s 2020 target of 40 per cent or more 19–65-year-olds achieving a Level 4 qualification,1
is predicated on part-time provision. Reports for Universities UK on the future size and shape of the higher education sector in the UK2
suggest that in the next 20 years part-time undergraduate enrolments will increase at a much faster rate than full-time ones, and the mix between full- and part-time students could shift substantially towards part-time.
A recent National Audit Office report called for more part-time undergraduate courses to facilitate the widening participation agenda,3
and another study of working adults highlighted their desire for part-time study in the evenings and weekends at a university close to home.4
More recently the Department of Business, Innovation and Skills’ (BIS) document, Higher ambitions: the future of universities in a knowledge economy suggested that we, ‘can expect part-time study to increase’ (Department of Business, Innovation and Skills, 2009, para 34).5
Just as important, the previous Labour government voiced increasing concern about part-time provision and the need for more flexible learning opportunities, both to widen participation and to meet the need for high-level skills. For instance, the BIS (2009) document says:
‘We aim to widen participation through the expansion of the number of adults at
university and by promoting a broader range of course models alongside the three year degree … to attract a greater diversity of students, more part-time study, more
vocationally-based foundation degrees, more work-based study, more fast-track degrees, and more study at home must be available.’ (Department of Business, Innovation and Skills, 2009, para 8)6
The executive summary of the same paper suggests that:
‘The next phase of expansion in higher education will hinge on providing
opportunities for different types of people to study in a wider range of ways than in the past. The focus will therefore be on a greater diversity of models of learning: part-time, work-based, foundation degrees, and studying while at home.’ (Department of Business, Innovation and Skills, 2009, page 9)
It was against this background that Universities UK wished to explore the supply of part-time provision and to update its previous work on part-time study and students.
Study aims, objectives and scope
The overall aim of the project was to explore some of the factors affecting the supply of part-time provision, especially at undergraduate level in England. It also updated some of the previous work commissioned by Universities UK on part-time study conducted by Professor Callender and colleagues.7
The objectives of the study were to:
p
map the geography of part-timeundergraduate provision, highlighting any ‘cold spots’
p
describe the nature of part-time provision ofhigher education and the part-time student population
p
identify the external and internal factors bothfacilitating and inhibiting the growth of universities’ part-time provision
p
identify what steps universities, government,and the funding councils could take to encourage greater part-time undergraduate provision.
The study concentrated on factors affecting the supply of part-time higher education but also examined some issues affecting the demand for part-time provision among part-time students, specifically student financial support.
Our approach
The study consisted of the following linked elements:
p
a statistical reviewp
case studies of universitiesp
an analysis of student funding and financialStatistical review
Using 2007/08 HESA date this section provides background information on part-time provision in UK higher education, focusing on the apparent unevenness of regional opportunities to
undertake part-time higher education study. The review also updates the statistical analyses in Part-time students in higher education – supporting higher-level skills and lifelong learning8
(Universities UK, 2006).
Case studies of universities
To gain a better understanding of the regional distribution of part-time higher education provision outlined in Charts 3 and 4, we selected 15 universities in England as case studies. The case studies examined the factors both
facilitating and inhibiting universities’ existing part-time provision and potential expansion. The focus was solely on undergraduate provision in England because it is here that we are likely to see the greatest growth in the near future. In particular, the case studies assessed:
p
the nature and extent of part-time provisionp
why universities did not have more part-timeprovision
p
what factors facilitated the provision ofpart-time courses
p
the key constraints/barriers to such provisionp
changes required to provide more part-timeprovision
Selecting the case studies
Analysis of the data in the statistical review informed the selection of the 15 case study institutions. Five institutions selected were in city-regions of England that had been identified as ‘cold spots’, with relatively low part-time undergraduate provision; eight were in ‘hot spot’ city-regions with more extensive part-time provision.9We added Birkbeck, University of London and the Open University because together they dominate the part-time undergraduate market.
Our analysis showed that the city-regions (and hence the universities we could select) with high and low part-time provision vary depending on whether we examined:
p
all part-time undergraduate studentsp
part-time first-degree studentsp
part-time foundation degree studentsp
part-time higher national diploma/highernational certificate students
p
part-time other undergraduatesTable 25 shows the top five hot spot city-regions – those with the highest density of part-time undergraduate provision as a proportion of the population without a NVQ Level 4 by different qualification aims. This table clearly shows how the city-region defined as having the most part-time students varies, depending on the
qualification aim selected. Table 26 shows the city-region hotspots by qualification aim and includes the actual number of students and the name of the universities within the city region. Tables 27 and 28 show the equivalent
information for the top five cold spot regions – those with low part-time provision.
It was agreed with Universities UK that the case study institutions would represent a mix of those with high or low provision in different
qualification aims. Selecting city-regions with low part-time provision posed another
challenge. In these regions we have identified regions:
p
with no universities at allp
with only satellite campusesp
where there are entire institutions, or wherethe main campus is located
It was agreed with Universities UK that we should only select city-regions where an entire institution is located.
Other issues also have influenced our selection of city-regions. First, it was agreed that the case studies would be confined to England, although some of the findings are likely to be relevant to universities outside England.10
Definition of part-time provision
We follow the HESA definition of part-time higher education students, that is, they are defined by default as those who do not meet its definition of full-time.12
Thus part-time students are those who are not normally required to attend a higher education institution for at least 21 hours per week for 24 weeks per year of study. This definition includes students on block release from their places of employment and those studying during the evenings.
Outline of the report
The first part of this report – Chapters 2 to 5 – consists of the statistical review of part-time provision and part-time students.
Chapter 2reports recent trends in part-time higher education participation by level of study and student domicile. Then we focus solely on UK-domiciled part-time students, who currently represent 92 per cent of all part-timers.
Chapter 3 describes the main characteristics of UK-domiciled part-time students: qualification aims, gender, age, ethnic background, highest entry qualifications, subject of study, and intensity of study.
Chapter 4concentrates on English-domiciled students and explores both their entry
qualifications and their intensity of study because these are two of the main criteria in England for receiving student financial support – an issue discussed in more depth in Chapter 9.
Chapter 5 assesses the regional distribution of part-time higher education provision relative to the potential demand for it, namely, that
proportion of the working-age population in each region who have not yet gained qualifications at NVQ Level 4 or higher.
The second part of the report – Chapters 6 to 10 – draws on the findings from the 15 case studies of English universities and their undergraduate part-time provision. The chapters examine the regional distribution of part-time provision in England outlined in Chapter 5 and discuss the key factors facilitating and hindering part-time undergraduate provision.
Chapter 6describes key aspects of provision, including the pattern, range and variations in the way it is organised. We then consider three sets of factors that explain variations in provision.
Chapter 7examines institutional factors while Chapter 8 concentrates on external/local conditions.
Method of data collection
For each of the institutions selected, we obtained basic information through analysis of the
relevant web pages to augment the data derived from further analysis of the HESA data. Through Universities UK we asked each institution whether it was willing to participate in the study and to identify someone for interview.
Our interviews were usually with the pro vice-chancellor for learning and teaching/student experience/academic, though in a few cases the person interviewed had other responsibilities. In several cases more than one person at an institution was interviewed. In each university interviews covered the following broad areas:
p
the nature and extent of part-timeundergraduate provision
p
the factors that facilitate the provision ofpart-time undergraduate courses
p
the key constraints/barriers to such provisionand further growth
p
the risks, if any, involved in part-timeundergraduate provision
p
changes required to provide more part-timeundergraduate provision
p
how government, the funding councils, andother stakeholders could encourage greater part-time undergraduate provision.
Student tuition fees and financial support The discussion of financial support for students’ tuition fees focuses exclusively on provision in England. It draws on HESA data for English-domiciled students, and some of the findings of the first phase of a longitudinal study being conducted by Claire Callender and by David Wilkinson of the National Institute of Economic and Social Research, for the Higher Education Careers Services Unit (HECSU) and the
Department for Business, Innovation and Skills (BIS) on part-time students.11
Chapter 9explores the role of government policies in the variations in provision.
In spite of encouraging statements by policymakers regarding part-time provision, there are now widespread concerns that part-time student numbers may be hit by the previous government’s decision to phase out funding from 2008/09 for most students in England and Northern Ireland who are studying for
qualifications that are equivalent to or lower than qualifications they already hold (ELQs). Recent HESA data on enrolments suggest that –among UK-domiciled students at least – some
[image:16.652.303.555.439.683.2]weakening in part-time enrolments may have developed even before the ELQ policy was implemented.
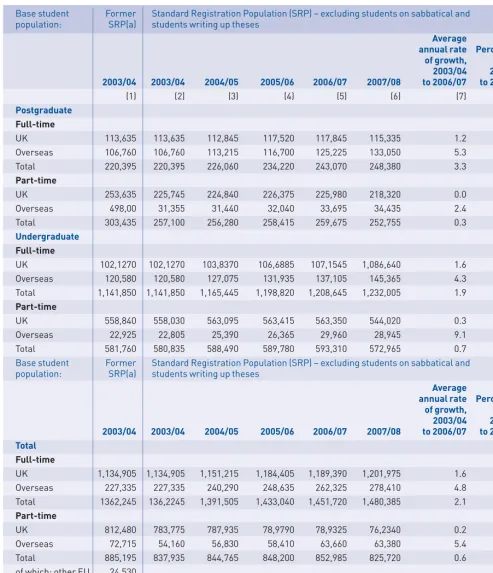
Table 1, column 1 shows data for 2003/04 that correspond with those published in Part-time students in higher education – supporting higher-level skills and lifelong learning13
. The headcount total of 837,010 part-time students cited in that report consisted of 812,480 UK-domiciled students and 24,530 students classified as ‘other EU’ in domicile. These data include students on sabbatical and students writing up theses who were covered by HESA’s definition of the student base population at the time (the standard registration population). In 2007/08, however, sabbatical and writing-up students were excluded from the population and a new time series of enrolments data using the new standard registration population definition was published, backdated to 2003/04. These data (shown in Table 1, columns 2–6) point to the following main conclusions:14
p
Part-time enrolments grew more slowly thanfull-time enrolments between 2003/04 and 2006/07 at both postgraduate and
undergraduate levels (Table 1, column 7).
p
The growth in part-time enrolments duringthis period was more due to growing numbers of part-time international students than to growth in UK-domiciled part-timers.
p
Total part-time enrolments are shown asfalling by 3.2 per cent between 2006/07 and 2007/08 (Table 1, column 8). The HESA figures for 2007/08 are provisional. Nonetheless, the apparent decline in part-time enrolments over this 12-month period was much steeper for UK-domiciled students than for overseas students, which is consistent with trends in the mix of UK- and overseas-domiciled part-time students over the preceding four years. Furthermore, the HESA data do not show any decline in full-time UK-domiciled student enrolments between 2006/07 and 2007/08.
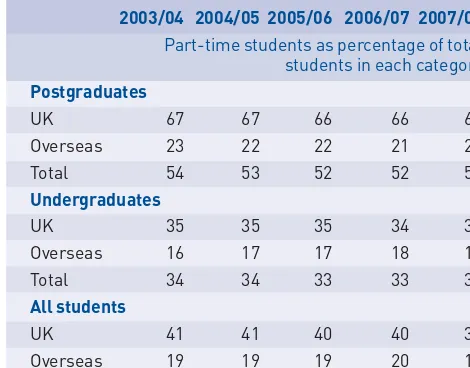
The provisional conclusion is that, as shown in Table 2, UK-domiciled part-time student numbers have fallen as a proportion of total student numbers at both postgraduate and undergraduate levels in the most recent four years for which we have data. This conclusion still holds if we take account of students on higher education courses provided directly by further education institutions, which are not included in HESA data. In 1996/97 higher education students in further education
institutions represented just under 20 per cent of all part-time higher education students in the UK (referring to students from all domiciles, not just UK-domiciled students). By 2007/08 this proportion had fallen to 11 per cent (Chart 1).15 Given the changes in definitions, we need to be cautious in using past trends to inform our expectations about future developments. Nonetheless, if nothing else, the data suggest that future part-time participation in higher education is not so sure to grow as was expected a few years ago. This new uncertainty provides a considerable spur to our research into whether part-time higher education is constrained in some UK regions by limited opportunities for students to participate in this mode of study.
Chart 1
Part-time higher education students in further education institutions as a proportion of total part-time higher education students, UK, 1996/97 to 2008/08, analysed by qualification aim
Source: HESA, Higher Education Statistics for the United Kingdom, various issues
Note: This chart should be interpreted with caution due to potential inconsistencies in the underlying data from higher education institutions and further education colleges.
45 40 35 30 25 20 15 10 5 0 P
art-time HE s
tudents in FE ins
titutions
as % of t
o
tal part-time HE s
tudents
1997 1999 2001 2003 2005 2007
Base student Former Standard Registration Population (SRP) – excluding students on sabbatical and
population: SRP(a) students writing up theses
Average
annual rate Percentage of growth, change 2003/04 2006/07
2003/04 2003/04 2004/05 2005/06 2006/07 2007/08 to 2006/07 to 2007/08
(1) (2) (3) (4) (5) (6) (7) (8)
Postgraduate
Full-time
UK 113,635 113,635 112,845 117,520 117,845 115,335 1.2 -2.1
Overseas 106,760 106,760 113,215 116,700 125,225 133,050 5.3 6.2
Total 220,395 220,395 226,060 234,220 243,070 248,380 3.3 2.2
Part-time
UK 253,635 225,745 224,840 226,375 225,980 218,320 0.0 -3.4
Overseas 498,00 31,355 31,440 32,040 33,695 34,435 2.4 2.2
Total 303,435 257,100 256,280 258,415 259,675 252,755 0.3 -2.7
Undergraduate
Full-time
UK 102,1270 102,1270 103,8370 106,6885 107,1545 1,086,640 1.6 1.4
Overseas 120,580 120,580 127,075 131,935 137,105 145,365 4.3 6.0
Total 1,141,850 1,141,850 1,165,445 1,198,820 1,208,645 1,232,005 1.9 1.9
Part-time
UK 558,840 558,030 563,095 563,415 563,350 544,020 0.3 -3.4
Overseas 22,925 22,805 25,390 26,365 29,960 28,945 9.1 -3.4
Total 581,760 580,835 588,490 589,780 593,310 572,965 0.7 -3.4
Base student Former Standard Registration Population (SRP) – excluding students on sabbatical and
population: SRP(a) students writing up theses
Average
annual rate Percentage of growth, change 2003/04 2006/07
2003/04 2003/04 2004/05 2005/06 2006/07 2007/08 to 2006/07 to 2007/08
Total
Full-time
UK 1,134,905 1,134,905 1,151,215 1,184,405 1,189,390 1,201,975 1.6 1.1
Overseas 227,335 227,335 240,290 248,635 262,325 278,410 4.8 6.1
Total 1362,245 136,2245 1,391,505 1,433,040 1,451,720 1,480,385 2.1 2.0
Part-time
UK 812,480 783,775 787,935 78,9790 78,9325 76,2340 0.2 -3.4
Overseas 72,715 54,160 56,830 58,410 63,660 63,380 5.4 -0.4
Total 885,195 837,935 844,765 848,200 852,985 825,720 0.6 -3.2
of which: other EU 24,530
All modes
UK 1,947,385 1,918,680 1,939,150 1,974,195 1,978,715 1,964,315 1.0 -0.7
Overseas 300,055 281,500 297,120 307,040 325,985 341,790 4.9 4.8
[image:17.652.67.561.154.728.2]Total 2,247,440 2,200,180 2,236,270 2,281,240 2,304,705 2,306,105 1.5 0.1
Table 1
Higher education enrolments analysed by mode of study and domicile, UK, 2003/04 to 2007/08
Sources: Derived from Higher education student enrolments and qualifications obtained at higher education institutions in the United Kingdom, HESA Statistical First Releases, Nos. 117 (January 2008, Table 1) and 130 (January 2009, Table 1).
Table 2
Part-time students as a proportion of total higher education students, analysed by mode of study and domicile, UK, 2003/04 to 2007/08
2003/04 2004/05 2005/06 2006/07 2007/08 Part-time students as percentage of total students in each category Postgraduates
UK 67 67 66 66 65
Overseas 23 22 22 21 21
Total 54 53 52 52 50
Undergraduates
UK 35 35 35 34 33
Overseas 16 17 17 18 17
Total 34 34 33 33 32
All students
UK 41 41 40 40 39
Overseas 19 19 19 20 19
Total 38 38 37 37 36
Source: derived from columns 2–5 in Table 1.
In respect of ethnic background, 79 per cent of part-time students are white, much the same proportion as the 78 per cent of full-time students. This finding differs substantially from that reported for 2003/04 in Part-time students in higher education – supporting higher-level skills and lifelong learning(Universities UK, 2006) and requires further investigation; it may reflect the inclusion of other EU-domiciled students as well as a different treatment of students classified as ‘not known or information refused’ in the earlier data (Table 4).
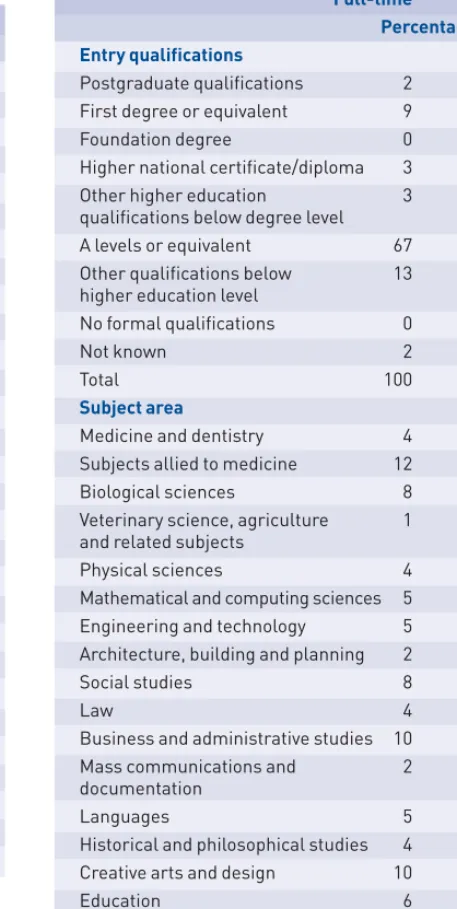
In terms of entry qualifications, part-time students are conspicuous for having a relatively high share of students with prior qualifications gained at higher education level, compared to full-time students, two-thirds of whom hold as their highest entry qualification A levels or equivalent. (Table 5). Part-time students are also more likely than full-time students to be studying subjects allied to medicine and education. In this chapter we focus solely on UK-domiciled
students in 2007/08, focusing on six different types of qualification aim, three of which (first degrees, foundation degrees and higher national certificates/diplomas) are investigated in depth in this research.
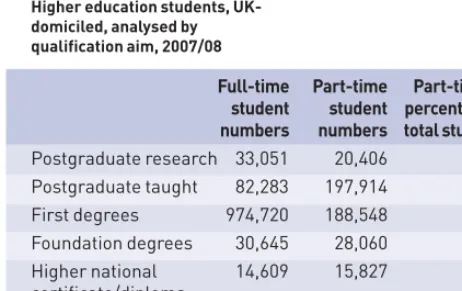
As Table 3 shows, most higher education
[image:19.652.67.298.375.520.2]students on postgraduate taught courses, higher national courses and a large residual category of ‘other undergraduate qualifications’, which include professional qualifications at undergraduate level and institutional undergraduate credits are part-timers. Foundation degree students are fairly evenly divided between full-timers and part-timers. Part-time students are a minority among first-degree students and postgraduate research students.
Table 3
Higher education students, UK-domiciled, analysed by qualification aim, 2007/08
Full-time Part-time Part-time as
student student percentage of
numbers numbers total students
Postgraduate research 33,051 20,406 38
Postgraduate taught 82,283 197,914 71
First degrees 974,720 188,548 16
Foundation degrees 30,645 28,060 48
Higher national 14,609 15,827 52
certificate/diploma
Other undergraduate 66,665 311,585 82
qualifications (a)
Total 1,201,973 762,340 39
Source: HESA Student Record, 2007/08
Note: (a) Other undergraduate qualifications consist mainly of diplomas and certificates in higher education, undergraduate diplomas or certificates, professional qualifications at undergraduate level and institutional undergraduate credits.
As is well-known, part-time students at undergraduate and postgraduate level are typically older than full-time students and are more likely to be female. While 68 per cent of full-time students are less than 22 years old, this is only true for 7 per cent of part-timers. About 63 per cent of part-time higher education students are female compared to 56 per cent of full-time students (Table 4).
3
Table 5
UK-domiciled students, 2007/08, analysed by mode of study, entry qualifications and subject area
Full-time Part-time Percentage of total Entry qualifications
Postgraduate qualifications 2 13
First degree or equivalent 9 25
Foundation degree 0 0
Higher national certificate/diploma 3 6
Other higher education 3 15
qualifications below degree level
A levels or equivalent 67 13
Other qualifications below 13 15
higher education level
No formal qualifications 0 2
Not known 2 11
Total 100 100
Subject area
Medicine and dentistry 4 1
Subjects allied to medicine 12 16
Biological sciences 8 3
Veterinary science, agriculture 1 1
and related subjects
Physical sciences 4 2
Mathematical and computing sciences 5 4
Engineering and technology 5 4
Architecture, building and planning 2 3
Social studies 8 8
Law 4 2
Business and administrative studies 10 12
Mass communications and 2 1
documentation
Languages 5 5
Historical and philosophical studies 4 4
Creative arts and design 10 2
Education 6 15
Combinations and 11 18
interdisciplinary courses
Total 100 100
n = 1,201,973 762,340
Source: HESA Student Record, 2007/08
We now go on to examine the characteristics of part-time students in more detail. In all the six qualification groups under consideration, most are female, except for higher national
[image:20.652.330.559.159.614.2]qualifications (HNQs), where only 31 per cent of part-time students are female (Table 6). Table 4
UK-domiciled students, 2007/08, analysed by mode of study, gender, age group and ethnic background
Full-time Part-time Percentage of total Gender
Percentage female 56 63
Percentage male 44 37
Total 100 100
Age group
Under 18 1 1
18–21 67 6
22–25 16 12
26–29 5 13
30–39 6 28
40–49 3 24
50–59 1 10
60 plus 0.1 5
Age unknown 0.01 0.4
Total 100 100
Ethnic background
White 78 79
Black or Black British-Caribbean 1 2
Black or Black British-African 4 3
Other Black background 0.3 0.4
Asian or Asian British-Indian 4 2
Asian or Asian British-Pakistani 2 1
Asian or Asian British-Bangladeshi 1 0.4
Chinese 1 0.5
Other Asian background 1 1
Other (including mixed) 4 2
Not known or information refused 3 9
Total 100 100
n = 1,201,973 762,340
Source: HESA Student Record, 2007/08
The higher national group is also an exception when it comes to the student age distribution and ethnic mix. Some 52 per cent of all part-time students are aged 30-49 and only 19 per cent are aged under 26 (Table 7). However, among part-time higher national students, just over half are aged below 26 (many of whom are presumably apprentice trainees). Similarly, disaggregation by qualification aim shows that the proportion of ethnic minority students is smaller for higher national students than for part-time students as a whole (Table 8).
Table 6
Part-time students, UK-domiciled, analysed by gender and qualification aim, 2007/08
Percentage Qualification aim: Female Male Total (a) female
Postgraduate 10,427 9,979 20,406 51
research
Postgraduate taught 119,639 78,237 197,876 60
First degrees 114,084 74,460 188,544 61
Foundation degrees 18,871 9,187 28,058 67
Higher national 4,833 10,990 15,823 31
certificate/diploma
Other undergraduate 208,835 102,697 311,532 67
qualifications
Total 476,689 285,550 762,239 63
Source: HESA Student Record, 2007/08
[image:21.652.69.558.397.578.2]Note: (a) Figures exclude 101 students classified as indeterminate gender.
Table 7
Age distribution of part-time students, UK-domiciled, analysed by qualification aim, 2007/08
Higher
national Other Postgraduate Postgraduate First Foundation certificates/ undergraduate
research taught degrees degrees diplomas qualifications Total n =
Percentage of part-time students in each qualification group
Under 18 0 0 0.1 0.1 1 2 1 7,701
18–21 0.2 1 10 12 30 5 6 46,446
22–25 6 12 15 16 20 10 12 91,786
26–29 12 16 13 13 13 11 13 100,445
30–39 31 33 27 28 19 26 28 213,650
40–49 28 26 22 23 13 24 24 181,985
50–59 17 10 8 6 3 12 10 78,140
60 plus 5 1 4 1 1 9 5 38,771
Age Unknown 0.1 0.4 0 0.2 0.2 1 0.4 3,416
Total 100 100 100 100 100 100 100 762,340
Source: HESA Student Record, 2007/08
Table 8
Ethnic backgrounds of part-time students, UK-domiciled, analysed by qualification aim, 2007/08
Higher
national Other
Postgraduate Postgraduate First Foundation certificates undergraduate
research taught degrees degrees /diplomas qualifications Total
Percentage of part-time students
White 79 78 80 82 87 79 79
Black or Black British-Caribbean 1 1 2 2 1 1 2
Black or Black British-African 2 3 4 2 2 3 3
Other Black background 0.3 0.3 1 0.4 0.3 0.4 0.4
Asian or Asian British-Indian 3 3 2 1 1 2 2
Asian or Asian British-Pakistani 1 1 1 1 1 1 1
Asian or Asian British-Bangladeshi 0.2 0.4 1 0.4 0.3 0.3 0.4
Chinese 1 1 0.4 0.2 0.2 0.5 0.5
Other Asian background 1 1 1 1 1 1 1
Other (including mixed race) 3 2 2 2 2 2 2
Not known or information refused 10 9 6 8 4 10 9
Total 100 100 100 100 100 100 100
n= 20,406 197,914 188,548 28,060 15,827 311,585 762,340
Source: HESA Student Record, 2007/08
Part-time enrolments for first degree courses are more evenly distributed between subject areas, with the largest single area being subjects allied to medicine (9 per cent). About one in five first degree part-timers are classified to combined subject or interdisciplinary courses. Before enrolling in higher education in 2007/08,
the highest qualifications of about a quarter of part-time students on first degree, foundation-degree and higher national courses were A levels or equivalent qualifications (Table 3.7).16 The mix of entry qualifications held by part-time students varied sharply between qualification aims. For example, some 14 per cent of part-time first degree students already held first degrees or postgraduate qualifications while another 32 per cent already held other higher education qualifications below first degree level. On foundation degree courses around 33 per cent of part-timers held vocational qualifications or general education qualifications below A level and on part-time higher national courses this percentage rose to 43 per cent.
Table 9
Highest entry qualifications of part-time students, UK-domiciled, analysed by qualification aim, 2007/08
Higher
national Other
Postgraduate Postgraduate First Foundation certificates undergraduate
research taught degrees degrees /diplomas qualifications Total
Percentage of part-time students Highest entry qualifications:
Postgraduate qualifications 53 26 4 2 2 9 13
First degree or equivalent 35 50 10 7 5 20 25
Foundation degree 0 0 1 0 0 0 0
Higher national certificate/diploma 0 2 13 7 8 4 6
Other higher education qualifications 2 8 18 13 5 18 15
below degree level
A levels or equivalent 1 2 26 26 24 11 13
Other qualifications below 1 4 19 33 43 18 15
higher education level
No formal qualifications 0 0 2 2 1 3 2
Not known 7 8 6 10 12 16 11
Total 100 100 100 100 100 100 100
n = 20,406 197,914 188,548 28,060 15,827 311,585 762,340
[image:23.652.64.557.454.782.2]Source: HESA Student Record, 2007/08
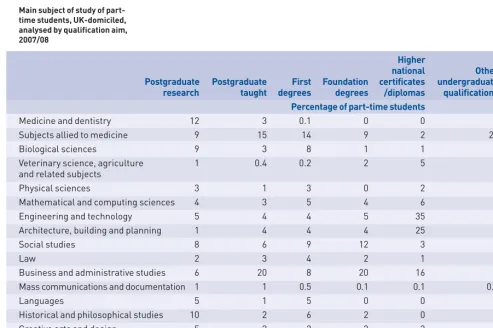
Table 10
Main subject of study of part-time students, UK-domiciled, analysed by qualification aim, 2007/08
Higher
national Other
Postgraduate Postgraduate First Foundation certificates undergraduate
research taught degrees degrees /diplomas qualifications Total
Percentage of part-time students
Medicine and dentistry 12 3 0.1 0 0 0 1
Subjects allied to medicine 9 15 14 9 2 20 16
Biological sciences 9 3 8 1 1 1 3
Veterinary science, agriculture 1 0.4 0.2 2 5 1 1
and related subjects
Physical sciences 3 1 3 0 2 1 2
Mathematical and computing sciences 4 3 5 4 6 3 4
Engineering and technology 5 4 4 5 35 1 4
Architecture, building and planning 1 4 4 4 25 1 3
Social studies 8 6 9 12 3 8 8
Law 2 3 4 2 1 1 2
Business and administrative studies 6 20 8 20 16 8 12
Mass communications and documentation 1 1 0.5 0.1 0.1 0.4 1
Languages 5 1 5 0 0 8 5
Historical and philosophical studies 10 2 6 2 0 4 4
Creative arts and design 5 2 2 3 3 2 2
Education 16 28 5 33 1 12 15
Combinations and interdisciplinary 2 3 22 2 1 29 18
courses
Total 100 100 100 100 100 100 100
n = 20,406 197,914 188,548 28,060 15,827 311,585 762,340
Just under 24 per cent of part-time students are enrolled at the Open University (Tables 11 A–C). The next 47 largest institutions account for another 47 per cent of part-time students. The remaining 29 per cent of part-time students are spread between 156 different higher education institutions. Five of the eight universities with more than 10,000 part-time students are post-1992 universities. When we compare institutions on the ratio of part-timers to total student headcount, then eight of the ten institutions least active in part-time recruitment are pre-1992 universities (Table 11D).
Table 11
Distribution of part-time students across UK universities, UK-domiciled students, 2007/08
A. Distribution of part-time student headcounts between institutions
Headcounts of Number of Proportion of total part-time students institutions part-time students
20,000+ 1 23.8
10,000-19,999 7 11.3
5,000-9,999 40 36.0
1,000-4,999 72 27.3
<1,000 44 1.6
Total 164 100
B. Part-time student headcounts in eight largest institutions
Open University 181,082
Birkbeck College 15,469
University of Teesside 15,084
Edge Hill University 12,871
University of Warwick 11,620
University of the West of England 10,954
University of Plymouth 10,206
London Metropolitan University 10,173
C: Part-time students as percentage of total student headcount: top ten institutions
Full- Part- Percentage
time time Total part-time
Open University 282 181,082 181,364 99.8
Birkbeck College 555 15,469 16,024 96.5
University of Wales, 881 5,780 6,661 86.8
Lampeter
Institute of Education 1,300 4,928 6,228 79.1
Institute of Cancer 51 174 225 77.3
Research
London Business 176 323 499 64.7
School
Edge Hill University 7,089 12,871 19,960 64.5
Harper Adams 1,454 2,546 4,000 63.7
University College
Cranfield University 873 1,486 2,359 63.0
University of Teesside 8,913 15,084 23,997 62.9
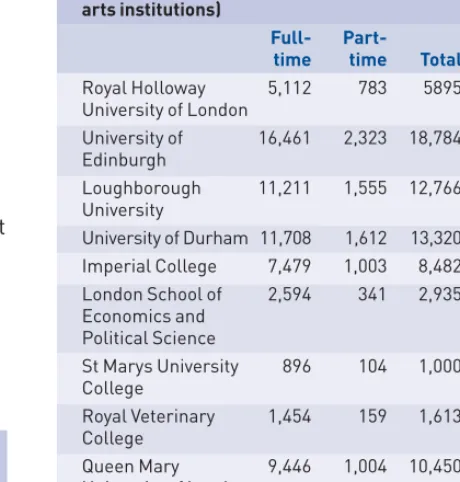
D: Part-time students as percentage of total student headcount: bottom ten institutions (excluding specialist arts institutions)
Full- Part- Percentage
time time Total part-time
Royal Holloway 5,112 783 5895 13.3
University of London
University of 16,461 2,323 18,784 12.4
Edinburgh
Loughborough 11,211 1,555 12,766 12.2
University
University of Durham 11,708 1,612 13,320 12.1
Imperial College 7,479 1,003 8,482 11.8
London School of 2,594 341 2,935 11.6
Economics and Political Science
St Marys University 896 104 1,000 10.4
College
Royal Veterinary 1,454 159 1,613 9.9
College
Queen Mary 9,446 1,004 10,450 9.6
University of London
University of 14,229 1,359 15,588 8.7
Newcastle-upon-Tyne
Source: HESA Student Record, 2007/08
The intensity of study by part-time students can be assessed from their universities’ estimates of how their study loads compare with those of full-time students on similar courses. Overall, part-time students represent on average about 35 per cent of full-time equivalent students (Table 12). However, this figure is held down by the large numbers of part-time students in the ‘other undergraduate’ qualifications category.
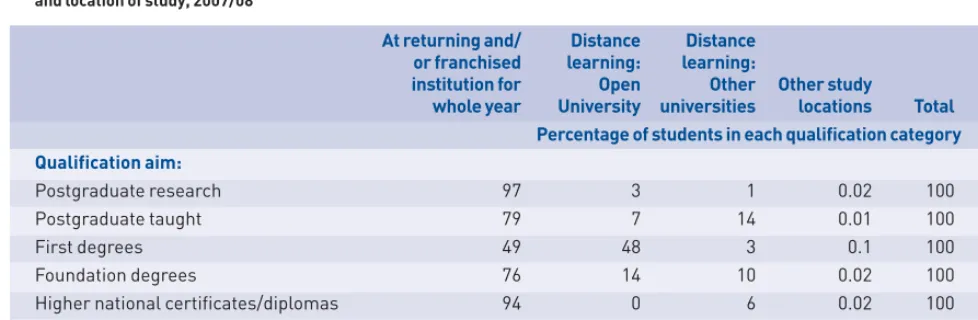
About 31 per cent of part-time students are engaged in distance learning, almost all of them through the Open University (Table 14). Just over half of part-time first degree students are studying through distance learning compared to only 14 per cent of part-time foundation degree students. No part-time higher national students are reported as studying through distance learning.
Table 12
Part-time higher education students, UK-domiciled, analysed by qualification aim and full-time equivalent ratio, 2007/08
Part-time full-time equivalent as Part-time Sum of percentage student full time of part-time numbers equivalent headcount Qualification aim:
Postgraduate research 20406 10,373 51
Postgraduate taught 197,914 68,326 35
First degrees 188,548 82,220 44
Foundation degrees 28,060 16,622 59
Higher national 15,827 8,579 54
certificates/diplomas
Other undergraduate 311,585 77,483 25
qualifications
Total 762,340 263,603 35
Source: HESA Student Record, 2007/08
Table 13
Part-time higher education students, UK-domiciled, analysed by qualification aim and distribution of full-time equivalent ratios, 2007/08
Percentage of full time-equivalent student load: Under 25% 25 -49% 50 -74% 75% or more Total n = Percentage of students in each qualification category Qualification aim:
Postgraduate research 9 13 69 9 100 20,406
Postgraduate taught 30 36 31 3 100 197,914
First degrees 19 29 41 11 100 188,548
Foundation degrees 10 14 52 24 100 28,060
Higher national certificates/diplomas 9 15 67 9 100 15,827
Other undergraduate qualifications 55 24 19 2 100 311,585
Total 36 28 31 6 100 762,340
p
Overall, around 39 per cent of all highereducation enrolments in 2007/08 were part-timers. On postgraduate taught courses, higher national courses and a large residual category of ‘other undergraduate
qualifications’, which include professional qualifications at undergraduate level and institutional undergraduate credits, most university-based students are part-time. Foundation degree students are fairly evenly divided between full-timers and part-timers. It is mainly among first degree students and postgraduate research students that part-time students are a minority.
p
Compared to full-time students, part-timestudents are typically older, more likely to be female and more likely to hold vocational qualifications or general education
[image:26.652.70.559.148.308.2]qualifications below A level on entering higher education courses. Part-time students aiming for qualifications such as foundation degrees and higher national certificates/diplomas are also more likely than most students to be concentrated in a small number of subject areas (for example, education, business studies and social studies, including social work, in the case of part-time foundation degree students).
Table 14
Part-time higher education students, UK-domiciled, analysed by qualification aim and location of study, 2007/08
At returning and/ Distance Distance or franchised learning: learning:
institution for Open Other Other study
whole year University universities locations Total n =
Percentage of students in each qualification category Qualification aim:
Postgraduate research 97 3 1 0.02 100 20,406
Postgraduate taught 79 7 14 0.01 100 197,914
First degrees 49 48 3 0.1 100 188,548
Foundation degrees 76 14 10 0.02 100 28,060
Higher national certificates/diplomas 94 0 6 0.02 100 15,827
Other undergraduate qualifications 72 23 5 0.1 100 311,585
Total 69 24 7 0.1 100 762,340
Table 15, based on the 2007/08 figures, shows some marked contrasts between undergraduate qualification aims, in terms of both the part-time students’ entry qualifications and their intensity of study (calculated as a proportion of a full-time equivalent student load), which also has a bearing on the student financial support for which they are eligible.
Around 38 per cent of part-time first degree students hold prior qualifications equivalent to NVQ4 or higher; a further 29 per cent are working at less than 50 per cent of a full-time equivalent student load. For part-time foundation degree students the equivalent proportions are, respectively, 21 per cent and 18 per cent while for part-time higher national students, the equivalent proportions are 16 per cent and 14 per cent. As many as 42 per cent of part-time students pursuing other
undergraduate qualifications hold prior
qualifications equivalent to NVQ4 or higher while another 47 per cent are working at less than half a full-time equivalent student load.
Following the Labour government’s decision to phase out funding from 2008/09 for most students in England and Northern Ireland who are studying for qualifications that are equivalent to or lower than qualifications than they already hold (ELQs), there is now considerable interest in finding out how many part-time students are ‘ELQ’ students. This is particularly important in relation to eligibility for government-funded student financial support which will be discussed in more depth in a later chapter. Students in England who already hold a Level 4 qualification are ineligible for this support. This chapter, therefore, unlike the previous chapters which include students throughout the UK, focuses exclusively on English-domiciled students.
Part-time English-domiciled undergraduates are typical of the wider UK population of part-timers, described in chapter 2. They are disproportionately female and tend to be
concentrated in the 30-49 year old age group and in subject areas such as education, subjects allied to medicine, and combined or inter-disciplinary subject areas (see Appendix 1).
4
[image:27.652.58.555.469.682.2]Entry qualifications and intensity of study: English-domiciled undergraduates
Table 15
Part-time English-domiciled undergraduates, analysed by entry qualifications and intensity of study, 2007/0817
A: Part-time first degree students
Percentage of full-time equivalent student load
Under 50% 50–59% 60–74% 75% or more Total
Entry qualifications: Percentage of total part-time first degree enrolments (n = 158,840)
Above or equal to NVQ4 20 11 4 4 38
Below NVQ4 22 15 5 7 49
Not classified 7 4 1 1 13
Total 49 30 10 11 100
B. Part-time foundation degree students
Percentage of full-time equivalent student load
Under 50% 50-59% 60-74% 75% or more Total
Entry qualifications: Percentage of total part-time foundation degree enrolments (n = 26,369)
Above or equal to NVQ4 6 6 5 5 21
Below NVQ4 14 16 16 15 62
Not classified 4 4 5 4 17
C. Part-time higher national students
Percentage of full-time equivalent student load
Under 50% 50-59% 60-74% 75% or more Total
Entry qualifications: Percentage of total part-time higher national enrolments (n = 104,77)
Above or equal to NVQ4 2 4 7 3 16
Below NVQ4 12 19 31 7 70
Not classified 2 6 5 2 14
Total 16 29 43 12 100
D. Part-time other undergraduate students
Percentage of full-time equivalent student load
Under 50% 50-59% 60-74% 75% or more Total
Entry qualifications: Percentage of total part-time other undergraduate enrolments (n = 250,647)
Above or equal to NVQ4 33 7 1 1 42
Below NVQ4 25 5 1 1 32
Not classified 22 4 0 0 26
Total 80 16 2 2 100
E. Total part-time undergraduate students
Percentage of full-time equivalent student load
Under 50% 50–59% 60–74% 75% or more Total
Entry qualifications: Percentage of total part-time undergraduate enrolments (n = 446,333)
Above or equal to NVQ4 26 8 2 2 39
Below NVQ4 23 10 4 4 41
Not classified 15 4 1 1 21
Total 64 22 7 7 100
Part-time higher education provision in Government Office regions
As shown in Table 16, column 1, there are marked differences between Government Office regions21
in part-time provision by universities, with the highest ratio in Wales almost three times higher than the ratio in the East Midlands. These differences persist when we look at particular qualification aims but with some variation in the ordering of regions. For example, the highest ratio of part-time first degree
students in universities per head of working age population is in London while North East
England leads on part-time foundation degree students based in universities and Wales on part-time higher national students in universities.
In this chapter we explore regional inequalities in the supply of part-time higher education with particular emphasis on undergraduates. We estimate the numbers of part-time
undergraduate students per 1,000 working-age population by Government Office region and carry out a more disaggregated analysis at city-region level.
This analysis has proved helpful in guiding our choice of case study institutions for this project and in helping us to identify those universities located in regions with high and low part-time provision. However, it is important to note that our analysis is limited to universities in the UK (including courses franchised out to further education colleges). As noted in chapter 2, about 11 per cent of all part-time higher education enrolments in 2007/08 related to courses offered directly by further education colleges; however, these are not covered by HESA data upon which our analysis is based.18
Furthermore, as shown in Chart 1, the proportion of part-time students enrolled directly in further education colleges rises to about 17 per cent for qualifications below first degree level. Estimates for England prepared at the Higher Education Funding Council for England (HEF