Southern Region Engineering Conference 11-12 November 2010, Toowoomba, Australia SREC2010-T2-2
Enhanced Heuristics to Reduce Power
Consumption of Networks using Weight Setting
Abdelnour Aldraho
Faculty of engineering and survey University of Southern QueenslandToowoomba, Australia Email: Abdelnour.aldraho@usq.edu.au
Alexander A. Kist
Faculty of engineering and survey University of Southern QueenslandToowoomba, Australia Email: kist@ieee.org
Abstract—Energy consumption of communication networks is an important contributor to the ICT sector’s greenhouse gas emission footprint. Networks are generally dimensioned for peak loads. Over long periods, networks are underutilised, and at the same time their energy consumption remains high. This paper focuses on the reduction of power consumption of communication networks by adapting network topology to traffic demands and improves that reduction by using OSPF weight setting. Dynamic topologies refer to a method of changing network links and notes according to traffic loads and reset the weight set of the links. This paper investigates two heuristics: the Lightest Node First and the Least Loaded Node algorithms that find topologies for given traffic loads, which have a smaller energy footprint, but are able to accommodate traffic loads. Numerical results are presented for a sample network with a large set of traffic demands. Depending on overall network utilisation and weight setting technique, the algorithms are able to reduce the average network power consumption by up to 40%.
Keywords- linkUtilisation; weight setting; power consumption; dynamic topology.
I. INTRODUCTION
Greenhouse Gas (GHG) emissions and power consumption have become pressing issues. Energy production has been linked to increases in GHG emission. Reducing energy consumption therefore helps to reduce GHG emission. The Information and Communication Technology (ICT) sector enables technology that helps to reduce power in the business sector. However, the ICT sector itself is responsible for approximately 2% of the global GHG emission. These are predicted to increase by 6% by 2020 [1].
The contributions of networks to the sector’s GHG emissions are estimated to be between 30% [2] and 37% [1]. In contrast, telecommunication networks operate at utilisations of below 30% [3] to below 50% [4]. This is mainly due to the cyclic nature of traffic and the practice of over provisioning networks to support quality of service (QoS) requirements at peak loads. Therefore, green information technology is receiving growing attention by industry as well as the research community. As a related work to this subject, energy efficiency in communication networks has been addressed by a number of studies. [5] uses energy consumption data of office and telecommunication equipment to estimate the energy consumption of Internet infrastructure to 6.05 TWh in 2000. Power consumption is largely load independent ([5], [6], e.g.). Potential savings are possible using Ethernet link
shutdown [7], low power modes of LAN networks [8], [9], optimised LAN switches [10]; and rate adaptation and sleeping stages in networks [3]. The energy consumption of access network technologies are compared by [11] and it is concluded that optical-access is most energy efficient. [12] addresses node and link power down for unused connections. [13] investigates the power consumption of network elements in IP over WDM networks. A number of studies [14], [15], [16], [17], [18], [19] apply similar optimisation techniques to specific networks to achieve energy efficiency.
This paper focuses on methods to identify optimal topologies for given traffic loads using a combination of linear programming and weight setting technique, introduced in [20] to find that optimal topologies. Previous work [21] has proposed a linear programming approach that is able to identify optimal topologies for given traffic loads; this paper is using a set of heuristics that were introduced in [22] with applying weight setting techniques to find the reduced optimal topology and enhance the reduction of the power. The remainder of the paper is organised as follows: Section II presents a set of the adopted heuristics with the changes. Section III evaluates proposed algorithms, and section IV concludes this work.
II. HEURISTICSFORDYNAMICTOPOLOGIESWITH WEIGHTSETTING
In this section, two heuristics will be presented to find the optimal topology for the given network load by minimise active nodes and links. The optimal topology will contribute to reduce the energy consumption and green house gas emission. The techniques of the proposed algorithms are based on reducing unnecessary active routers. However, the information that is used to find the unnecessary active routers is different for each algorithm.
This technique is used to calculate a new set of shortest paths that distribute traffic loads more evenly. This technique has been widely discussed to address traffic distribution and various efficient methods have been proposed to solve related optimisation problems.
The Least Loaded Node algorithm with weight setting (LLNWS), which is based on the LLN algorithm [22] with weight setting, also requires traffic data. The demand of turned off node will resign to another node. The demand could be handled by a number of options as explained in [21].
In this paper, the demands that will be received on the interfaces of inactivated node will be forwarded to the neighbor node through a single arc, which will remain active to handle demands. The capacity of the remaining arc is reduced to equal the demand originating at this node. This prevents additional traffic being routed via the remaining active arc. It is assumed that networks in this study use shortest path routing, such as Open Shortest Path First (OSPF). The algorithms are based on link utilisations. It is assumed that system performance is acceptable if effective link utilisation is below 100%. If utilisation passes this threshold, performance becomes unacceptable. All discussions in this paper refer to effective link utilisation and not actual link utilisation.
A. The Lightest Node First Algorithm With Weight Setting.
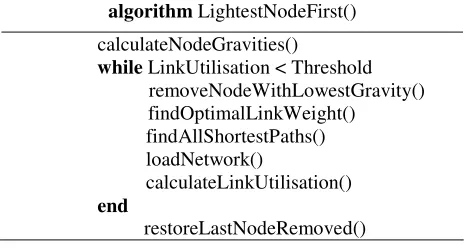
The relevance of nodes in this algorithm (LNFWS) is based on the number of links that are connected to the node. The capacity of connected links will be added for every single node and the node with lowest gravity will be turned off. The concept of gravity has been used in the context of traffic matrix estimation and network optimisation. Figure 1 shows the pseudo code of the LNF Algorithm with Weight Setting. During this calculation, the link utilisation will be measured. Once the maximum link utilisation has reached the threshold, the optimal topology has been found.
algorithm LightestNodeFirst() calculateNodeGravities()
while LinkUtilisation < Threshold removeNodeWithLowestGravity()
findOptimalLinkWeight() findAllShortestPaths() loadNetwork()
calculateLinkUtilisation() end
restoreLastNodeRemoved()
Figure. 1. The Lightest Node First Algorithm with Weight Setting
The algorithm will calculate the gravity of all nodes and create a list of gravity values. The lowest node gravity from the list will be turned off. The weight setting technique will apply to calculate the new weight of the remaining links. This technique will help to reduce link overload. The shortest path will be calculated to find the new path to forward the traffic. The network will be loaded and the link utilisation will calculate. In the case link utilisation has reached the threshold, the last removed node will restore. The set of active nodes and links represent the solution which present the optimal topology for a given traffic load.
B. The Least Loaded Nodes algorithm with Weight Setting.
The power down of nodes in this algorithm (LLNWS) is based on the traffic load of nodes. The load of every node will be calculate and the lowest loaded node will turned off. It is assumed that these nodes are less important. Figure 2 shows the pseudo code of the algorithm with weight setting.
algorithm LeastLoadedNode() calculateLoadNode ()
while LinkUtilisation < Threshold removeNodeWithLowestLoad()
findOptimalLinkWeight() findAllShortestPaths() loadNetwork()
calculateLinkUtilisation() end
[image:2.595.36.270.487.611.2]restoreLastNodeRemoved()
Figure. 2. The Least Loaded Node Algorithm with Weight Setting
Similarly to the explanation of LNFWS algorithm, created list for the load of every node which will calculate. The lightest load node will turn off. The weight setting technique will apply to rearrange the weight of the links. The shortest path will calculate for the topology. The network will be loaded again and the link utilisation will be calculated. The calculated link utilisation will be compared with the threshold. Once the utilisation has reached the threshold, then the last node that was removed is turned back on, restoring the last feasible solution. The set of active nodes and links represents the solution.
III. EVALUATIONANDANALYSIS
Numerical results have been produced and generate by applying the two algorithms which we will discuss in this section. Assumptions, network topology and traffic data are discussed below and to evaluate the reduction of energy of network, the power was measured for several traffic loads as used by [22] and [21].
A. Test Network and Traffic Data
Figure. 3: The network topology with The Capacity over the links
B. Test Setup
To implement the two algorithms, C++ code has been used. The network topology was loaded and the traffic matrix was loaded by the program. The shortest path calculation, the new weight set, the link utilisation and load the network, has been implemented in code. The power consumption of network topology has been calculated based on link loads and node/link status. Results are analysed with a set of shell scripts, and graphed.
C. Apply Weight Setting.
As discussed in [22] links become overloaded quickly as nodes are removed. The weight setting will apply in both algorithms to prevent this problem. The weight setting will be used to calculate new shortest paths that distribute traffic loads more evenly and link loads. The additional function, findOptimalLinkWeights, has been included after the respective remove node functions.
D. Results
The aim of this paper is to apply the two proposed algorithms and enhance their reduction of power by using the weight setting technique. So, this section introduces numerical results to investigate the performance of the proposed algorithms.
1. Lightest Node First Algorithm with Weight Setting:
The LNFWS algorithm prioritises nodes and uses the capacity of total connected links to the node to identify the node priorities as discussed in Section IV. Figure 4 depicts a scatter plot of network power consumption versus the total traffic demand.
The top cloud shows power consumption of an unmodified 8 nodes network, the clouds on the top cloud and below show results for optimised networks. Four distinct clouds can be identified. The key difference is the number of nodes that are active.
Figure 5 depicts the number of active nodes for the same data set. A comparison of cloud patterns in both graphs indicates that distinct clouds correspond to particular nodes numbers. For this example network of eight nodes, only four configurations with 3,6,7,8 nodes occur.
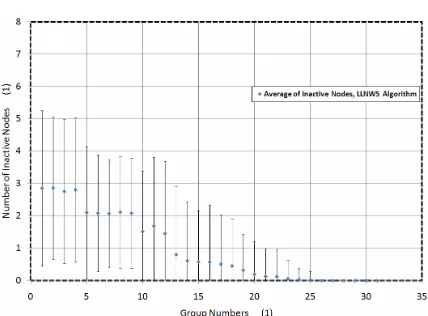
Figure 6 shows the number of inactive nodes versus demand groups. The bars indicate 95% confidence intervals. For lightly loaded networks a topology with 3 nodes is sufficient, highly loaded instances require 7 active nodes. However, the 8 active nodes mean that, the traffic load is high and the algorithm will not turned-off nodes to manage the traffic load.
[image:3.595.318.542.92.597.2]consumption of unmodified network. The effect is more pronounced for lightly loaded networks. This is expected as these provide more opportunities to turn nodes off.
Figure 4. Network power consumption, LNFWS algorithm
Figure 5. Active nodes, LNFWS algorithm
Figure 6. Grouped results, Inactive nodes, LNFWS algorithm
2. Least Loaded Nodes Algorithm With Weight Setting:
The LLNWS algorithm takes the load of network nodes into account. The same set of graphs is presented as for the other algorithm. Figure 7 depicts a scatter plot of energy consumption versus total demand for the original as well as the modified network.
intervals for this algorithm also suggest a higher variability in topologies for given traffic loads.
[image:4.595.312.542.146.661.2]Figure 7. Network power consumption, LLNWS algorithm
[image:4.595.328.536.151.274.2]Figure 8. Active nodes, LLNWS algorithm
Figure 9. Grouped results, Inactive nodes, LLNWS algorithm
E. Discussions
Both algorithms have a similar performance. However, it can be observed that the LNFWS algorithm produces more specific results for particular demand groups. The higher correlation between demand groups and number of active nodes are visible in Figure 4 and 6.
Figure 10 depicts a scatter plot of network power consumption versus the total traffic demand in case of LNF algorithm without applying weight setting. Figure 11 depicts a scatter plot of network power consumption versus the total traffic demand in case of LLN algorithm without applying weight setting techniques. Using weight setting techniques can reduce the consumption of the power in the optimal network topology
better than the algorithms that are not using weight setting technique.
The LFNWS algorithm and LLNWS algorithm are calculate the weight setting, shortest path and link load which lead to prevent the immediate link overloaded. This technique is helping to reduce the number of active nodes efficiently and as a consequence reduce the power consumption in the reduced network.
Group # 1 5 10 15 20
Original 5906 5920 5943 5965 5988 [W]
LLN 4026 4533 5597 5638 5994 [W]
Savings 32% 24% 6% 6% 0.38%
LLNWS 4026 4533 4948 5621 5891 [W]
Savings 32% 24% 17% 6% 2%
LNF 2851 3538 4610 5376 5977 [W]
Savings 52% 40% 23% 10% 1%
LNFWS 2851 3538 4610 5188 5776 [W]
Savings 52% 40% 23% 13% 4%
Table I
[image:4.595.58.269.260.410.2]Power Consumption [W] Of the 8 Node Network
Figure 10. Network power consumption, LNF algorithm
Figure 11. Network power consumption, LLN algorithm
[image:4.595.314.546.305.461.2] [image:4.595.57.271.432.590.2] [image:4.595.306.542.498.650.2]Moreover, the power saving in case of the two dynamic algorithms (LNFWS algorithm and LLNWS algorithm) is better than the two algorithms without using the weight setting technique.
IV. CONCLUSION
This paper presented two heuristics that uses weight setting technique to finding the optimal topologies for given traffic loads and improve the ability of reducing the power consumption for given algorithms (LLN, LNF algorithms). The results show that both algorithms successfully can find the optimal topology.
As a result, power consumption in the optimal topologies for both algorithms is similar and lower than energy consumption in the network topology. The effect is particularly prevalent for lightly and medium loaded networks. As networks operate at these load levels most of the time, dynamic topologies lead to significant power savings and reductions in GHG emissions.
Moreover, the applying of weight setting techniques has lead to enhance the power saving over the network topology by increasing the number of nodes that can be turned off. Further steps in this research are to investigate and develop mechanisms that allow the dynamic reconfiguration of networks under load.
References
[1] Webb, M., SMART 2020: Enabling the low carbon economy in the information age. 2008, The Climate group and Global e-Sustainability Initiative.
[2] Gartner. Gartner Says Data Centres Account for 23 Per Cent of Global {ICT} {CO2} Emissions. 2007. [3] Nedevschi, S.a.P., Lucian and Iannaccone, Gianluca
and Ratnasamy, Sylvia and Wetherall, David, Reducing network energy consumption via sleeping and rate-adaptation, in NSDI'08: Proceedings of the 5th USENIX Symposium on Networked Systems
Design and Implementation. 2008, USENIX
Association: San Francisco, California. p. 323--336. [4] Fraleigh, C.a.M., S. and Lyles, B. and Cotton, C. and
Khan, M. and Moll, D. and Rockell, R. and Seely, T. and Diot, S.C., Packet-level traffic measurements from the sprint ip backbone. Network, IEEE, Nov.-Dec. 2003. 17(6): p. 6-16.
[5] Gupta, M. and S. Singh, Greening of the Internet. Computer Communication Review, 2003. 33(4): p. 19-26.
[6] Gunaratne, C., K. Christensen, and B. Nordman, Managing energy consumption costs in desktop PCs and LAN switches with proxying, split TCP connections, and scaling of link speed. Int. J. Netw. Manag., 2005. 15(5): p. 297--310.
[7] Gupta, M. and S. Singh, Dynamic Ethernet Link Shutdown for Energy Conservation on Ethernet Links. Proceedings of IEEE ICC, 2007.
[8] Gupta, M. and S. Singh, Using Low-power Modes for Energy Conservation in Ethernet LANs. IEEE INFOCOM (Minisymposium), May 2007.
[9] Gupta, M., S. Grover, and S. Singh, A feasibility study for power management in LAN switches. The 12th IEEE International Conference on Network Protocols, October 2008.
[10] Ananthanarayanan, G. and R.H. Katz, Greening the Switch. USENIX HotPower, December 2008. [11] Baliga, J., et al., Energy consumption in access
networks. 2008 Conference on Optical Fiber Communication/National Fiber Optic Engineers Conference, Vols 1-8, 2008: p. 2089-2091
[12] Filip Idzikowski, S.O., Christian Raack, Hagen Woesner, Adam Wolisz, Saving energy in IP-over-WDM networks by switching off line cards in low-demand scenarios. 2010.
[13] Filip Idzikowski, S.O., Christian Raack, Hagen Woesner, Adam Wolisz, Power consumption of network elements in ip over wdm networks. TKN Group, 2009.
[14] Chiaraviglio, L.a.M., M. and Neri, F., Reducing
power consumption in backbone networks.
Communications, 2009. ICC '09. IEEE International Conference on, 2009: p. 1 -6.
[15] Yong Wu and Chiaraviglio, L.a.M., M. and Neri, F., Power-aware routing and wavelength assignment in optical networks. Optical Communication, 2009. ECOC '09. 35th European Conference on, Sep 2009: p. 1-2.
[16] Marsan, M.A., et al., Optimal Energy Savings in Cellular Access Networks. 2009 Ieee International Conference on Communication Workshops, Vols 1 and 2, 2009: p. 438-442
[17] Chiaraviglio, L., et al., Energy-Efficient Management of UMTS Access Networks. 2009 21st International Teletraffic Congress (Itc 21), 2009: p. 161-168 [18] Luca Chiaraviglio, D.C., Emilio Leonardi, Marco
Mellia, How Much Can The Internet Be Greened? 2009.
[19] Chiaraviglio, L., M. Mellia, and F. Neri, Energy-aware Backbone Networks: a Case Study. 2009 Ieee International Conference on Communication Workshops, Vols 1 and 2, 2009: p. 403-407
[20] Fortz, B. and M. Thorup, Optimizing OSPF/IS-IS weights in a changing world. Ieee Journal on Selected Areas in Communications, 2002. 20(4): p. 756-767.
[21] Kist, A.A. and A. Aldraho. Dynamic topologies for sustainable and energy efficient traffic routing. in ATNAC Conference. 2010. Auckland, New Zealand. [22] Aldraho, A. and A.A. Kist, Heuristics for Dynamic