MAL07133
Measuring Up for Big School:
A Role for Cognitive Development
Ms. Claire R. MALEY & Prof. Trevor G. BOND
School of Education
Abstract
For over 30 years, contention has surrounded the issue of preschool children’s readiness for formal
schooling. A Piagetian view is that the presence and use of particular operatory structures indicative of
the concrete operational stage of cognitive development are necessary for a child to achieve successful
learning outcomes in the new formal education environment of primary school. In any case, the
non-standardised skills-based checklists utilised by many preschool teachers to infer children’s levels of
readiness for year one seem ineffectual as the debate regarding children’s school readiness persists.
This paper reports on the findings from a research project in which forty-two preschool children
were administered a Piagetian conservation of number task as outlined in the work of Piaget and
Szeminska The child’s conception of number (1941/1952) using the Genevan méthode clinique.
Participants were also routinely assessed by their teachers using the preschool’s Key Indicators of
Readiness for Year One (KIRYO) Checklist and, in addition, then judged qualitatively on their
preschool and early year one performance by the respective teachers. Children’s performances on each
of the above-mentioned indicators were scored quantitatively using detailed performance criteria
derived explicitly from each item’s source. Rasch analysis using the Partial Credit Model indicated that
success on the conservation task was more closely aligned with children’s success in year one than was
mastery of the KIRYO Checklist indicators. The implications for professional discussion and
Introduction
Discussions of the transition from ‘preschool’ (the umbrella term used in this article to refer to all
prior-to-formal-schooling settings) to primary school year one often involve the idea of children’s
school readiness. Given that most preschool settings implement readiness screening of some kind, early
childhood educators consider readiness routinely as they plan learning experiences, evaluate progress,
and make qualitative judgements about children’s educational needs.
In formulating a readiness judgement preschool teachers often use skills-based,
teacher-developed readiness checklists or reports. The Key Indicators of Readiness for Year One (KIRYO)
Checklist used in this study was designed by the teachers of the preschool children and included
indicators derived from key texts in the early childhood education field. In addition to a checklist,
teachers often consider children’s social and emotional behaviour, development of fine and gross motor
skills, and willingness to ‘have a go’. It seems that preschool teachers, keen to see their excited little
charges progress to year one, are often reluctant to retain a possibly unready child in preschool for
another year.
On the other hand, year one teachers are faced with the task of trying to bring a new intake of
children to appropriate performance levels in year one curriculum areas such as Mathematics, English,
and the like. Hence, children’s curriculum content comprehension, intellectual maturity, and abilities to
adhere to class rules and routines appear to be of much more of an interest to year one teachers. To be
sure, the transition from the flexible, child-centred and play-based programs of preschool to the more
rigid, curriculum-focused structure of most year one classrooms is a dramatic change for many young
learners.
Indeed, parents rely on Government education policies and guidelines to ensure that their
children ‘hit the ground running’ when they begin formal learning experiences. Current reforms,
(which include raising the legal school entry age by six months), are indications of the recognition of
current inadequacies. The topic of school readiness is widely researched as children’s unreadiness
continues to be a problem for educators.
Somewhat surprisingly, however, is that the introduction of a ‘Prep’ year still fails to address
what other research projects have unequivocally established - that age is not an accurate indicator of
children’s readiness for success in formal school settings (Bond, 2001). A number of small-scale
research projects (e.g., Bond, 2003) have utilised successfully Rasch analysis and Piagetian theory to
determine that children’s levels of cognitive development say more about their abilities to achieve
successful learning outcomes in formal school settings than their birth date does.
The Issue of School Readiness
It is well established that children’s early learning experiences have both immediate and long-term
effects on their development, educational achievement and general life prospects (Bredekamp &
Copple, 1997; Briggs & Potter, 1999; Margetts, 2002; Maxwell & Clifford, 2004; Pianta &
Kraft-Sayre, 1999, 2003; Potter & Briggs, 2003; Slavin, 1994; Timberley, McNaughton, Howie & Robinson,
2003; Wasik & Karweit, 1994; Whitebread, 1996). Children’s capacities for success in early formal
learning experiences are influenced by a myriad of elements such as parent/caregiver/teacher
relationships, preschool to school continuity, levels of cognitive/physical/emotional/social development
and more. Discussion of children beginning school often leads to debate about their readiness for
school. Somewhat surprisingly, however, is the fact that most of the non-standardised
locally-developed checklists used to assess school readiness are based typically on children’s motor
development (such as running, hopping, climbing, cutting and threading) – which does not always
best described as “a series of qualitative changes in cognitive functioning rather than merely as the
quantitative increase in certain skills” (Baldwin, 1967, p. 86). Whilst it is beneficial for children to
possess well-developed motor skills for use in their early learning experiences, it stands as evident that
the concept of school readiness requires much more than that.
The literature concerning school readiness reveals the construct as problematic and difficult to
define (Cuskelly & Detering, 2003; Lockwood & Fleet, 1999). Indicative of the conflict surrounding
the issue, the term ‘school readiness’ is ambiguous - it describes the numerous different understandings
of the constituents of the state of preparedness necessary for children to be successful in adjusting from
less formal preschool settings to the more formal learning experiences presented in primary school. The
nation-wide inconsistency in both the legal school starting ages, and the diversity of names given to
describe the early education children receive before year one of primary school typifies the problem
inherent in the progression from informal to formal learning throughout Australia. As already
mentioned, in this study, the term ‘preschool’ represents all settings which children attend in the years
before formal school (in addition to traditional preschool services).
Recent research on school readiness reveals remarkable imbalance – the majority of it focuses
on adult perspectives and expectations of children’s school readiness and transitions (Broström, 2002;
Dockett & Perry, 2001; 2004). Given the well-established claim that young children are inherently
different from adults, it is surprising to observe that nearly all of the research produced to inform the
early childhood sector is, indeed, about children with little or no empirical evidence from research with
children.
In informing the school readiness debate, Piagetian theory would assert that successful
adjustment to, and achievement in, early formal learning experiences is dependent on the attainment of
certain intellectual structures indicative of the onset of the concrete operational stage of cognitive
development, the mental processes of assimilation and accommodation more easily allow equilibrium
between the child and the new formal school learning environment.
Piaget’s theory of cognitive development
Piagetian theory describes children’s intellectual development as progressing through an invariant
sequence of age-related (not age-dependent) stages of thinking: sensorimotor (birth to approximately 2
years), preoperational (approximately 2 to 7 years), concrete operational (approximately 7 to 11 years),
and formal operational (approximately 11 years onwards) (Ginsburg & Opper, 1988). Each cognitive
developmental stage is characterized by the construction of different psychological structures, each
new one of which enables a distinct and more effective type of interaction between the child and the
environment (Ginsburg & Opper, 1988; Elkind, 1981, 1986).
Of particular relevance to early childhood educators is children’s transition from Piaget’s
second stage, the preoperational stage, to the third, the concrete operational stage. Children inferred to
be thinking in Piaget’s preoperational stage of cognitive development are said to be ego-centric,
experience difficulty taking into account others points of view, and use language in qualitatively
different ways from those used by adults (Elkind, 1981; Smidt, 1998). Conversely, Piagetian theory
asserts that when a child attains concrete operational structures, s/he is then more easily able to
de-centre intellectually, take others points of view in to account, utilise more stable, systematic and logical
thought processes, and achieve a more stable equilibrium between self and the environment (Ginsburg
& Opper, 1988; Baldwin, 1980; Piaget, 1970; Smidt, 1998; Vernon, 1976; Wood, 1998).
It is this equilibrium – the progressive balancing of an organism with its environment – which
presents as significant to the issue of children’s school readiness. Adherents to Piagetian theory would
view children’s transition to year one as a “specific form of biological adaptation of a complex
organism to a [new] complex environment” (Flavell, Miller & Miller, 2002, p. 5). Thus, children
intellectually developed) are said to be more likely to achieve successful learning outcomes in a formal
Year One environment than those inferred to be in the preoperational stage of cognitive development
(Bond, 2001).
The Study
The study reported here aimed to provide empirical insights into the issue of preschool children's
school readiness by examining two different readiness indicators. Firstly, it verified the effectiveness of
one preschool’s Key Indicators of Readiness (KIRYO) Checklist as a current measure of readiness; and
second, it established the role of cognitive development as an alternate indicator of readiness. For this
purpose, a Piagetian conservation of number task was administered to each of the participating
preschool children adhering to the méthode clinique procedures as explicated by Piaget (1961, 1970).
Each participant’s performance on individual KIRYO Checklist indicators was also recorded, together
with qualitative judgements from both the preschool and successive year one teachers which provided
data on participating children’s actual levels of achievement in both settings.
Piaget’s conservation of number task
Piaget’s conservation of number task, administered using the Piagetian méthode clinique, is utilised
specifically to infer the presence and use of concrete operational developmental structures. The
conservation of number task is particularly apt for this project as number is the first physical concept a
child conserves; furthermore, it relates directly to early concepts in the formal year one mathematics
curriculum.
Conservation of number is demonstrated when a child understands that the equality of number of
two sets of objects is independent of the appearance of the two sets when either is perceptually
construct a second set (B) of objects from a first (A) using one-to-one correspondence, and can
conserve that equality (A=B) although one set might be arranged to appear longer or shorter than the
other. Both the child’s conservation judgement and its operational justification are jointly important, as
they reveal the thought processes that determine whether the child demonstrates conservation.
Method
Sample
Data were collected about 42 children from a preschool attached to a primary school in Queensland,
Australia. The sample size, although comparatively small, was sufficient to reflect trends in the data,
whilst remaining manageable in terms of time and resources constraints for the researcher. The sample
was randomly selected from a cohort of 100 preschool children. There were 18 girls and 24 boys, with
the children’s ages ranging from 4 years and 11 months to 5 years and 11 months.
Data Collection
In the last three weeks of the preschool year, each of the participants was individually interviewed and
administered the conservation of number task using the méthode clinique procedures as explicated by
Piaget (1961, 1970). Each interview lasted between 10 and 15 minutes approximately, and was
video-taped for later selective transcription and detailed analysis.
Each participant’s preschool performance was routinely assessed by the preschool teacher
according to the Key Indicators of Readiness for Year One (KIRYO) Checklist. As previously
mentioned, the KIRYO Checklist used in this study was developed by the experienced teachers of the
preschool children participating in this research project. It included indicators drawn from key texts in
the early childhood education field, with a strong focus on the development of fine and gross motor
skills (such as threading, cutting, running, jumping, hopping, etc.) . Children’s levels of development of
Children who achieved only, or mostly, the ‘satisfactory’ category were deemed ready for year one. On
the last day of the preschool year, each applicable checklist was photocopied, de-identified, and then
coded to maintain children’s anonymity. No form of screening for children’s cognitive development
levels was used by the preschool teachers.
To complement the above-described data, the preschool teachers were asked to provide
qualitative judgements concerning each participants overall level of readiness for year one. Based on
the teachers’ professional knowledge, each participant was inferred to be either, ‘not yet ready’, ‘nearly
ready’, or ‘ready’ for probable success in year one learning experiences. These judgements were
obtained on the last day of the preschool year, and recorded on a separate checklist for use by the
researcher.
In the last week of semester one in the following school year, the successive Year One teachers
were consulted to obtain data on the participants’ Year One achievement (i.e. about six months later).
These teachers were asked to provide two qualitative judgements which were used, in conjunction with
the three above-mentioned sources of data, to help determine the effectiveness of the KIRYO Checklist
and conservation task as indicators of readiness. The first of two qualitative judgements elicited
regarded each individual participant’s level of readiness for success in formal learning experiences as at
the beginning of the year. This judgement, similar to the preschool teachers’ judgement, was based on
the teachers’ professional knowledge of each participant whom they inferred to have been either, ‘not
yet ready’, ‘nearly ready’, or ‘ready’ for probable success in year one learning experiences. The second
judgement concerned each participant’s actual level of successful learning as at the end of semester
one. This final qualitative judgement was based on participants’ actual performance in year one
learning experiences which each was judged to be either, ‘not yet at level’, ‘almost at level’, or ‘at
level’ in their achievement of relevant Key Learning Area (KLA) outcomes. The year one teachers had
Data Analysis
To help determine the effectiveness of both the preschool’s KIRYO Checklist and Piaget’s
conservation of number task as indicators of school readiness, a key model in modern test theory was
utilised to analyse the raw data. The Rasch model is a quantitative, probabilistic measurement model
that can convert raw data from the participants’ KIRYO Checklist and conservation task performances
into equal-interval scales suitable for comparison (Bond & Fox, 2001).
The nature of the data necessitated the use of the Partial Credit Model (PCM) (Wright & Stone,
1979) of the Rasch model family. Partial Credit scoring of the data required the construction of four
sets of performance criteria: one each for the conservation task, preschool teachers’ KIRYO checklist;
the preschool teachers’ qualitative judgements; and the year one teachers’ qualitative judgements (see
Appendix A). Responses for each item, for all four sets of criteria, were divided into hierarchically
ordered levels of ability to which partial credit, for partial success, could be assigned. Items for this
project where either dichotomous (two criteria: i.e. ‘needs help’/’satisfactory’) or polytomous (three
criteria: i.e. ‘not yet ready’/’nearly ready’/’ready’). Thus, scoring was completed using a progressive
two-step (0, 1) or three-step (0, 1, 2) system as required by Rasch analysis and espoused by Bond and
Fox (2001).
Each item score was then transcribed to an individual student data line within a larger data file
inclusive of all children’s performances (see Appendix B). Each data line consisted of the following
types of data: the first two digits indicate the participant’s identifying code; the following thirteen digits
represent the participant’s score on the thirteen conservation of number items; the following 29 digits
represent the participant’s score on the 29 KIRYO Checklist indicators; the following digit represents
represent the scores applicable to the year one teachers’ two qualitative judgements (see example
below).
05 0001101210010 11111111111111111111111111111 2 22
Each data line represents the transformation of qualitative data to quantitative data, which can
then be subjected to Rasch analysis. Items for which there was no response were regarded as ‘missing
data’, and the data line presented a blank at the applicable point. The Rasch family of models can
utilise data files containing blanks as it will estimate ability and difficulty based on the available data.
The statistical analysis was completed using Quest software (Adams & Khoo, 1992), a computer
program developed from Rasch principles.
Results
The Rasch model’s unidimensionality principle requires items under consideration to measure only one
construct at a time: in this case, preschool children’s readiness for probable success in year one. The
efficacy of the Rasch analysis of the empirical data is determined largely by the degree of each item’s
fit to the construct being investigated. The Rasch model’s item fit statistics were used to confirm that
items did not breach this unidimensionality principle.
Fit Statistics
Item fit statistics are used to detect discrepancies between the Rasch model’s theoretical expectations of
item performance and the actual performance of that item according to the empirical data (Bond & Fox,
2001). Accepted values for the transformed t statistic of the infit and outfit mean square residuals range
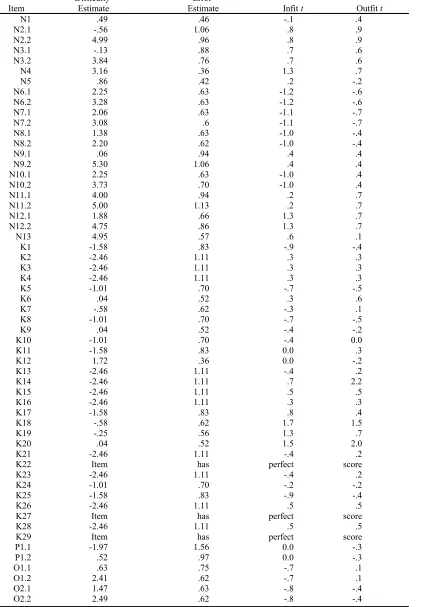
Rasch analysis of the 45 test items as a data set revealed infit t values of up to 1.7, with a coexisting
outfit t value of 1.5 for item K18. However, outfit t values peaked at 2.2 with a coexisting infit t value
of .7 for item K14, with the next highest being item K20 with infit t and outfit t values of 1.5 and 2.0
respectively. Whilst these uppermost infit t and outfit t statistics are recorded for KIRYO Checklist
items, the highest misfit estimate for item K14 sits just slightly outside the accepted fit statistic range,
indicating satisfactory test unidimensionality. The fit statistics indicated that both the KIRYO Checklist
and the conservation of number task were successful in investigating the single construct of school
readiness.
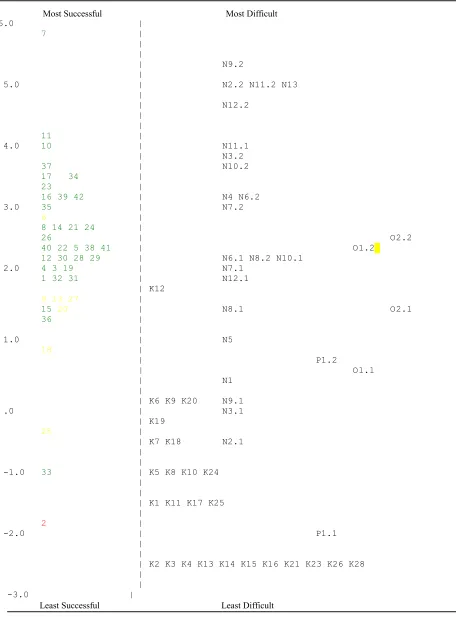
Person-Item Maps
Rasch analysis output from Quest produced a person-item variable map – a logit scale with person and
item performance estimates plotted along a single equal-interval continuum (see Figure 1). The logit
scale is displayed down the middle of the map, with test items and person ability estimates located to
the right and left of the scale, respectively. The value of each logit on the scale is equal (Bond & Fox,
2001), enabling inferences to made in regards to not only who is more able (or ready) than whom, but
more specifically, how much more able or ready. Person and item locations on the scale are determined
by the ability and difficulty estimates, respectively. A logit value of 0 is routinely set as the average,
thus items of above average difficulty are plotted as positive, while items of below average difficulty
are plotted as negative. Correspondingly, persons with ability above the average of the test items
appear in the positive part of the scale, and persons with ability below that average appear in the
negative part of the scale.
Each test item’s location on the logit scale is determined by its estimated threshold. An item
threshold is estimated at a point on the scale where a person of that estimated ability has a 50%
KIRYO Checklist items) have one item difficulty estimate plotted at the threshold where the
probability of scoring either 0 or 1 is 50% (Bond & Fox, 2001). Thus for item N1, scored using criteria
N1.0 and N1.1, the threshold between the two is ‘N1’ plotted at -2.04 logits separating the probability
of scoring 0 and 1 on that item (when analysed as part of the whole set of 45 test items). Anything
below that point relates to N1.0, and anything above, to N1.1. Items scored polytomously (i.e. N2, N3,
N6, N7, N8, N9, N10, N11, N12, P1, O1, O2) have two difficulty thresholds plotted to separate the
three response categories (0, 1, 2). For example, item N2, the criteria N2.0, N2.1, and N2.2 would be
separated by the two plotted thresholds N2.1 and N2.2.
The person-item map produced from Rasch analysis of the whole data set is displayed in Figure 1
(item difficulty and person ability estimates for all 45 items). The logit scale covers a span of nearly 9
logits, ranging from about -3.0 logits to +6.0 logits vertically with item difficulty and person ability
estimates plotted to the right and left respectively. When all data are considered collectively, item N9.2
(use of logical reasoning to consistently justify the invariance of the two sets in the number task)
plotted at +5.30 logits, presents as the most difficult criterion to satisfy. Items K2, K3, K4, K13, K15,
K16, K21, K23, K26, and K28 (indicators from the KIRYO Checklist), plotted at -2.46 logits, present
as the criteria least difficult to satisfy.
Figure 1 displays person ability estimates as numerals on the left-hand side of the person-item
map. Quest routinely represents each person ability location by an X, however, participant reference
codes were inserted on the variable map to assist interpretation. Case 7, located at +5.84 logits, is
clearly the most successful participant, whilst case 2, located at -1.93 logits, the least successful on
Figure 1
Item Difficulty and Person Ability Estimates for all 45 Items
Most Successful Most Difficult
6.0 |
7 |
|
|
| N9.2
|
5.0 | N2.2 N11.2 N13
|
| N12.2
|
|
11 |
4.0 10 | N11.1
| N3.2
37 | N10.2
17 34 |
23 |
16 39 42 | N4 N6.2
3.0 35 | N7.2
6 |
8 14 21 24 |
26 | O2.2
40 22 5 38 41 | O1.2
12 30 28 29 | N6.1 N8.2 N10.1
2.0 4 3 19 | N7.1
1 32 31 | N12.1
| K12
9 13 27 |
15 20 | N8.1 O2.1
36 |
|
1.0 | N5
18 |
| P1.2
| O1.1
| N1
|
| K6 K9 K20 N9.1
.0 | N3.1
| K19
25 |
| K7 K18 N2.1
|
|
-1.0 33 | K5 K8 K10 K24
|
|
| K1 K11 K17 K25
|
2 |
-2.0 | P1.1
|
|
| K2 K3 K4 K13 K14 K15 K16 K21 K23 K26 K28
|
|
-3.0 |
Note. Case colours indicate preschool teachers’ qualitative judgement of: ‘not yet ready’, ‘nearly ready’ and ‘ready’
Output Tables
Rasch analysis person-item maps present the relations between person ability and item difficulty only
(Bond & Fox, 2001). Error estimates, fit statistics for items and persons and the corresponding
reliabilities of these estimates are reported in the Quest output tables. Table 1 displays the item fit
statistics (for all 45 items), and Table 2 presents the corresponding output summary; Table 3 displays
Table 1
Rasch Analysis Results for all 45 Items
Item
Difficulty Estimate
Error
Estimate Infit t Outfit t
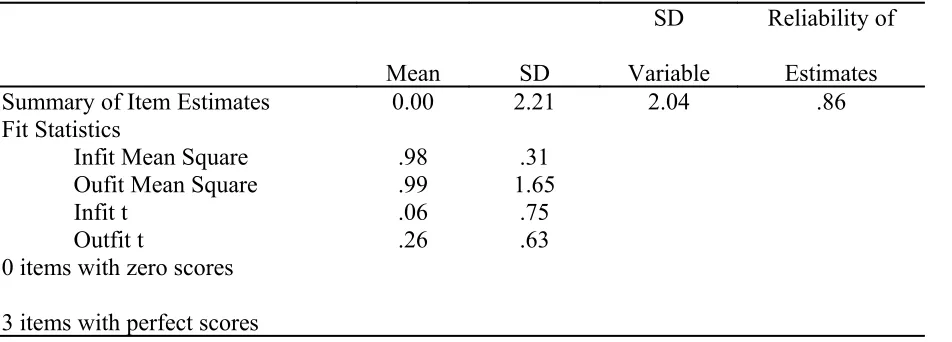
Table 2
Quest Output Summary of Item Estimates for All 45 Items
Mean SD
SD
Variable
Reliability of
Estimates
Summary of Item Estimates 0.00 2.21 2.04 .86
Fit Statistics
Infit Mean Square .98 .31
Oufit Mean Square .99 1.65
Infit t .06 .75
Outfit t .26 .63
0 items with zero scores
3 items with perfect scores
The Rasch model’s output tables present key information about the analysis of the whole data set.
Table 2 presents output data pertinent to item estimates. This summary reveals that the mean of item
estimates is located at 0 (by default), and that the standard deviation for item estimates is close to 2 (as
displayed in Figure 1, the majority of indictors are located between +2 and -2 logits). The reliability of
item difficulty estimates is reasonably high at 0.86 (on a scale of 0 to 1). The latter result refers to the
ability of the test to define a hierarchy of indicators along the interval scale; “[t]he higher the number,
the more confidence we can place in the replicability of item placement across other samples” (Bond &
Fox, 2001, p. 46). The annotation at the bottom of the output advises that all but three items (with
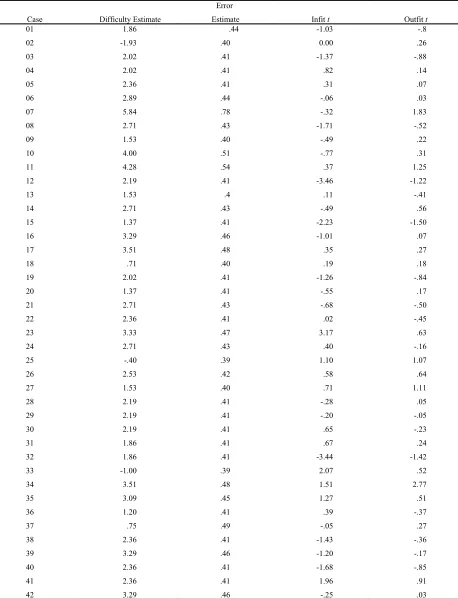
Table 3
Rasch Analysis Results for All 42 Cases
Case Difficulty Estimate
Error
Estimate Infit t Outfit t
Table 4
Quest Output Summary of Case Estimates for All 45 Items
Mean SD
SD
Variable
Reliability of
Estimates
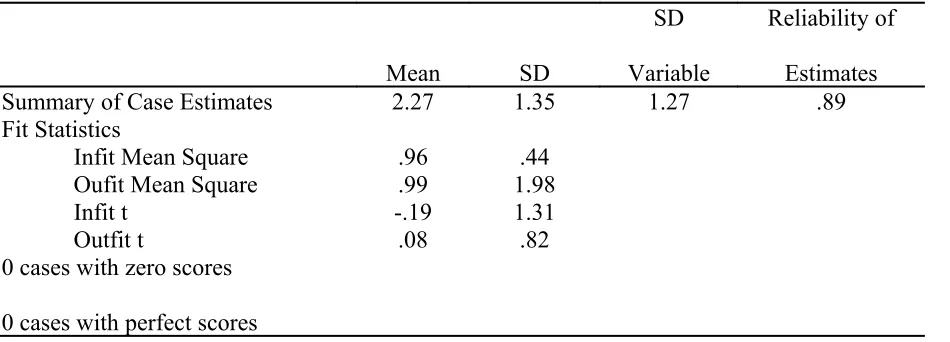
Summary of Case Estimates 2.27 1.35 1.27 .89
Fit Statistics
Infit Mean Square .96 .44
Oufit Mean Square .99 1.98
Infit t -.19 1.31
Outfit t .08 .82
0 cases with zero scores
0 cases with perfect scores
Table 4 presents the output table applicable to case estimates. The person ability estimate mean
of +2.27 indicates that this sample on average found this test (i.e., all 45 items together) particularly
easy, i.e the mean person performance is located more than one SD above the mean item difficulty. The
mean person ability estimate (i.e. the group average) would need to be closer to 0 to indicate a
well-matched test (Bond & Fox, 2001). The standard deviation of 1.35 reveals less spread of person
measures than that of the item measures. The reliability estimate of 0.89 indicates that the person
estimates reliability similar to that reported for items. This combined test is reasonably well targeted for
this sample; however, some more difficult items are needed to raise the upper limit of the test.
Furthermore, the least difficult items from the KIRYO Checklist would need to be revised to improve
their contribution to the test.
Just as test items should satisfy the Rasch model’s unidimensionality principle, so too should
test cases, to help ensure that each and every aspect of the test contributes meaningfully to the measure
of a single construct (Bond & Fox, 2001). The Rasch model produces transformed t statistics which can
pattern from a case, whereas positive values indicate more variation than expected from the Rasch
model in a case’s response pattern and are of greater importance to a developmentalist than are the
former (Bond & Fox, 2001).
Transformed t statistics for cases 12, 15, and 32 indicate that their response patterns did not fit the
Rasch model’s expectations. Case 12, plotted at +2.19 logits, has an infit t value of -3.46 and an outfit t
value of -1.22; case 15 (estimated ability +1.37 logits) produced an infit t of -2.23 and an outfit t of
-1.50; case 32 (estimated ability +1.86 logits) reveals an infit t of -3.44 and an outfit t of -1.42. The
above-mentioned cases were considered very predictable by the Rasch model as the “expectation is that
there will be a zone of uncertainty or unpredictability around the person’s level of ability” (Bond &
Fox, 2001, p. 178) which was not apparent in these cases.
Conversely, case 23 presents as more haphazard than predicted by the Rasch model. With an
estimated ability of +3.33 logits, case 23 has an infit t of +3.17 and an outfit t of +0.63 and, thus, is
detected as ‘erratic’ in relation to the Rasch model’s expectations. Review of the data reveals case 23 as
a high performer in the conservation of number task data and one of 15 perfect-status achievers in the
KIRYO Checklist data (see Figure 1). However, review of the Qualitative Judgements Chart reveals
that he was inferred to be, by his Year One teacher, ‘not yet ready’ for probable success in year one
learning experiences (as opposed to ‘ready’ as judged by the preschool teacher) and ‘not yet at level’ at
the end of semester one.
Indeed, the year one teacher who inferred case 23 to be ‘not yet ready’ at the beginning of the
year, and then acknowledged his level of successful achievement as ‘not yet at level’ despite his
evident high abilities (see Figure 1) showed significant insight in her professional judgement. Review
of this participant’s conservation task and KIRYO Checklist performances presented him in the top 3%
Table 4) revealed results in support of the year one teacher’s judgements. The fit statistics for case 23
(infit mn sq=+2.79; oufit mn sq=+1.08; infit t= +3.17; outfit t=+.63) indicates a performance detected
as erratic by the Rasch model’s expectations. The misfit indicators suggest that in spite of the high
overall score of case 23, some expected successes on easier items were in fact recorded as failures. This
erratic performance could have something to do with English being this child’s second language or the
fact that he had just moved to Australia only a few months prior to the testing. The data file for case 23
reveals that the child failed (unexpectedly) on items N4, N12, O1 and O2. Although the overall score of
the child implies readiness, the misfit suggests this score should not be taken at face value. It seems that
the year one teacher has a view of the child’s readiness which is sensitive qualitatively to the problem
detected by Rasch analysis quantitatively.
Targeting
In addition to investigating a single underlying construct, Rasch measurement requires that tests under
consideration also be suitably targetted to the sample to ensure that the relative difficulty of the items
informs the construct under investigation. Thus, for this part of the study, the conservation of number
task data and the KIRYO Checklist data were Rasch analysed separately to help infer which of the two
was a more suitably targetted test.
To be sure, the conservation of number task was found to be the most precisely targetted and
appropriate indicator of children’s school readiness (see Figure 2). Displaying the most accurate mean
person ability estimate mean of -.25 (SD=1.14) (close to 0), it stands as the best-matched test over and
above that of the KIRYO Checklist (3.08; SD=1.26), or the three sources of data together (2.27;
SD=1.35). Where only one child was completely unsuccessful on the conservation of number task
(achieving a 0 score all on items), 15 “topped out” with perfect scores on the KIRYO Checklist. This
conservation task. While this might be expected in a criterion referenced rather than norm-referenced
testing device, the results from year one teachers readiness judgements suggests that the readiness
criteria adopted in the KIRYO Checklist are as inappropriately easy for this sample as evidenced by the
foregoing comparison. Clearly, the results reveal that the conservation task is not only well targetted at
the sample in order to inform the construct it investigates it is, by far, the best targetted for the sample
of the three sources of readiness indicators. Conversely, the KIRYO Checklist is too easy and, thus,
less well-matched to accurately enlighten the construct under investigation. Thus, the Rasch model
revealed which of the conservation task or KIRYO Checklist corroborated a better targetted indicator
of the underlying latent variable. Given the evidence, Piaget’s conservation of number task stands to be
Figure 2
Targetting of Conservation of Number Task in Comparison to the KIRYO Checklist Indicators
Conservation of Number Task KIRYO Checklist Indicators
4.0 | | | | | | | X | 3.0 | | |
| 9.2 | 11.2 | 2.2 X | 13 | 12.2 2.0 |
| | X | |
| 11.1 XX | 3.2 | 10.2 1.0 |
XX |
| 6.2 XXXX |
| 4 7.2 X |
| .0 XXXX | | XX | |
XXXX | 6.1 8.2 10.1 | 7.1
XXXXXXXX |
| 12.1 -1.0 XXX |
| |
XXXX | 8.1 |
|
XX | 5 |
-2.0 | 1 X |
| |
X | 9.1 | 3.1 |
|
-3.0 | 2.1
4.0 | | | |
| 12 |
| | XXXXXXX | 3.0 | | | | XX | | | | X | 2.0 | | X | | |
| 6 9 20 |
| 19 | 1.0 | |
| 7 18 X |
| |
| 5 8 10 24 |
| | .0 X |
| 1 11 17 25 X |
| | | | | | -1.0 |
| 2 3 4 13 14 | | | | | | | -2.0 |
Well-targetted test with even dispersion of person and item locations along the readiness continuum. All thresholds could be fitted to the display.
Inter-relationships
Rasch analysis of the data revealed remarkable inter-relationships between the year one teachers’
qualitative judgements and Piaget’s conservation of number task. It seems that the Piagetian viewpoint
corresponds with the year one teachers’ judgement of ‘ready’ for year one. The consistent conservation
judgements (items N6.2, 7.2, and 8.2) (which are used in the conservation of number task to detect the
presence and use of concrete operatory structures in a child’s thinking) are located at this same ‘cut-off’
zone indicated by the shading in Figure 3. This empirical evidence suggests that an understanding of
logical systems is, indeed, a likely contributor to the successful achievement of learning outcomes in
early formal learning experiences; and, less equivocally, that Piaget’s theory of knowledge is relevant
to more completely understanding the nature of readiness for a successful transition from preschool to
primary school.
It is evident in this small-scale investigation that two key elements invoked for understanding
children’s success in early formal learning experiences (the preschool and year one teachers’
professional judgement of readiness) do not concur. The two logits difference between the preschool
and year one teachers’ judgements of ‘ready,’ together with the consensus of Piagetian theory and the
year one teachers understanding of school readiness, is evidence of the need for further investigation
into the understanding of readiness for success in year one that is held by these preschool teachers.
Indeed, the 29 indicators in the KIRYO Checklist based on social and motor skills do not present
as a complete set of constituents of readiness for successful learning outcomes in year one. The
empirical evidence herein reveals that a more comprehensive preschool readiness checklist would
benefit from the inclusion of cognitive developmental indicators in the Piagetian tradition, not just the
computer’. It is commonly said that cognitive development is not necessarily associated with an
Figure 3
Correlations between Conservation of Number Task and the Year One Teachers’ Qualitative Judgement of ‘ready’
6.0 |
7 |
|
|
| N9.2
|
5.0 | N2.2 N11.2 N13
|
| N12.2
|
|
11 |
4.0 10 | N11.1
| N3.2
37 | N10.2 17 34 |
23 |
39 16 42 | N4 N6.2
3.0 35 | N7.2
6 | 8 14 21 24 |
26 | O2.2
40 22 5 38 41 | O1.2
12 30 28 29 | N6.1 N8.2 N10.1 2.0 4 3 19 | N7.1
1 32 31 | N12.1
| K12
9 13 27 |
15 20 | N8.1 O2.1
36 |
|
1.0 | N5
18 |
| P1.2 O1.1
| N1
|
| K6 K9 K20 N9.1
.0 | N3.1
| K19
25 |
| K7 K18 N2.1
|
|
-1.0 33 | K5 K8 K10 K24
|
|
| K1 K11 K17 K25
|
2 |
-2.0 | P1.1
|
|
| K2 K3 K4 K13 K14 K15 K16 K21 K23 K26 K28
|
|
-3.0 |
Whilst it would be helpful for year one teachers if all children were able to apply glue to paper
neatly and possessed steadfast computer mouse skills, on this evidence, it is far more important for
children to be ready for successful learning outcomes if they aim to avoid trouble in later schooling. It
is widely accepted that success in early learning is a strong predictor of future successful schooling.
Thus, the transition from preschool to year one is a crucial time for all young learners and they deserve
the most appropriate of all tools on which judgements about their futures can be confidently made. The
strong empirical evidence of a continuum of readiness presented in this small-scale study provides
another example from the research at the School of Education at JCU of the functionality of the
Piagetian framework for education sectors.
The results suggest that preschool teachers need to extend their ideas about what it means to be
ready for successful learning outcomes in year one. Children’s actual levels of successful achievement,
as recorded half-way through year one, indicate that half the children were not ready in spite of the
preschool teachers’ professional judgement of ‘ready’. Or perhaps, the case may be that the year one
teachers were so concerned with syllabus content they continued to teach regardless of the lack of
readiness of the children in the classes. Regardless, the lack of a shared understanding of the concept of
readiness for year one amongst stakeholders is unacceptable. At best, it presents as a potentially serious
discontinuity in children’s learning experiences and teachers’ expectations at an important transitional
period.
The results of this study have highlighted several key areas where advances can be made.
Foremost, teachers’ judgements about children’s progression to year one should be more
developmentally sensitive and include an understanding of the Piagetian framework. In addition, the
inclusion of several indicators based on children’s understandings of logical systems, especially
children not yet ready for year one. Finally, all teachers should endeavour to be more responsive to the
varying levels of cognitive development in children of similar age ranges in their class.
Indeed, the results for the persons and items under investigation in this study indicate that
Piagetian theory and school readiness, together, are worthy of continued investigation.
Implications for Further Research
Foremost, the results of this research indicate the need for a similar study to be conducted with a larger
sample of preschool children. Whilst the sample investigated was large enough to reveal trends in the
data, another study including a greater spread of participant ability would be beneficial in informing the
readiness construct, and confirming the value of Piaget’s conservation of number task as an indicator of
References
Adams, R.J. & Khoo, S. T. (1993). Quest: The interactive test analysis system. Hawthorn: ACER.
Baldwin, A.L. (1967). Theories of child development, (2nd ed). New York: John Wiley & Sons.
Baldwin, A.L. (1980). Theories of child development, (2nd ed). New York: John Wiley & Sons.
Bond, T.G. (2003). Relationships between cognitive development and school achievement: A Rasch measurement approach. In R.F. Waugh (Ed.), On the forefront of educational psychology (pp. 37-46). New York: Nova Science Publishers.
Bond, T.G. (2001). Ready for School? Ready for learning? An empirical contribution to a perennial debate. The Australian Educational and Developmental Psychologist, 18(1), 77-80.
Bond, T.G. & Fox, C.M. (2001). Applying the rasch model: Fundamental measurement in the human sciences. Mahwah, New Jersey: Lawrence Erlbaum Associates, Inc.
Bredekamp, S. & Copple, C. (Eds.). (1997). Developmentally appropriate practice in early childhood programs, revised edition. Washington, DC: National Association for the Education of Young Children.
Briggs, F. & Potter, G. (1999). The early year of school: Teaching and learning (3rd ed). Frenchs
Forest: Pearson Education.
Broström, S. (2002). Communication and continuity in the transition from kindergarten to school. In H. Fabian & A. Dunlop (Eds.). Transitions in the early years. (pp. 52-63). London:
RoutledgeFalmer.
Clift, S., Stagnitti, K. & DeMello, L. (2000). A developmentally appropriate test of kinder / school readiness. Australian Journal of Early Childhood, 25(4), 22-26.
Dockett, S. & Perry, B (Eds.). (2001). Beginning school together: Sharing strengths. Watson, ACT: Australian Early Childhood Association.
Dockett, S. & Perry, B. (2004). What makes a successful transition to school? Views of Australian parents and teachers. International Journal of Early Years Education, 12(3), 217-230.
Drake, C. (1998). Judgments versus justifications in Piaget’s control of variables scheme. Unpublished Thesis. Townsville: James Cook University of North Queensland.
Elkind, D. (1981). The hurried child: Growing up too fast, too soon. Canada: Addison-Wesley Publishing Company.
Elkind, D. (1986). Formal education and early childhood education: An essential difference. Phi Delta Kappan, May, 631-636.
Flavell, J.H., Miller, P.H & Miller, S.A. (2002). Cognitive development (4th ed.). Upper Saddle River,
N.J.: Prentice Hall.
Ginsburg, H. & Opper, S. (1988). Piaget’s theory of intellectual development (3rd ed.). New Jersey:
Prentice Hall.
Lockwood, V. & Fleet, A. (1999). Attitudes towards the notion of preparing children for school. Australian Journal of Early Childhood, 24(3), 18-24.
Margetts, K. (2002). Planning transition programmes. In H. Fabian & A. Dunlop (Eds.). Transitions in the early years (pp. 111-122). London: RoutledgeFalmer.
Maxwell, K.L. & Clifford, R.M. (2004). School readiness assessment. Young Children, 59(1), 42-46.
Piaget, J. (1961). The child’s conception of number (2nd ed.). London: Routledge and Kegan Paul Ltd.
Piaget, J. (1970). The origin of intelligence in the child (3rd ed.). London: Routledge and Kegan Paul
Ltd.
Pianta, R. C. & Kraft-Sayre, M. (1999). Parents observations about their children’s transitions to kindergarten. Young Children, 54(3), 47-52.
Pianta, R. C. & Kraft-Sayre, M. (2003). Successful kindergarten transition: Your guide to connecting children, families & schools. Baltimore: Paul H. Brookes.
Potter, G. & Briggs, F. (2003). Children talk about their early experiences at school. Australian Journal of Early Childhood 28(3), 44-49.
Queensland Government. Department of Education and the Arts. (2002). Education and training reforms for the future: A white paper. [online]. Available:
http://education.qld.gov.au/etrf/whitepaper/pdfs/whitepaper.pdf
Queensland Government. Department of Education and the Arts. (2004). See the future: Preparing for school. [online]. Available: http://education.qld.gov.edu.au/etrf/pdf/prepinfosheet1v2.pdf
Queensland Government. Department of Education and the Arts. (2005). A new prep year for all Queenslanders. [online] Available:
http://education.qld.gov.au/etrf/pdf/prepinfosheetjune05rev.pdf
Slavin, R. E. (1994). Preventing early school failure: The challenge and the opportunity. In R. E. Slavin, N. L. Karweit & B. A. Wasik (Eds.). Preventing early school failure: Research, policy and practice. Massachusetts: Allyn & Bacon.
Smidt, S. (1998). A guide to early years practice. New York: Routlege.
Timperley, H., McNaughton, S., Howie, L. & Robinson, V. (2003). Transitioning children from early childhood education to school: Teacher beliefs and transition practices. Australian Journal of Early Childhood, 28(2), 32-38.
Vernon, P. E. (1976). Environment and intelligence. In V. P. Varma & P. Williams (Eds.). Piaget, psychology and education: Papers in honour of Jean Piaget. London: Hodder and Stoughton.
Wasik, B. A. & Karweit, N. L. (1994). Off to a good start: Effects of birth to three interventions on early school success. In R. E. Slavin, N. L. Karweit & B. A. Wasik (Eds.). Preventing early school failure: Research, policy and practice. Massachusetts: Allyn & Bacon.
Whitebread, D (Ed.). (1996). Teaching and learning in the early years (2nd ed). New York:
RoutledgeFalmer.
Wood, D. (1998). How children think and learn (2nd ed). Oxford: Blackwell.
Appendix A
Conservation of Number Performance Criteria Derived from The Child’s Conception of Number (Piaget, 1961) (from Drake, 1998, p. 45-46)
Item Stage I: Absence of
conservation Stage II: Intermediary reactions Stage III: Necessary conservation
N1 1.0 Incorrectly identifies the number of counters in the first set constructed.
1.1 Correctly identifies the number of counters in the first set constructed.
N2 2.0 Global comparison: Does not construct equivalent second set. Reliance on perceptual cues.
2.1 Intuitive correspondence: Constructs equivalent second set using one to one correspondence: set constructed is identical to first.
2.2 Operational correspondence: Constructs equivalent sets using one to one correspondences, without making both sets look identical.
N3 3.0 Constructs equivalent sets only with assistance.
3.1 Carefully constructs sets, checking to ensure equivalence.
3.2 Constructs equivalent sets easily and quickly with confidence.
N4 4.0 Counts the second array to determine the number of counters within it.
4.1 Infers that the second array must be composed of the same number of counters as the first. N5 5.0 Does not infer the
equivalence of the two arrays or infers the equivalence with assistance.
5.1 Infers the equivalence of the two arrays independently.
N6 6.0 Judges that the equivalence of the two sets is changed if the appearance of one set is lengthened.
6.1 Sometimes correctly judges that the equivalence of the two sets remains the same if the appearance of one set is lengthened.
6.2 Consistently judges that the equivalence of the two sets remains the same if the appearance of one set is lengthened.
N7 7.0 Judges that the equivalence of the two sets is changed if the appearance of one set is condensed.
7.1 Sometimes correctly judges that the equivalence of the two sets remains the same if the appearance of one set is condensed.
7.2 Consistently judges that the equivalence of the two sets remains the same if the appearance of one set is condensed.
N8 8.0 Judges that the equivalence of the two sets is changed when faced with the Müller-Lyer effect.
8.1 Sometimes correctly judges that the equivalence of the two sets remains the same when faced with the Müller-Lyer effect.
8.2 Consistently judges that the equivalence of the two sets remains the same when faced with the Müller-Lyer effect.
N9 9.0 Makes no justifications,
limited to judgements. 9.1 Uses illogical, inconsistent reasoning or counting to justify the variance or invariance of the two sets.
9.2 Uses logical reasoning to consistently justify the invariance of the two sets.
N10 10.0 Does not use identity
argument to justify belief. 10.1 Uses identity argument illogically or inconsistently to justify the variance or invariance of the two sets.
10.2 Justifies true belief referring to the identity argument.
N11 11.0 Does not use reversibility
argument to justify belief. 11.1 Uses reversibility argument illogically or inconsistently to justify the variance or invariance of the two sets.
11.2 Justifies true belief referring to the reversibility by inversion argument.
N12 12.0 Does not use compensation
argument to justify belief. 12.1 Uses compensation argument illogically or inconsistently to justify the variance or invariance of the two sets.
12.2 Justifies true belief referring to the compensation argument.
N13 13.0 Does not refer to the
necessary nature of conservation.
The 29 Key Indicators of Readiness for Year One (KIRYO) Checklist
Item Key Indicators
K1 Balancing
K2 Running
K3 Jumping
K4 Climbing (scramble net)
K5 Hopping
K6 Skipping
K7 Kicking a ball
K8 Throwing / catching a ball
K9 Cutting
K10 Threading
K11 Gluing
K12 Pencil grip
K13
K14
K15
Mouse control on computer
Expresses needs, feelings & ideas
Comprehends messages spoken or visual
K16 Makes independent choices
K17 Persists with tasks copes with failure K18 Mixes well with other children
K19 Understands the purpose of group rules and complies K20 Shares, takes, turns, negotiates roles and resolves conflicts K21 Sorts and matches objects by colour
K22 Names and matches basic colours K23 Copies basic pattern eg. 2 colour pattern
K24 Drawing ability
K25 Completes a 9 piece puzzle using a variety of strategies K26 Gives simple descriptions of past events
K27 Uses own grammar style, which is approximation of adult grammar
K28 Is beginning to develop awareness of listener needs and provides feedback on information when introducing a
new topic
Preschool Teachers’ Qualitative Judgements about Student Progression to Year One
Item Stage I: Stage II: Stage III:
P1 30.0 “Not yet ready” for probable success in year one
30.1 “Nearly ready” for probable success in year one
30.2 “Ready” for
probable success in year one
Year One Teachers’ Qualitative Judgements about Student Progression to Year ONE
Item Stage I Stage II Stage III
O1 31.0 “Not yet ready” for probable success in year one
31.1 “Nearly ready” for probable success in year one
31.2 “Ready” for
probable success in year one
O2 32.0 “Not yet at level” in achievement of year one KLA outcomes
32.1 “Nearly at level” in achievement of year one KLA outcomes
Appendix B
Data File of Participants’ Scores