2
Learner Outcome Measures for Further Education,
Work-Based Learning and Adult Community Learning: 2014/15
The latest figures on learner outcomes in the Further Education (FE), Work-based Learning (WBL) and Adult Community Learning (ACL) sectors in Wales show:
The overall learning activity success rate for FE in 2014/15 was 86 per cent. The WBL apprenticeship framework success rate was 82 per cent.
The overall learning activity success rate for ACL was 88 per cent.
Chart 1: Trends in learner outcomes
0% 10% 20% 30% 40% 50% 60% 70% 80% 90% 100%
FE Success WBL Framework Success ACL Success
2012/13 2013/14 2014/15
In 2011/12, a set of data management principles were issued to learning providers to address
inconsistencies in the recording of data. Pages 5 to 7 of this release provide further detail regarding the continuing impact of these principles on national figures.
SDR 44/2016 7 April 2016
Statistician: Jonathan Ackland Tel: 029 2082 5067 E-mail: [email protected] Next update: April 2017 (provisional)
2
Outcomes in further education
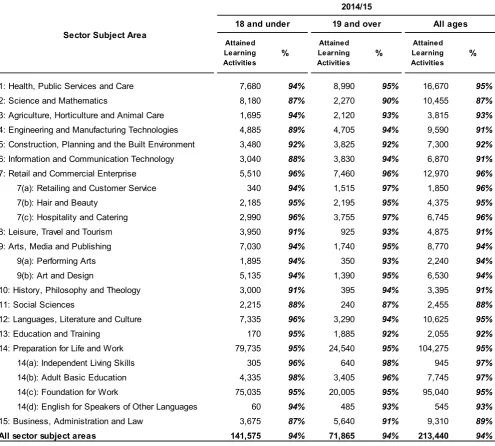
Across all further education programmes in 2014/15, 91 per cent of learning activities were completed and of those activities with an assessable outcome, 94 per cent were attained. Overall, 86 per cent of learning activities were successfully completed and attained.
In 2014/15 a new Post-16 Planning and Funding Framework was introduced, based on programmes of learning designed to support progression to further learning or employment. Each programme
comprises one or more main qualifications (such as A Levels or a BTEC Diploma), together with additional qualifications which support the development of essential skills and help ensure that the individual learner’s needs are met. This year, we are publishing completion, attainment and success measures based on main qualifications for the first time. 82 per cent of main qualifications were successfully completed and attained. The success rate for main qualifications is 4 percentage points lower than the success rate for all qualifications.
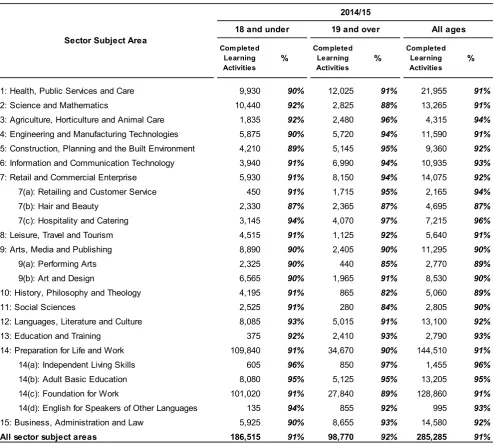
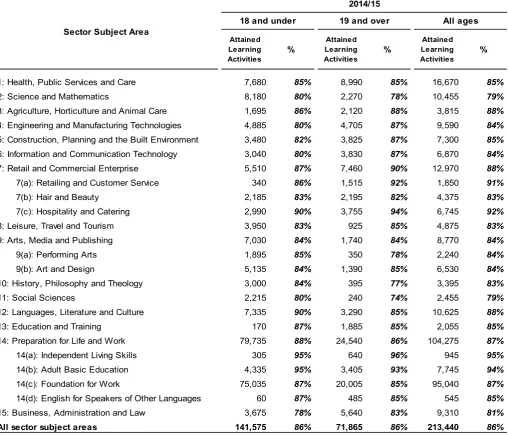
Analysis of FE success rates by sector/subject area (Chart 2) shows that:
Success rates were highest in the areas of Independent Living Skills; Adult Basic Education; Hospitality and Catering; Retailing and Customer Service; and Languages, Literature and Culture.
Success rates were lowest in the areas of Social Sciences; Science and Mathematics; Business Administration and Law; Hair and Beauty; and History, Philosophy and Theology.
Chart 2: FE learning activity success rates by sector/subject area, 2014/15
0% 10% 20% 30% 40% 50% 60% 70% 80% 90% 100%
3
Analysis of FE success rates by learner age group shows that:
There was no difference in overall success rates for learners aged 18 and under and those aged 19 and over;
Success rates were the same rates for learners aged 18 and under and those aged 19 and over at notional level 1, higher for learners aged 19 and over at notional level 2 and higher for learners aged 18 and under at notional level 3;
Learners aged 19 and over had higher success rates for Entry level but not for ‘Short course’ provision, unlike in the previous year.
See tables 1a – 1c, 2a – 2c and 3 for further information.
Outcomes in work-based learning
Learners on apprenticeship programmes have to achieve a range of qualifications in order to gain the full apprenticeship ‘framework’. In 2014/15, 82 per cent of learners across all Foundation
Apprenticeship, Apprenticeship and Higher Apprenticeship programmes achieved this.
In 2012/13, an increase in the number of apprenticeship programmes ending within 8 weeks without completion was observed.Additionally, this year saw a large increase in the number of transferred apprenticeship programmes. The ongoing impact of these data issues on the apprenticeship framework success rate is outlined in detail on pages 7 to 9 of this release.
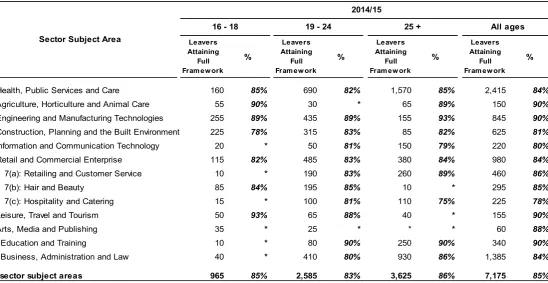
For Wales as a whole and for the majority of sector/subject areas, the success rate for Apprenticeships was higher than for Foundation Apprenticeships. Overall, the best performing areas were Education and Training; Agriculture, Horticulture and Animal Care; Engineering and Manufacturing
Technologies; and Leisure, Travel and Tourism.
4
Chart 3: WBL framework success rates by sector/subject area, 2014/15
0% 10% 20% 30% 40% 50% 60% 70% 80% 90% 100%
Foundation Apprenticeships Apprenticeships Higher Apprenticeships
Analysis of learner destinations during the three month period following the end of an Adult Employability programme shows that 57 per cent of leavers from Adult Employability programmes had a positive progression (ie. to employment (including self-employment or voluntary work) or further learning).
See tables 4a – 4d and 5 for further information.
Due to a change in definition during the course of the data collection year it has not been possible to provide information on the destinations of traineeship leavers as in previous years – see Notes for further information.
Outcomes in adult community learning
The following chart shows that there was some variation across the different types of ACL provision for all three learner outcome measures in 2014/15. Further analysis of the underlying data suggests that at least some of this variation can be attributed to inconsistent approaches to the recording of LLWR data. The variation was greater in 2014/15 than in 2013/14, with the ‘Other ACL delivered by FEIs’ provision having both attainment and success rates that were greater by 10 percentage points than those for the other two types of ACL provisions. Further information is provided in section 4.2 of the notes
5
Chart 4: ACL learner outcome measures by type of provision, 2014/15
0% 10% 20% 30% 40% 50% 60% 70% 80% 90% 100%
Directly Delivered by LAs Delivered by LAs via FEI franchise Other ACL delivered by FEIs
% Completion % Attainment % Success
Analysis of learner outcome measures by level and subject (see tables) showed that:
Completion rates for provision directly delivered by local authorities were highest for level 2 learning aims. Completion rates for provision delivered via a FE institution franchise or other ACL provision delivered by FE institutions were highest for learning aims at other levels and level 2 respectively;
Success rates for provision directly delivered by local authorities were highest for level 2 learning aims and lowest for learning aims at other levels. Success rates for provision delivered via a FE institution franchise or other ACL provision delivered by FE institutions were highest for level 2 and level 1 learning aims respectively.
Success rates varied across subject areas. Aside from ‘Other’ subject area, the highest success rates were in Arts, Media and Publishing; and English for Speakers of Other Languages.
See tables 7, 8 and 9 for further information.
Data Management Principles
6
These principles provided clarification on a number of data management issues, particularly the circumstances in which LLWR records can be deleted as well as on matters such as recording transfers. Both the deletion of LLWR records and the incorrect recording of transfers can contribute to an
undercount of terminated learning activities and/or learning programmes and therefore potentially inflate the success rates detailed within this output.
Analysis has been undertaken to continue to determine the impact of the guidelines on submitted data. The following table compares the number of learning activities in the FE success rate denominator against an earlier freeze of the LLWR data.
LLWR freeze taken September 2015
Statistical Release freeze (taken February
2016)
Entry Level 16,225 14,370 -11.5
Level 1 45,820 44,250 -3.4
Level 2 87,765 84,760 -3.4
Level 3 94,885 96,585 1.8
Level 4 1,280 1,130 -11.9
Unknown Level 4,010 3,585 -10.6
Other Short 4,975 4,435 -10.9
All learning aims 254,970 249,105 -2.3
Source: Lifelong Learning Wales Record (LLWR)
Level
No. of Assessable, Terminated Learning Activities
% Difference
This table shows a decrease in the total number of learning activities comprising the FE success rate denominator. However, analysis at an institutional level reveals substantial variation. Just under one third of all institutions have differences of less than ± 3 per cent. But nearly two fifths of institutions have differences of more than ± 8 per cent. This variation indicates the correction of underlying data-issues as well as the consolidation of data following institution mergers.
Similar analysis was also undertaken to compare the numbers of WBL learning programmes against earlier freezes of LLWR data. This analysis showed that the numbers of WBL learning programmes have steadily increased when compared to earlier LLWR freezes. This suggests further completion and
correction of data fields (in particular, the end date of learning programme).
7
Proportion of FE learning activities recorded as continuing or transferred, by learning aim level and academic year
2010/11 2011/12 2012/13 2013/14 2014/15 2010/11 2011/12 2012/13 2013/14 2014/15
Entry Level 0.9 0.5 0.4 0.9 0.1 5.8 4.3 3.0 3.5 6.0
Level 1 0.6 0.5 0.5 1.4 0.3 6.4 4.8 4.3 3.9 5.2
Level 2 0.9 0.8 0.7 1.5 0.7 8.2 5.9 4.5 4.1 4.2
Level 3 0.9 0.9 0.8 0.9 1.0 8.3 5.9 5.8 4.0 3.4
Level 4 6.4 4.5 2.3 8.2 9.8 10.9 8.0 15.5 10.2 5.7
Unknown Level 1.1 1.4 0.5 1.2 0.2 2.6 3.6 4.6 1.6 3.7
Other Short 0.3 0.3 0.2 0.3 0.6 0.6 0.3 0.3 0.3 0.2
All learning aims 0.8 0.7 0.6 1.2 0.7 6.8 5.0 4.4 3.7 4.0
Source: Lifelong Learning Wales Record (LLWR)
Level
% of Continuing Learning Activities % of Transferred Learning Activities
Proportion of WBL apprenticeship programmes recorded as continuing or transferred, by programme type and academic year
Proportion of WBL learning programmes recorded as either continuing or transferred by type and academic year
2010/11 2011/12 2012/13 2013/14 2014/15 2010/11 2011/12 2012/13 2013/14 2014/15
Foundation Apprenticeship 0.7 0.1 0.1 0.0 0.0 3.7 2.2 4.9 3.9 8.3
Apprenticeship 1.2 0.2 0.2 0.1 0.1 3.1 2.0 4.9 3.4 9.3
All Apprenticeships 0.9 0.1 0.1 0.1 0.1 3.4 2.1 4.9 3.7 8.7
Source: Lifelong Learning Wales Record (LLWR) % of Transferred Learning Programmes Type of Learning
Programme
% of Continuing Learning Programmes
In general, it seems that the data management principles continue to have some impact on the
submission of LLWR data. However, analysis suggests that inconsistencies remain in the recording of data (at least partly attributable due to the consolidation of LLWR returns following provider mergers). This year saw an increase in transferred WBL learning programmes of around 5 percentage points. This is attributable to the start of a new WBL contract period on 1 April 2015 and a requirement placed on providers by the Welsh Government to record learners against the correct WBL provider according to the new contract arrangements. Excluding these transfers, the percentage of transferred WBL learning programmes was 2.6 per cent for 2014/15.
WBL Framework Success Rate
When deriving the WBL apprenticeship framework success rates detailed in tables 4a to 4d of this release, learning programmes are excluded from the calculation in the following circumstances:
8
Analysis is undertaken annually to monitor the numbers of exclusions and determine whether they fall within acceptable thresholds.
A marked increase in ‘early drop outs’ was observed between 2012/13 and 2013/14, potentially indicating an inflation of the apprenticeship framework success rate for 2012/13. Following careful consideration, the decision to publish this data was made. However, pending further analysis and investigation of this issue, caution in the use of this data was advised.
Following publication, Welsh Government officers liaised with the learning provider network to investigate this issue in detail. In summary, it was felt that the increase in ‘early drop outs’ was largely attributable to the marked increase in apprenticeship starts (i.e. the number of apprenticeship
programmes commencing during the academic year) in 2012/13. Further to this, it was predicted that the proportion of ‘early drop outs’ would decrease and stabilise in future years. This decrease has been observed over the last two years and is shown in the following table.
The following table shows the numbers and proportions of different types of exclusions in 2014/15 compared with previous years.
No. % No. % No. % No. % No. %
Early drop-out 1,050 5.7 830 4.9 2,000 10.6 1,695 7.3 1,120 4.9
Continuing learning programme 165 0.9 25 0.1 25 0.1 15 0.1 10 0.1
Transferred learning programme 635 3.4 365 2.1 930 4.9 845 3.7 2,000 8.7
Learner redundancy 300 1.6 300 1.8 390 2.1 460 2.0 315 1.4
Learner death 10 0.0 5 0.0 * 0.0 10 0.0 10 0.0
Total exclusions 2,150 11.7 1,525 8.9 3,350 17.7 3,030 13.1 3,455 15.1
Total terminated learning programmes 18,410 17,075 18,875 23,100 22,900
Source: Lifelong Learning Wales Record (LLWR)
2014/15 2013/14
2012/13 Reason for exclusion 2010/11 2011/12
As anticipated, this table shows that the proportion of ‘early drop outs’ have decreased between 2012/13 and 2014/15. All other categories of exclusion have also decreased, with the exception of transferred learning programmes. The number of transferred learning programmes in 2014/15 was more than double than in 2013/14. This has resulted in an overall increase in total exclusions of two percentage points between 2013/14 and 2014/15.
9
Chart 5: Trends in leavers from Apprenticeship programmes
0 5000 10000 15000 20000 25000
2008/09 2009/10 2010/11 2011/12 2012/13 2013/14 2014/15
Foundation Apps Apps All Apps
10
Tables
Tables 1a – 1c Completion, attainment and success rates for FE provision by notional level, broad type of learning aim and age group
Tables 2a – 2c Completion, attainment and success rates for FE provision by sector/subject area and age group
Table 3 Completion, attainment and success rates for main qualifications in FE by qualification type
Tables 4a – 4d Framework success rates for WBL provision by sector/subject area, type of programme and age group
Table 5 Destinations of leavers from Adult Employability programmes in the period up to three months following the end of learning
Table 6 Learning activity success rates for WBL provision by programme, broad type of learning aim and age group
Table 7 Completion, attainment and success rates for ACL provision by type of provision and notional level
Table 8 Completion, attainment and success rates for ACL provision by type of provision and age group
11
Table 1a - Completion rates for FE provision by notional level, broad type of learning aim and age group
Com pleted Learning Activities
%
Com pleted Learning Activities
%
Com pleted Learning Activities
%
Entry Level 9,420 92% 8,630 95% 18,050 93%
Level 1 NVQ1 660 88% 565 92% 1,225 90%
QCF Award 2,110 90% 1,210 89% 3,320 89%
QCF Certificate 1,230 89% 550 88% 1,785 89%
QCF Diploma 3,695 87% 965 86% 4,660 87%
Key Skills / Essential Skills Wales 13,355 90% 3,705 89% 17,055 90%
Quality Assured Lifelong Learning2 1,625 92% 2,645 94% 4,265 93%
Other 10,805 93% 7,035 94% 17,840 93%
All 33,480 91% 16,675 92% 50,150 91%
Level 2 GCSE/VCE 2,465 89% 1,585 87% 4,050 88%
NVQ1 1,595 89% 2,540 91% 4,135 90%
QCF Award 6,465 95% 8,365 97% 14,825 96%
QCF Certificate 1,565 88% 3,045 86% 4,610 87%
QCF Diploma 5,145 86% 2,735 83% 7,885 85%
Key Skills / Essential Skills Wales 23,960 91% 6,545 88% 30,505 91%
Quality Assured Lifelong Learning2 1,345 93% 2,075 93% 3,415 93%
Other 10,125 91% 5,205 92% 15,330 91%
All 52,665 91% 32,085 92% 84,755 91%
Level 3 A/AS/A2 Level 20,165 92% 1,185 85% 21,345 92%
NVQ1 285 90% 1,250 89% 1,535 90%
QCF Award 980 96% 3,250 96% 4,230 96%
QCF Certificate 1,285 88% 1,445 88% 2,730 88%
QCF Diploma 11,515 89% 4,475 86% 15,985 88%
Key Skills / Essential Skills Wales 28,020 94% 5,430 91% 33,455 93%
Quality Assured Lifelong Learning2 1,340 93% 795 96% 2,135 94%
Other 12,155 91% 4,585 86% 16,740 89%
All 75,745 92% 22,410 89% 98,155 91%
Level 4+ 15 * 990 89% 1,005 89%
Level Not Known 12,355 87% 6,465 88% 18,820 88%
Other Short 2,835 100% 11,510 100% 14,345 100%
All learning aims 186,515 91% 98,770 92% 285,285 91%
Source: Lifelong Learning Wales Record (LLWR)
1 Includes QCF qualifications that directly replace NVQs 2 Formerly known as OCNs
Type of learning aim Level
2014/15
12
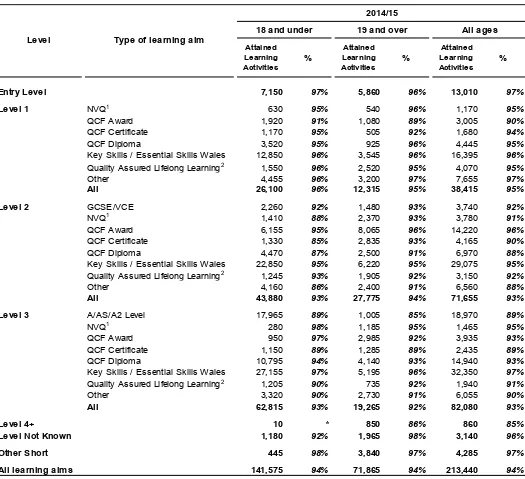
Table 1b - Attainment rates for FE provision by notional level, broad type of learning aim and age group
Attained Learning Activities
%
Attained Learning Activities
%
Attained Learning Activities
%
Entry Level 7,150 97% 5,860 96% 13,010 97%
Level 1 NVQ1 630 95% 540 96% 1,170 95%
QCF Award 1,920 91% 1,080 89% 3,005 90%
QCF Certificate 1,170 95% 505 92% 1,680 94%
QCF Diploma 3,520 95% 925 96% 4,445 95%
Key Skills / Essential Skills Wales 12,850 96% 3,545 96% 16,395 96%
Quality Assured Lifelong Learning2 1,550 96% 2,520 95% 4,070 95%
Other 4,455 96% 3,200 97% 7,655 97%
All 26,100 96% 12,315 95% 38,415 95%
Level 2 GCSE/VCE 2,260 92% 1,480 93% 3,740 92%
NVQ1 1,410 88% 2,370 93% 3,780 91%
QCF Award 6,155 95% 8,065 96% 14,220 96%
QCF Certificate 1,330 85% 2,835 93% 4,165 90%
QCF Diploma 4,470 87% 2,500 91% 6,970 88%
Key Skills / Essential Skills Wales 22,850 95% 6,220 95% 29,075 95%
Quality Assured Lifelong Learning2 1,245 93% 1,905 92% 3,150 92%
Other 4,160 86% 2,400 91% 6,560 88%
All 43,880 93% 27,775 94% 71,655 93%
Level 3 A/AS/A2 Level 17,965 89% 1,005 85% 18,970 89%
NVQ1 280 98% 1,185 95% 1,465 95%
QCF Award 950 97% 2,985 92% 3,935 93%
QCF Certificate 1,150 89% 1,285 89% 2,435 89%
QCF Diploma 10,795 94% 4,140 93% 14,940 93%
Key Skills / Essential Skills Wales 27,155 97% 5,195 96% 32,350 97%
Quality Assured Lifelong Learning2 1,205 90% 735 92% 1,940 91%
Other 3,320 90% 2,730 91% 6,055 90%
All 62,815 93% 19,265 92% 82,080 93%
Level 4+ 10 * 850 86% 860 85%
Level Not Known 1,180 92% 1,965 98% 3,140 96%
Other Short 445 98% 3,840 97% 4,285 97%
All learning aims 141,575 94% 71,865 94% 213,440 94%
Source: Lifelong Learning Wales Record (LLWR)
1 Includes QCF qualifications that directly replace NVQs 2 Formerly known as OCNs
Type of learning aim Level
2014/15
13
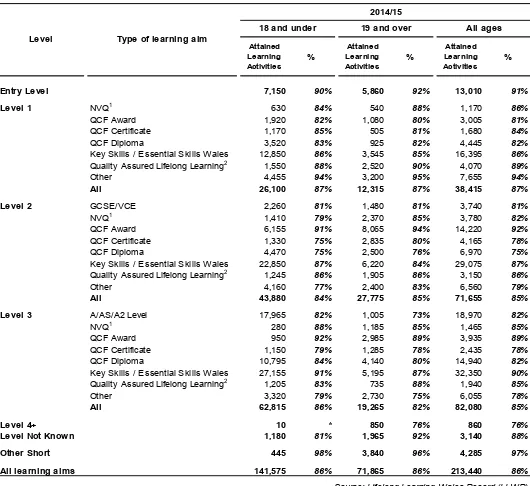
Table 1c - Success rates for FE provision by notional level, broad type of learning aim and age group
Attained Learning Activities
%
Attained Learning Activities
%
Attained Learning Activities
%
Entry Level 7,150 90% 5,860 92% 13,010 91%
Level 1 NVQ1 630 84% 540 88% 1,170 86%
QCF Award 1,920 82% 1,080 80% 3,005 81%
QCF Certificate 1,170 85% 505 81% 1,680 84%
QCF Diploma 3,520 83% 925 82% 4,445 82%
Key Skills / Essential Skills Wales 12,850 86% 3,545 85% 16,395 86%
Quality Assured Lifelong Learning2 1,550 88% 2,520 90% 4,070 89%
Other 4,455 94% 3,200 95% 7,655 94%
All 26,100 87% 12,315 87% 38,415 87%
Level 2 GCSE/VCE 2,260 81% 1,480 81% 3,740 81%
NVQ1 1,410 79% 2,370 85% 3,780 82%
QCF Award 6,155 91% 8,065 94% 14,220 92%
QCF Certificate 1,330 75% 2,835 80% 4,165 78%
QCF Diploma 4,470 75% 2,500 76% 6,970 75%
Key Skills / Essential Skills Wales 22,850 87% 6,220 84% 29,075 87%
Quality Assured Lifelong Learning2 1,245 86% 1,905 86% 3,150 86%
Other 4,160 77% 2,400 83% 6,560 79%
All 43,880 84% 27,775 85% 71,655 85%
Level 3 A/AS/A2 Level 17,965 82% 1,005 73% 18,970 82%
NVQ1 280 88% 1,185 85% 1,465 85%
QCF Award 950 92% 2,985 89% 3,935 89%
QCF Certificate 1,150 79% 1,285 78% 2,435 78%
QCF Diploma 10,795 84% 4,140 80% 14,940 82%
Key Skills / Essential Skills Wales 27,155 91% 5,195 87% 32,350 90%
Quality Assured Lifelong Learning2 1,205 83% 735 88% 1,940 85%
Other 3,320 79% 2,730 75% 6,055 78%
All 62,815 86% 19,265 82% 82,080 85%
Level 4+ 10 * 850 76% 860 76%
Level Not Known 1,180 81% 1,965 92% 3,140 88%
Other Short 445 98% 3,840 96% 4,285 97%
All learning aims 141,575 86% 71,865 86% 213,440 86%
Source: Lifelong Learning Wales Record (LLWR)
1 Includes QCF qualifications that directly replace NVQs 2 Formerly known as OCNs
Type of learning aim Level
2014/15
14
Table 2a - Completion rates for FE provision by sector subject area and age group
Completed Learning Activities
%
Completed Learning Activities
%
Completed Learning Activities
%
1: Health, Public Services and Care 9,930 90% 12,025 91% 21,955 91%
2: Science and Mathematics 10,440 92% 2,825 88% 13,265 91%
3: Agriculture, Horticulture and Animal Care 1,835 92% 2,480 96% 4,315 94%
4: Engineering and Manufacturing Technologies 5,875 90% 5,720 94% 11,590 91%
5: Construction, Planning and the Built Environment 4,210 89% 5,145 95% 9,360 92%
6: Information and Communication Technology 3,940 91% 6,990 94% 10,935 93%
7: Retail and Commercial Enterprise 5,930 91% 8,150 94% 14,075 92%
7(a): Retailing and Customer Service 450 91% 1,715 95% 2,165 94%
7(b): Hair and Beauty 2,330 87% 2,365 87% 4,695 87%
7(c): Hospitality and Catering 3,145 94% 4,070 97% 7,215 96%
8: Leisure, Travel and Tourism 4,515 91% 1,125 92% 5,640 91%
9: Arts, Media and Publishing 8,890 90% 2,405 90% 11,295 90%
9(a): Performing Arts 2,325 90% 440 85% 2,770 89%
9(b): Art and Design 6,565 90% 1,965 91% 8,530 90%
10: History, Philosophy and Theology 4,195 91% 865 82% 5,060 89%
11: Social Sciences 2,525 91% 280 84% 2,805 90%
12: Languages, Literature and Culture 8,085 93% 5,015 91% 13,100 92%
13: Education and Training 375 92% 2,410 93% 2,790 93%
14: Preparation for Life and Work 109,840 91% 34,670 90% 144,510 91%
14(a): Independent Living Skills 605 96% 850 97% 1,455 96%
14(b): Adult Basic Education 8,080 95% 5,125 95% 13,205 95%
14(c): Foundation for Work 101,020 91% 27,840 89% 128,860 91%
14(d): English for Speakers of Other Languages 135 94% 855 92% 995 93%
15: Business, Administration and Law 5,925 90% 8,655 93% 14,580 92%
All sector subject areas 186,515 91% 98,770 92% 285,285 91%
Source: Lifelong Learning Wales Record (LLWR) Sector Subject Area
2014/15
15
Table 2b - Attainment rates for FE provision by sector subject area and age group
Attained Learning Activities
%
Attained Learning Activities
%
Attained Learning Activities
%
1: Health, Public Services and Care 7,680 94% 8,990 95% 16,670 95%
2: Science and Mathematics 8,180 87% 2,270 90% 10,455 87%
3: Agriculture, Horticulture and Animal Care 1,695 94% 2,120 93% 3,815 93%
4: Engineering and Manufacturing Technologies 4,885 89% 4,705 94% 9,590 91%
5: Construction, Planning and the Built Environment 3,480 92% 3,825 92% 7,300 92%
6: Information and Communication Technology 3,040 88% 3,830 94% 6,870 91%
7: Retail and Commercial Enterprise 5,510 96% 7,460 96% 12,970 96%
7(a): Retailing and Customer Service 340 94% 1,515 97% 1,850 96%
7(b): Hair and Beauty 2,185 95% 2,195 95% 4,375 95%
7(c): Hospitality and Catering 2,990 96% 3,755 97% 6,745 96%
8: Leisure, Travel and Tourism 3,950 91% 925 93% 4,875 91%
9: Arts, Media and Publishing 7,030 94% 1,740 95% 8,770 94%
9(a): Performing Arts 1,895 94% 350 93% 2,240 94%
9(b): Art and Design 5,135 94% 1,390 95% 6,530 94%
10: History, Philosophy and Theology 3,000 91% 395 94% 3,395 91%
11: Social Sciences 2,215 88% 240 87% 2,455 88%
12: Languages, Literature and Culture 7,335 96% 3,290 94% 10,625 95%
13: Education and Training 170 95% 1,885 92% 2,055 92%
14: Preparation for Life and Work 79,735 95% 24,540 95% 104,275 95%
14(a): Independent Living Skills 305 96% 640 98% 945 97%
14(b): Adult Basic Education 4,335 98% 3,405 96% 7,745 97%
14(c): Foundation for Work 75,035 95% 20,005 95% 95,040 95%
14(d): English for Speakers of Other Languages 60 94% 485 93% 545 93%
15: Business, Administration and Law 3,675 87% 5,640 91% 9,310 89%
All sector subject areas 141,575 94% 71,865 94% 213,440 94%
Source: Lifelong Learning Wales Record (LLWR) Sector Subject Area
2014/15
16
Table 2c - Success rates for FE provision by sector subject area and age group
Attained Learning Activities
%
Attained Learning Activities
%
Attained Learning Activities
%
1: Health, Public Services and Care 7,680 85% 8,990 85% 16,670 85%
2: Science and Mathematics 8,180 80% 2,270 78% 10,455 79%
3: Agriculture, Horticulture and Animal Care 1,695 86% 2,120 88% 3,815 88%
4: Engineering and Manufacturing Technologies 4,885 80% 4,705 87% 9,590 84%
5: Construction, Planning and the Built Environment 3,480 82% 3,825 87% 7,300 85%
6: Information and Communication Technology 3,040 80% 3,830 87% 6,870 84%
7: Retail and Commercial Enterprise 5,510 87% 7,460 90% 12,970 88%
7(a): Retailing and Customer Service 340 86% 1,515 92% 1,850 91%
7(b): Hair and Beauty 2,185 83% 2,195 82% 4,375 83%
7(c): Hospitality and Catering 2,990 90% 3,755 94% 6,745 92%
8: Leisure, Travel and Tourism 3,950 83% 925 85% 4,875 83%
9: Arts, Media and Publishing 7,030 84% 1,740 84% 8,770 84%
9(a): Performing Arts 1,895 85% 350 78% 2,240 84%
9(b): Art and Design 5,135 84% 1,390 85% 6,530 84%
10: History, Philosophy and Theology 3,000 84% 395 77% 3,395 83%
11: Social Sciences 2,215 80% 240 74% 2,455 79%
12: Languages, Literature and Culture 7,335 90% 3,290 85% 10,625 88%
13: Education and Training 170 87% 1,885 85% 2,055 85%
14: Preparation for Life and Work 79,735 88% 24,540 86% 104,275 87%
14(a): Independent Living Skills 305 95% 640 96% 945 95%
14(b): Adult Basic Education 4,335 95% 3,405 93% 7,745 94%
14(c): Foundation for Work 75,035 87% 20,005 85% 95,040 87%
14(d): English for Speakers of Other Languages 60 87% 485 85% 545 85%
15: Business, Administration and Law 3,675 78% 5,640 83% 9,310 81%
All sector subject areas 141,575 86% 71,865 86% 213,440 86%
Source: Lifelong Learning Wales Record (LLWR) Sector Subject Area
2014/15
17
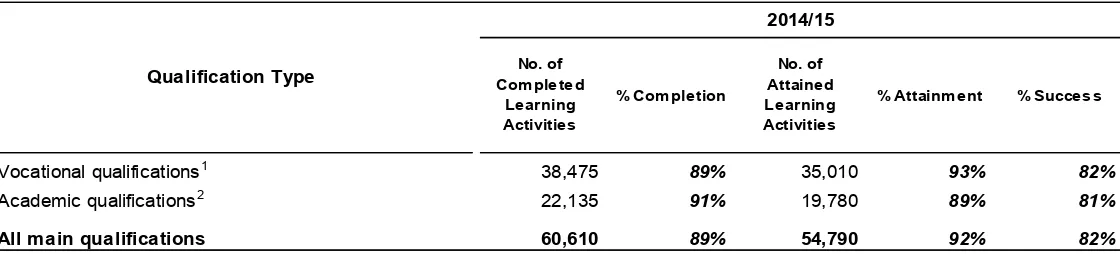
Table 3 - Completion, attainment and success rates for main qualifications in FE by qualification type
No. of Com pleted
Learning Activities
% Com pletion
No. of Attained Learning Activities
% Attainm ent % Success
Vocational qualifications1 38,475 89% 35,010 93% 82%
Academic qualifications2 22,135 91% 19,780 89% 81%
All main qualifications 60,610 89% 54,790 92% 82%
Source: Lifelong Learning Wales Record (LLWR) 1 including NVQs, Diplomas, Extended Diplomas
2 Including GCSEs; AS/A/A2 Levels; Access Certificates/Diplomas
Qualification Type
18
Table 4a - Framework success rates for Foundation Apprenticeships by sector subject area and age group
Leavers Attaining
Full Fram ew ork
%
Leavers Attaining
Full Fram ew ork
%
Leavers Attaining Full Fram ew ork
%
Leavers Attaining Full Fram ew ork
%
1: Health, Public Services and Care 235 81% 770 77% 1,300 84% 2,305 81%
3: Agriculture, Horticulture and Animal Care 80 80% 60 85% 205 93% 345 88%
4: Engineering and Manufacturing Technologies 375 83% 350 83% 395 88% 1,120 85%
5: Construction, Planning and the Built Environment 550 77% 330 81% 90 80% 970 79%
6: Information and Communication Technology 25 * 35 * 160 77% 220 78%
7: Retail and Commercial Enterprise 755 76% 1,055 78% 610 87% 2,425 80%
7(a): Retailing and Customer Service 235 76% 580 77% 285 85% 1,100 79%
7(b): Hair and Beauty 370 75% 155 79% 10 * 535 76%
7(c): Hospitality and Catering 150 80% 320 80% 315 90% 790 84%
8: Leisure, Travel and Tourism 35 71% 60 79% 55 88% 155 80%
9: Arts, Media and Publishing * * * * 0 * * *
13: Education and Training 10 * 15 * 40 * 65 89%
15: Business, Administration and Law 260 85% 610 83% 495 88% 1,365 85%
All sector subject areas 2,335 79% 3,285 80% 3,360 86% 8,985 82%
Source: Lifelong Learning Wales Record (LLWR)
Table 4b - Framework success rates for Apprenticeships by sector subject area and age group
Leavers Attaining
Full Fram ew ork
%
Leavers Attaining
Full Fram ew ork
%
Leavers Attaining Full Fram ew ork
%
Leavers Attaining Full Fram ew ork
%
1: Health, Public Services and Care 160 85% 690 82% 1,570 85% 2,415 84%
3: Agriculture, Horticulture and Animal Care 55 90% 30 * 65 89% 150 90%
4: Engineering and Manufacturing Technologies 255 89% 435 89% 155 93% 845 90%
5: Construction, Planning and the Built Environment 225 78% 315 83% 85 82% 625 81%
6: Information and Communication Technology 20 * 50 81% 150 79% 220 80%
7: Retail and Commercial Enterprise 115 82% 485 83% 380 84% 980 84%
7(a): Retailing and Customer Service 10 * 190 83% 260 89% 460 86%
7(b): Hair and Beauty 85 84% 195 85% 10 * 295 85%
7(c): Hospitality and Catering 15 * 100 81% 110 75% 225 78%
8: Leisure, Travel and Tourism 50 93% 65 88% 40 * 155 90%
9: Arts, Media and Publishing 35 * 25 * * * 60 88%
13: Education and Training 10 * 80 90% 250 90% 340 90%
15: Business, Administration and Law 40 * 410 80% 930 86% 1,385 84%
All sector subject areas 965 85% 2,585 83% 3,625 86% 7,175 85%
Source: Lifelong Learning Wales Record (LLWR) Sector Subject Area
2014/15
19 - 24 All ages
16 - 18 25 +
Sector Subject Area
2014/15
[image:18.595.30.579.422.705.2]19
Table 4c - Framework success rates for Higher Apprenticeships by sector subject area and age group
Leavers Attaining
Full Fram ew ork
%
Leavers Attaining Full Fram ew ork
%
Leavers Attaining
Full Fram ew ork
%
Leavers Attaining Full Fram ew ork
%
1: Health, Public Services and Care * * 145 75% 825 75% 975 75%
3: Agriculture, Horticulture and Animal Care 0 n/a 0 n/a 0 * 0 *
4: Engineering and Manufacturing Technologies 20 * 10 * * * 30 *
5: Construction, Planning and the Built Environment 0 n/a 0 n/a 0 n/a 0 n/a
6: Information and Communication Technology * * * * 0 n/a * *
7: Retail and Commercial Enterprise 0 n/a 0 * * * * *
7(a): Retailing and Customer Service 0 n/a 0 n/a 0 * 0 *
7(b): Hair and Beauty 0 n/a 0 n/a 0 n/a 0 n/a
7(c): Hospitality and Catering 0 n/a 0 * * * * *
8: Leisure, Travel and Tourism 0 n/a 0 n/a 0 n/a 0 n/a
9: Arts, Media and Publishing 0 * * * 0 n/a * *
13: Education and Training 0 n/a 0 n/a 0 n/a 0 n/a
15: Business, Administration and Law * * 45 68% 570 67% 615 68%
All sector subject areas 25 * 215 74% 1,405 71% 1,645 72%
Source: Lifelong Learning Wales Record (LLWR)
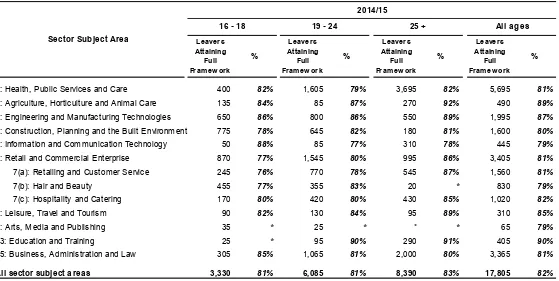
Table 4d - Framework success rates for All Apprenticeships by sector subject area and age group
Leavers Attaining
Full Fram ew ork
%
Leavers Attaining Full Fram ew ork
%
Leavers Attaining
Full Fram ew ork
%
Leavers Attaining Full Fram ew ork
%
1: Health, Public Services and Care 400 82% 1,605 79% 3,695 82% 5,695 81%
3: Agriculture, Horticulture and Animal Care 135 84% 85 87% 270 92% 490 89%
4: Engineering and Manufacturing Technologies 650 86% 800 86% 550 89% 1,995 87%
5: Construction, Planning and the Built Environment 775 78% 645 82% 180 81% 1,600 80%
6: Information and Communication Technology 50 88% 85 77% 310 78% 445 79%
7: Retail and Commercial Enterprise 870 77% 1,545 80% 995 86% 3,405 81%
7(a): Retailing and Customer Service 245 76% 770 78% 545 87% 1,560 81%
7(b): Hair and Beauty 455 77% 355 83% 20 * 830 79%
7(c): Hospitality and Catering 170 80% 420 80% 430 85% 1,020 82%
8: Leisure, Travel and Tourism 90 82% 130 84% 95 89% 310 85%
9: Arts, Media and Publishing 35 * 25 * * * 65 79%
13: Education and Training 25 * 95 90% 290 91% 405 90%
15: Business, Administration and Law 305 85% 1,065 81% 2,000 80% 3,365 81%
All sector subject areas 3,330 81% 6,085 81% 8,390 83% 17,805 82%
Source: Lifelong Learning Wales Record (LLWR) Sector Subject Area
2014/15
16 - 18 19 - 24 25 + All ages
Sector Subject Area
16 - 18 19 - 24 25 + All ages
[image:19.595.21.580.418.699.2]20
Table 5 - Destinations of Adult Employability1 leavers in three month period following end of programme
No. % No. % No. %
Continuing programme of learning 0 0% 0 0% 0 0%
New programme of learning at the same level 110 6% 0 0% 110 6%
Progressed to learning at a higher level 35 2% * 2% 35 2%
Full time employment 500 27% 25 41% 525 28%
Part time employment 15 1% 0 0% 15 1%
Self-employment 20 1% 0 0% 20 1%
Voluntary Work 335 18% * 6% 340 18%
Seeking work / unemployed 645 35% 25 40% 670 36%
Other 65 4% 0 0% 65 3%
Not Known 95 5% 5 11% 105 5%
Total 1,820 65 1,880
Source: Lifelong Learning Wales Record (LLWR)
1 Includes Steps to Employment and Work Ready programmes programmes
Destination
2014/15
Work Focussed
Learning Routeways to Work All
21 Attained Learning Activities % Attained Learning Activities % Attained Learning Activities %
Foundation NVQ1 1,620 80% 3,090 86% 4,710 84%
Apprenticeship QCF Award/Certificate/Diploma 2,425 82% 7,560 85% 9,980 84%
Key Skills/Essential Skills Wales 3,345 80% 13,785 83% 17,130 82%
Other 20 * 10 * 30 *
All 7,410 80% 24,445 84% 31,855 83%
NVQ1 595 83% 2,875 86% 3,470 86%
QCF Award/Certificate/Diploma 865 88% 6,545 87% 7,410 87%
Key Skills/Essential Skills Wales 1,125 85% 12,790 86% 13,920 86%
Other 115 91% 70 72% 180 83%
All 2,705 86% 22,280 86% 24,980 86%
Higher NVQ1 20 * 585 71% 605 72%
Apprenticeship QCF Award/Certificate/Diploma 5 * 1,615 71% 1,620 71%
Key Skills/Essential Skills Wales 25 * 4,240 73% 4,265 73%
Other 0 n/a * * * *
All 50 75% 6,445 72% 6,495 72%
Flexible Learning NVQ1 * * 210 89% 210 88%
QCF Award/Certificate/Diploma * * 135 90% 140 90%
Key Skills/Essential Skills Wales 0 n/a * * * *
Other 0 n/a 0 n/a 0 n/a
All * * 350 89% 350 89%
Traineeship - QCF Award/Certificate/Diploma 915 86% 0 n/a 915 86%
Engagement Key Skills/Essential Skills Wales 1,995 86% 5 * 2,000 86%
Other 415 97% * * 420 97%
All 3,325 87% 5 * 3,330 87%
Traineeship - NVQ1 530 70% 5 * 535 70%
Level 1 QCF Award/Certificate/Diploma 2,075 82% 30 * 2,105 82%
Key Skills/Essential Skills Wales 2,575 84% 35 * 2,615 84%
Other 240 76% * * 245 76%
All 5,420 81% 75 79% 5,495 81%
Adult Employability2 - NVQ1 * * 90 67% 95 67%
Work Focussed QCF Award/Certificate/Diploma 40 60% 1,275 83% 1,315 82%
Learning Key Skills/Essential Skills Wales 30 * 440 71% 470 70%
Other 5 * 45 67% 50 68%
All 75 63% 1,855 78% 1,930 78%
Adult Employability2 - QCF Award/Certificate/Diploma 15 * 70 96% 85 97%
Routeways to Work Key Skills/Essential Skills Wales 0 n/a 0 n/a 0 n/a
Other 0 n/a 0 n/a 0 n/a
All 15 * 70 96% 85 97%
Source: Lifelong Learning Wales Record (LLWR)
1 Includes QCF qualifications that directly replace NVQs
[image:21.595.28.565.79.687.2]2 Includes Steps to Employment and Work Ready programmes
Table 6 - Learning activity success rates for WBL provision by programme, type of learning aim and age group
2014/15
18 and under 19 and over All ages Type of Programme Type of learning aim
22
Directly delivered by Entry Level 1,070 96% 735 88% 84%
local authorities Level 1 2,590 96% 2,230 90% 87%
Level 2 2,310 98% 2,050 89% 87%
Other Levels 12,320 92% 1,750 73% 68%
All 18,285 94% 6,765 84% 81%
Delivered by local authorities Entry Level 4,390 94% 3,550 86% 81%
via a franchise arrangement Level 1 3,825 95% 3,070 83% 79%
with an FE institution Level 2 3,700 96% 3,045 85% 82%
Other Levels 580 97% 340 82% 80%
All 12,500 95% 10,010 85% 81%
Other ACL delivered Entry Level 15,945 96% 12,360 95% 91%
by FE institutions Level 1 18,540 96% 16,575 96% 92%
Level 2 9,455 97% 8,655 93% 90%
Other Levels 14,410 96% 2,520 90% 85%
All 58,350 96% 40,110 94% 91%
All provision types Entry Level 21,405 95% 16,645 93% 88%
Level 1 24,955 96% 21,875 93% 89%
Level 2 15,465 97% 13,755 90% 88%
Other Levels 27,310 94% 4,610 82% 77%
All 89,135 95% 56,885 91% 88%
[image:22.595.22.585.77.480.2]Source: Lifelong Learning Wales Record (LLWR) Table 7: Completion, attainment and success rates for ACL provision by type of provision and level
% Attainment % Success 2014/15
Type of ACL provision Level Completed No. of Learning Activities
% Completion
23
Directly delivered by 18 and under 440 95% 310 85% 82%
local authorities 19 - 24 1,550 92% 885 81% 77%
25 - 49 8,445 93% 3,480 84% 80%
50 - 74 7,000 95% 1,905 87% 84%
75 and over 835 95% 180 89% 88%
All 18,285 94% 6,765 84% 81%
Delivered by local authorities 18 and under 520 94% 430 89% 84%
via a franchise arrangement 19 - 24 1,670 95% 1,350 86% 81%
with an FE institution 25 - 49 6,590 95% 5,320 84% 80%
50 - 74 3,385 95% 2,665 84% 80%
75 and over 310 95% 220 87% 82%
All 12,500 95% 10,010 85% 81%
Other ACL delivered 18 and under 3,450 96% 2,520 96% 93%
by FE institutions 19 - 24 7,700 97% 5,685 95% 92%
25 - 49 29,750 95% 21,380 95% 90%
50 - 74 15,500 96% 9,635 94% 91%
75 and over 1,825 97% 850 94% 91%
All 58,350 96% 40,110 94% 91%
All provision types 18 and under 4,410 96% 3,260 93% 91%
19 - 24 10,920 96% 7,925 91% 88%
25 - 49 44,790 95% 30,180 91% 87%
50 - 74 25,885 96% 14,205 91% 87%
75 and over 2,970 96% 1,250 92% 89%
All 89,135 95% 56,885 91% 88%
[image:23.595.29.571.77.539.2]Source: Lifelong Learning Wales Record (LLWR) Table 8: Completion, attainment and success rates for ACL provision by type of provision and age group
Type of Provision Age Group
2014/15
No. of Attained Learning Activities
% Attainment % Success No. of
Completed Learning Activities
24
Entry Level Arts, Media and Publishing 1,220 98% 1,045 97% 95%
Information and Communication Technology 1,165 97% 955 90% 88%
Languages, Literature and Culture 1,670 93% 425 89% 78%
Adult Basic Education 6,965 96% 5,025 91% 87%
English for Speakers of Other Languages 5,580 94% 4,985 93% 88%
Other 4,805 96% 4,210 94% 90%
All 21,405 95% 16,645 93% 88%
Level 1 Arts, Media and Publishing 1,745 96% 1,615 96% 92%
Information and Communication Technology 3,745 96% 3,135 87% 84%
Languages, Literature and Culture 655 91% 540 91% 83%
Adult Basic Education 3,460 95% 2,690 88% 84%
English for Speakers of Other Languages 3,130 89% 2,520 97% 85%
Other 12,215 98% 11,375 95% 93%
All 24,955 96% 21,875 93% 89%
Level 2 Arts, Media and Publishing 1,085 92% 990 91% 84%
Information and Communication Technology 1,630 95% 1,335 85% 81%
Languages, Literature and Culture 245 88% 195 88% 78%
Adult Basic Education 550 94% 355 76% 72%
English for Speakers of Other Languages 275 98% 265 96% 94%
Other 11,675 98% 10,620 91% 90%
All 15,465 97% 13,755 90% 88%
Other Levels Arts, Media and Publishing 6,000 95% 420 92% 88%
Information and Communication Technology 5,090 94% 475 93% 89%
Languages, Literature and Culture 1,320 92% 230 97% 84%
Adult Basic Education 2,420 92% 605 92% 85%
English for Speakers of Other Languages 1,170 94% 250 95% 92%
Other 11,305 94% 2,635 75% 71%
All 27,310 94% 4,610 82% 77%
All Levels Arts, Media and Publishing 10,050 95% 4,070 95% 90%
Information and Communication Technology 11,630 95% 5,895 88% 85%
Languages, Literature and Culture 3,890 92% 1,390 91% 81%
Adult Basic Education 13,400 95% 8,675 89% 85%
English for Speakers of Other Languages 10,155 92% 8,020 95% 87%
Other 40,005 97% 28,835 91% 89%
All 89,135 95% 56,885 91% 88%
[image:24.595.31.578.77.682.2]Source: Lifelong Learning Wales Record (LLWR) Table 9: Completion, attainment and success rates for ACL provision by level and sector subject area
No. of Attained Learning Activities
% Attainment % Success Level Sector Subject Area
2014/15
No. of Completed
Learning Activities
25
Notes
1. Data Sources
This Statistical First Release (SFR) summarises data on learner outcomes for 2014/15. It covers further education (FE), work based learning (WBL) and adult community learning (ACL) provision delivered by learning providers funded by Welsh Government. However, the figures are not restricted to fundable provision at those providers.
Data on learners accessing FE, WBL and ACL provision across Wales is submitted electronically to Welsh Government by learning providers via the Lifelong Learning Wales Record (LLWR). This data is used for funding, monitoring performance and outcomes and to inform strategy development.
Furthermore, the data provides the official source of statistics on Post 16 (non-higher education) learners in Wales.
Further information on LLWR including user support manuals can be found at: Welsh Government - Lifelong Learning Wales Record
Our statement of administrative sources, which also refers to this data source, can be found at: Statement of Administrative Sources
2. Definitions
2.1 Terminology
Data are presented on an ‘academic year’ basis referring to the period 1 August to 31 July.
The terms ‘learning activity’ or ‘learning aim’ refer to a specific qualification pursued by a learner, for example, an A Level or Key Skill. The term ‘learning programme’ refers to a group of related learning activities or aims.
2.2 Cohorts
The base cohorts underpinning tables 1a – 1c, 2a – 2c, 7, 8 and 9 comprise all learning activities that were either expected to complete during the respective academic year or actually ended during the academic year but were expected to complete prior to it.
The base cohort underpinning table 3 is derived as above but additionally contains only learning activities that have been identified as main qualifications (by the institution submitting data) linked to full-time learning programmes.
The base cohorts underpinning tables 4a – 4d and 5 comprise all work based learning programmes recorded as ending in the respective academic year.
26
2.3 Provision type
This statistical release includes data on FE provision delivered by FE institutions; WBL provision delivered by contracted lead providers, their consortium members and sub-contractors; and ACL provision delivered by ACL partnerships.
WBL provision is defined as that submitted to the LLWR by a WBL provider or provision at FE institutions comprising a WBL designated learning programme e.g. an Apprenticeship, Foundation Apprenticeship, Higher Apprenticeship, Traineeship or Work Ready programme.
ACL provision is defined in Delivering Community Learning for Wales as “Flexible learning opportunities for
adults, delivered in community venues to meet local needs”. For the purposes of this release, we have
focussed on three distinct types of provision:
ACL directly delivered by local authorities (LAs);
ACL delivered by LAs via a franchise arrangement with a further education (FE) institution; and Other ACL delivered by FE institutions (this includes all provision delivered in Wales by the
Workers Education Association (WEA) YMCA Community College Wales).
Other ACL provision delivered by FE institutions is the largest provision type comprising 65 per cent of all
ACL provision delivered in Wales. ACL provision delivered by local authorities via a franchise arrangement
with a FE institution and ACL provision directly delivered by local authorities comprised 14 per cent and 21
per cent of all ACL provision respectively.
The following types of provision have been excluded from this release:
Higher Education (HE) provision delivered by FE institutions.
Welsh for Adults (WfA) provision submitted to the LLWR by Coleg Gwent.
Pathways to Apprenticeships provision.
2.4 Completion, Attainment and Success
The completion rates shown in tables 1a, 2a, 3, 7, 8 and 9 are calculated as the number of learning activities completed divided by the number of learning activities terminated (completed or withdrawn).
The attainment rates shown in tables 1b, 2b, 3, 7, 8 and 9 are calculated as the number of learning activities attained divided by the number of learning activities completed.
The success rates shown in tables 1c, 2c, 3, 6, 7, 8 and 9 are calculated as the number of learning activities attained divided by the number of learning activities terminated.
Learning activities that are deemed to be non-assessable (i.e. do not lead to an associated award) are excluded from the denominators of the attainment and success rate calculations.
27
2.5 Framework Success
The framework success rates shown in tables 4a – 4d are calculated as the number of learning programmes where the full framework has been achieved divided by the number of learning programmes terminated.
Learning programmes recorded as either transferred or continuing at another WBL provider are excluded from the calculation. Learning programmes that ended within 8 weeks of commencing without completion are also excluded.
Learning programmes recorded as terminated due to the learner being made redundant have been excluded from the calculation.
2.6 Other Short learning activities
Tables 1a – 1c include a line for ‘Other Short’ learning activities. These are defined as learning activities categorised as ‘Other’ with an expected length of less than 8 weeks. .
2.7 Learner Age Group
A learner’s age group is calculated from their age at 31 August in the academic year they started learning.
In tables 1a – 1c and 2a – 2c learners of unknown age are included in the age group 19 and over.
2.8 Sector/Subject Areas
The sector/subject areas detailed in Tables 2a – 2c, 4a – 4d and 9 are based on the 15 first-tier areas of learning classified by the Office of Qualifications and Examination Regulation (OfQual) and reflect the sub-areas used by Estyn for inspection purposes. The sector/subject areas in table 9 have been grouped to reflect the most popular ACL subject areas.
The total lines include learning activities with unknown sector/subject areas.
Apprenticeship programmes have been mapped to sector/subject areas in tables 4a – 4d on the basis of the occupational sector code.
2.9 Early Drop-out
Learning activities with an expected length of 24 weeks or greater that ended within 8 weeks of their start date without completing have been classified as early drop-outs and excluded from WBL learning activity success rates in table 6 and all learner outcome measures in tables 1a - 1c, 2a – 2b, 3, 7, 8 and 9.
2.10 Destinations
28
in table 5 (formerly table 4b) differs slightly from the version in years prior to 2013/14 and care should be taken when making comparisons across years.
The basis for collecting information on the destinations of traineeship leavers has changed during the course of the data collection year, to reflect destinations within four weeks rather than within three months, as was the case previously. Due to this change in definition, it has not been possible to provide information on the destinations of traineeship leavers as in previous years.
2.11 Work Ready programme
The Work Ready programme was introduced partway through 2013/14 and directly replaced the Steps to Employment programme. These programmes are referred to collectively as ‘Adult Employability programmes’ in tables 5 and 6 of this release.
3. Rounding and Suppression
All figures in this Statistical Release are rounded to the nearest 5 and therefore there may be apparent slight differences between the sum of the constituent rows/columns and the totals. A ‘*’ represents numbers greater than 0 but less than 5.
In addition, percentage calculations where the denominator is less than 50 have been suppressed and the percentage replaced with a ‘*‘.
4. Key Quality Information
This section provides a summary of information on this output against five dimensions of quality: Relevance, Accuracy, Timeliness and Punctuality, Accessibility and Clarity, and Comparability.
4.1 Relevance
The measures set out in this publication are primarily used:
by the Welsh Government to monitor providers’ performance and as baseline information to set targets for improvements as part of the Quality and Effectiveness Framework for post-16 learning;
by Estyn, to inform inspection judgements on Key Question 1 ‘How well do learners achieve?’; and
by providers themselves, as a management tool to measure their own performance and benchmark themselves against sector averages, as part of their annual self-assessment cycles.
The Welsh Government and Estyn have a commitment to share data in order to minimise bureaucracy for providers and ensure consistent definitions of performance wherever possible and have worked together closely to develop these measures and a standard format for presenting data.
The measures are also used both within and outside the Welsh Government to monitor educational trends and as a baseline for further analysis of the underlying data. Some of the key users are:
Ministers and the Members Research Service in the National Assembly for Wales; Officials in the Welsh Government;