Comparative studies on cultivated and wild accessions of Vigna vexillata (L.) A. Rich
67
0
0
Full text
(2) 5.0. STUDIES. OF. POLLEN. GRAIN. VIABILITY. AND. CHROMOSOME NUMBER IN J': VEXILLATA 5.1 Introduction As outlined in Chapters 3 and 4, respectively, 19 accessions have been analysed for a number of qualitative and quantitative traits, and hybrids were generated using 17 of these accessions. Genetic barriers were apparent in the hybrids between cultivated Bali and wild accessions. This was evident in the following outcomes: (i) non viable hybrid (F t ) seeds (for instance,CPI 16683 x Jim lA,. cpr 60458 x Tab 2 and Jim 2 x CPI 69030); (ii) the cessation of growth at c.. 18 days. after germination (Jim 1A x ACC 351 and Tab 3 x ACC 351); and (iii) hybrid sterility in the crosses of ACC 390 x Jim 1A and ACC 390 x Jim 2. In the last type of genetic barrier, the hybrids failed to set pods even when tripping was attempted to obtain F 2 seed. As described in Chapter 4, backcrosses were carried out on ACC 390 x Jim 1A and ACC 390 x Jim 2 hybrid combinations. There was a low percentage of pod set and a low number of seeds set per pod.. Genetic breakdown may be attributed to a variety of mechanisms, depending on the genus and species examined (Mutschler and Liedl 1994). For instance, irregular chromosomal pairing and subsequent rearrangement during meiosis often causes sterility in the hybrid between two distantly related species (Ladizinsky 1998; Rieseberg and Carney 1998). However, genetic breakdown also has been repOlted in intraspecific hybridisation. Poor growth performance in the hybrids and hybrid breakdown have been reported in intraspecific hybridisation in rice. The breakdown was attributed to the interaction of two recessive genes (Li et al. 1997; Kubo and Yoshimura 2002; Yamamoto et al. 2007). Unfortunately, so far it has been difficult to distinguish unambiguously between chromosomal and genic effects (Rieseberg and Carney 1998), except when the hybridisation experiment has been supported by DNA marker analysis, such as Restriction Fragment Length Polymorphism (RFLP), as has been done with rice (Li et al. 1997; Kubo and Yoshimura 2002).. Yamamoto et al. (2007) suggested that clarifying the mechanisms behind reproductive barriers such as hybrid breakdown is important not only to understand biological speciation but also to facilitate removal of the battier for crop breeding. Therefore, the purpose of this experiment was to investigate the cytological basis for the genetic breakdown which was observed between some cultivated and wild type accessions of V vexillata.. 80.
(3) 5.2 Material and methods 5.2.1 Germplasm The cytological studies in Experiment 3 involved: (i) analysis of pollen viability and (ii) mitotic analysis of root tip squashes, to detennine somatic chromosome number. Selected cultivated and wild V vexillata accessions and their hybrids, produced as explained in Chapter 4, were investigated in these studies (Table 5.1).. Table 5.1 The two wild, two cultivated and five hybrid accessions of V. vexillata used in cytological studies. Hybrids are designated as male x female parent. Observations were made of 1. pollen viability and 2. mitosis. Germplasm type. Genotype. Observation. Wild. ACC 390. 1,2. Wild. ACC 351. 2. Cultivated. Jim lA. 1,2. Cultivated. Jim 2. 1,2. Hybrid. ACC 390 x Jim lA. 1,2. Hybrid. ACC 390 x Jim 2. 1,2. Hybrid. Tab lA x ACC 351. 2. Hybrid. Tab 3 x ACC 351. 2. Hybrid. ACC 351 x Tab 3. 2. 5.2.2 Cytological procedures 5.2.2.1 Pollen viability analysis. a. Pilot experiment Based on a pilot experiment, Alexander's staining procedure was chosen to test pollen viability in parental accessions and hybrids. In the pilot experiment, pollen grains sampled from ACC 390 were stained using either Alexander's stain or aceto-carmine dye. Based on ANOVA analysis that was performed using SPSS 16.0 Graduate Student Version software (SPSS, Inc), preliminary data showed that the percentages of pollen viability detected by aceto-carmine dye were not significantly different than was evident using Alexander's stain (Table 5.2). However, Alexander's stain was considered to be a more reliable indicator of pollen viability because it discriminated more clearly between viable and non viable pollen grains. When Alexander's stain was used, viable pollen grains stained dark purple-red, while non viable pollen grains stained pale blue-green. When aceto-carmine was used, the contrast was red pink for viable grains and light pink for non viable grains. Dafni (1992) cautioned against the use of acetocannine, pointing out that pollen stainability may not be a valid index of pollen viability. Alexander (1969) pointed out that dyes such as aceto-carmine and cotton blue in lactopheno1 do not stain the aborted pollen, whilst Alexander's stain does.. 81.
(4) Table 5.2 Comparison of aceto-carmine and Alexander's stain in determining pollen viability in V. vexillata (ACC 390). In each case, the percentage of viable pollen shown is based on 10 anthers excised from a single flower. Sub samples. Aceto-carmine stain. Sub samples. Alexander's stain. 95.7 %. 4. 95.3 %. 2. 96.8 %. 5. 96.7 %. 3. 97.4 %. 6. 96.0 %. Range. 95.7 % - 97.4 %. Range. 95.3 % - 96.0 %. b. Analysis of pollen viability in five of the nine accessions listed in Table 5.1 As indicated in Table 5.1, pollen viability was analysed in accessions ACC 390, Jim lA, Jim 2 and the hybrids of ACC 390 x Jim lA and ACC 390 x Jim 2. Ten flowers were sampled, except for ACC 390 in which the case only five flowers were available at the time of sampling. Samples were collected between 0700 and 0800 hours between February 25 and March 15, 2008. Pollen grains were collected from the ten anthers in each of the flowers collected.. Analyses of pollen viability were can-ied out as follows: all pollen grains from ten anthers in each flower were transferred onto a clean slide, stained with a drop of Alexander's stain solution and then covered with cover slip for c. 10 minutes prior to observation. Viable and nonviable pollen grains were observed and counted under a high power (H.P.) microscope at x40 magnification in different fields of view (Olympus System Microscope Model BHS, Olympus Optical Co., LTD, Tokyo, Japan) and photographed using an Olympus DP12 digital camera. Based on the numbers of dark-purple red and blue-green pollen grains observed, the percentage of viable and non viable pollen was detennined and the data was analysed using SPSS 16.0 Graduate Student Version software (SPSS, Inc) to determine differences in pollen viability among parental accessions and their hybrids.. 5.2.2.2 Mitotic analysis In order to determine the chromosome number in each parental accession and its hybrids, root tips were used in mitotic studies. The root tipping method was modified from the technique used in Vigna lanceolata by Bull (1987). Prior to genninating them, seeds were scarified than allowed to germinate in petri dishes lined with filter paper that had been moistened with distilled water. Both the radicle and lateral roots were used in mitotic analyses. When the radicle was c. 10 mm long, the terminal c. 7 mm was excised for root tipping. Lateral roots proliferated from the remaining 3 lllill of radicle. They too, were excised and used in root tipping when they were c. 10 mm long.. 82.
(5) Both radicle and lateral roots were pre-treated in 0.002 M 8-hydroxyquinoline at 20°C for 4 hours, fixed in 45 percent acetic acid for one minute, and macerated in a mixture of I N. acid mixture had been pre-warmed to 60°C for five minutes before use. Roots were then stained with I percent aceto-orcein for between four to eight hours at room temperature, then the terminal I mm of each root tip was cut, placed onto a clean slide, a drop of aceto-orcein was added, and the tip was cut into smaller pieces, and a coverslip was applied. The slide was then placed in folded blotting paper, held steady between two fingers and tapped gently with a soft pencil to further break up the root tip. It was followed by squashing, which was done by pressing down very firmly on the coverslip with the thumb. Chromosomes were observed and counted under a high power (H.P) microscope (Olympus System Microscope Model BHS, Olympus Optical Co., LTD, Tokyo, Japan) at xIOO magnification with oil immersion and photographed using a digital camera (Olympus DPI2).. Chromosome number was determined for a minimum 10 cells for each accession and the hybrids whenever possible. However, no cell count was obtained in one hybrid because of a limited number of available seed (one), which failed to germinate.. 5.3 Results and discussion 5.3.1 Pollen viability analysis. Generally, viable pollen can be easily distinguished fi:om non viable pollen based on colour and size differences as presented in Plate 5.1. Viable pollen grains stained dark purple-red whilst non viable pollen stained pale blue-green. Moreover, viable pollen was larger (c. 80 f.Ill1.) than non viable pollen (c. 50 /-Un) (Plate 5.1). Kelly et al. (2002) reported positive correlations between pollen size and pollen viability in Mimulus guttatus and Collinsia verna. In spite of the correlations between those two traits, Kelly et al. (2002) pointed out that determination of pollen viability could not be based solely on the pollen size, because some non-genic factors affected pollen size and also pollen viability, e.g. temperature and humidity.. Based on the ANOVA, there were large and statistically significant (P ::; 0.0 I) differences among genotypes (ACC 390, Jim lA, Jim 2, ACC 390 x Jim lA, and ACC 390 x Jim 2) and also between germplasm types (wild parent, cultivated parent, hybrid) for the percentages of viable pollen. This was illustrated by the LSD test, which showed that there were significant differences between the wild parent ACC 390 and the two cultivated Bali parents Jim lA and Jim 2. ACC 390, Jim lA and Jim 2 were also significantly different from the hybrids (Table. 83.
(6) 5.3), but Jim IA and Jim 2 were not significantly different from each other. Nor were the two. hybrids ACC 390 x Jim IA and ACC 390 x Jim 2 significantly different from each other.. .... e.. .'....-. ... •. ... " ~. • •. V·. • ~. 0 =. ""'=. =. •• •• • • \ • •• • • ~ • •• • • •• • •• •• ~ll!Uil. 4. [!]. Plate 5.1 Pollen grains of V. vexil/ala were stained using Alexander's stain and are shown at x40 and xlO magnifications. Viable pollen stained dark purple-red, non viable pollen stained pale bluegreen. a and b were pollen grains of ACC 390 (wild parent). c and d were pollen grains of ACC 390 x Jim IA (hybrid). e and fwere pollen grains of Jim IA (cultivated Bali parent). All pollen grains in hybrid shown were non viable (c and d). The wild parent (ACC 390) had the highest percentage of viable pollen (95.94 percent), followed by the cultivated Bali parents with 76.15 percent in Jim IA and 67.79 percent in Jim 2.. 84.
(7) In contrast, only 4.25 percent and 4.44 percent of viable pollen was observed in ACC 390 x Jim lA and ACC 390 x Jim 2, respectively (Table 5.3). Low pollen viability (27.8 percent) in. hybrids also has been icportcd b)~ GomathinayTagam et al. (1998) who investigated inter-specific hybridisation between V vexillata and V unguiculata. In that study, the aceto carmine squash technique was used to identify viable and non viable pollen grains.. Table 5.3 Mean percentages of viable pollen observed from ten anthers in each flower of the wild parent (ACC 390), cultivated Bali parents (Jim lA and Jim 2) and their hybrids. Means within a column followed by the same letter are not significantly different (P > 0.05). Germplasm. Genotype. Viable pollen (%). S.E.. Range (%). Wild parent. ACC 390. 95.94 a. 0.216. 95.33 - 96.67. Cultivated Bali parents. Jim 1A. 76.15 b. 6.623. 20.48 - 94.91. Jim 2. 67.79 b. 6.776. 30.48 - 93.15. ACC 390 x Jim 1A. 4.25 c. 0.452. 1.22 - 6.10. ACC 390 x Jim 2. 4.44c. 0.448. 2.57 - 6.50. Hybrids. Compared to the wild parent and the hybrids, larger variation in the percentage of viable pollen was observed in the cultivated Bali parents, which was indicated by larger values of standard en-or (S.E.) (Table 5.3). Apart from the effect of genotypic expression on the percentage of viable pollen, pollen viability was possibly also influenced by other factors such as prevailing temperature during floral development. High temperature, particularly high night temperature during pre-anthesis (>20 0c), which occurred during flower sampling, has been repOlied to reduce pollen viability in legumes, e.g. in cowpea (Ahmed et at. 1992), in groundnut (prasad et. al. 1999) and in common bean (porch and Jahn 2001). Level of sensitivity to high temperature was different among species, or even within species (Ehlers and Hall 1998; Rebetzke and Lawn 2006b). However, for the data presented in Table 5.3, it is not possible to ascribe different viabilities to different temperature regimes, because of limited number of flowers sampled.. Based on ANOVA, large and statistically significant (P. $;. 0.01) differences among genotypes. and among germplasm types (wild parent, cultivated parent, hybrid) were observed for the number of pollen grains in each sampled flower. Table 5.4 shows that differences in the number of pollen grains in each sampled flower were most apparent when comparing the generations. As was the case in pollen viability analysis, there were no significant differences among cultivated parents (Jim lA and Jim 2) and also among the hybrids (ACC 390 x Jim lA and ACC 390 x Jim 2) (P > 0.05) in the number of pollen grains in each sampled flower (Table 5.4).. 85.
(8) Table 5.4 Mean number of pollen grains counted from ten anthers in each flower sampled from the wild parent (ACC 390), cultivated Bali parents (Jim lA and Jim 2) and their hybrids. Means within a column followed by the same letter are not significantly different (P > 0.05). Number of pollen. Germp1asm. Genotype. Wild parent. ACC390. 1,699.0 a. 128.6. 1,214 - 1,904. Cultivated Bali parents. Jim lA. 1,051.3 b. 249.9. 166 - 2,434. Jim 2. 945.3 b. 207.6. 180 - 1,730. ACC 390 x Jim 1A. 241.7 c. 23.0. 162 -. 353. ACC 390 x Jim 2. 336.6 c. 39.2. 123 -. 542. Hybrids. grains. S.E.. Range. The wild parent (ACe 390) produced the highest number of pollen grains in each sampled flower (mean 1,699) compared with the four other accessions studied. Cultivated Bali parents produced about 1000 pollen grains per flower while hybrids produced 242 - 337 pollen grains per flower (Table 5.4), As had been observed in the pollen viability analysis, there was a wider range of viability in the cultivated Bali parents, than in the wild parent (Table 5.3) and this is consistent with the wider range in number of pollen grains number in each sampled flower (1662434 and 180-1730), compared to wild parent and the hybrids (Table 5.4). Possibly, this may be due to the effect of high temperature on pollen production. The cultivated Bali accessions are adapted to temperatures of about 36°C in Bali, and in the shade house from which samples were collected in Townsville, daily minima and maxima per week exceeded 24.4°C and 40.3°C. Such high temperature may have adversely affected both pollen production and pollen viability, There was highly significant conelation (P. ~. 0,01) between number of viable pollen grains and. number of pollen grains per flower in this experiment (r = 0.76), It suggests that genetic breakdown is not only influencing pollen viability but also pollen production in the hybrids.. 5.3.2 Mitotic analysis. The data showing chromosome number and the number of cells counted is presented in Table 5.5. In most accessions, chromosome number was successfully determined based on at least 10 cells for each genotype, even though there were limited numbers of available seed particularly in the hybrids. Low germination rate and the failure to produce lateral roots was a problem in some genotypes, i,e. Tab 1A x ACC 351 and Tab 3 x ACC 351. In the case of ACC 351 x Tab 3, no cell count was obtained because the one hybrid seed failed to germinate, In order to obtain reliable counts of20 somatic cells, e.g. in ACC 390 (Table 5,5), it was necessary to examine 10 - 15 root tip preparations. Parida et al. (1990) pointed out that small chromosome size was one of the difficulties of doing cytogenetic investigations in Vigna. As observed in Plate 5.2b, based on extrapolation from the scale bar, the chromosome size of Jim 1A was about 1.5 J..I11l' Small chromosome size (1.76 pm - 3,29 J..I11l) also has been reported in V. lanceolata by Bull (1987).. 86.
(9) Table 5.5 Number of cells counted and number of chromosomes observed at mitosis in two wild, two cultivated and four hybrid accessions of V. vexillata. Hybrids are designated as male x female parent. Number of chromosomes. Germplasm. Genotype. Number of counted cells. Wild parents. ACC 390. 20. 22. ACC 351. 10. 22. Jim lA. 18. 22. Jim 2. 10. 22. ACC 390 x Jim lA. 15. 22. ACC 390 x Jim 2. 11. 22. Tab lA x ACC 351. 12. 22. Tab 3 x ACC 351. 10. 22. Cultivated parents. Hybrids. observed. The analysis of somatic cells of V vexillata genotypes indicated that all the genotypes have 2n = 22 chromosomes (Table 5.5, Plate 5.2). This chromosome number has been also reported in V vexillata by Adetula et al. (2005). Lackey (1980) suggested x = 10 and x = 11 as the basic chromosome numbers found in the genus Vigna. Other basic chromosome numbers also have been reported in the genus Vigna, e.g. x = 9 in V candida (Forni-Martins 1986) and x = 22 in V glabrescens (Lawn 1995). The chromosome numbers inserted in Plate 5.2 are regarded as valid because counting was done while adjusting focus on the microscope, but the photographic plate is one dimensional.. The fact that all the accessions studied had a somatic chromosome number of 22 indicates that differences in chromosome number could be eliminated as the cause of genetic breakdown leading to hybrid inviability and sterility. This does not negate the possibility that structural differences in chromosomes of the different accessions may be a contributory factor to genetic breakdown.. To ascertain the nature of such differences requires detailed studies of chromosome pairing behaviour at meiosis. This would pennit the detection of inversions, deficiencies, duplications and translocations all of which represent structural alterations in chromosomes and which impact adversely on the production of viable gametes. Such detailed cytological analysis was beyond the time frame available for this research but is recommended for the future.. 87.
(10) ~:;~~i-;~;.,~;.'-,~1.'!·:~~,.;"'-,: " ~ '."..~.I:.'.~.~ ~ · rL':.~,:_'· :~:.' ,,,v,"j.. ......•,•.. . •..•. • • .•...•. :.•'•..,'.' ... ':,':',. :.-;. ~~~:{ "<,. Plate 5.2 Mitotic cells with 2n lA). Scale bar was 6 JIm.. =. ,.'. 22 chromosomes observed in V. vexillata (a. ACC 390 and b. Jim. 88.
(11) 5.4 Summary and conclusions Alexander's stain distinguished the viable and non viable pollen in V. vexillata, because of the dear colour discrimination between them. Low poilen viability and a low number of poilen grains were observed in the hybrids between the cultivated Bali and wild accessions of V vexillata compared to their parental accessions. Even though the validity of pollen viability. analysis has been subject of discussion (Dafni and Firrnage 2000), it does yield comparative data and the results presented in this thesis suggest that genetic breakdown which occurred in the hybrids between the cultivated Bali and the wild accessions of V vexillata were influenced by pollen development which was expressed in terms of both impaired pollen production and reduced pollen viability.. Hybrids resulting from crosses between parents with different chromosome numbers would produce gametes that are unbalanced in term of chromosome number and this could lead to genetic breakdown in those hybrids. Based on mitotic analysis, there was no difference in the number of chromosomes in the two cultivated Bali and two wild accessions used in the analysis. However, genetic breakdown may occur in the hybrid of two species with the same number of chromosomes, as has been reported in lice (Li et al. 1997; Kubo and Yoshimura 2002; Yamamoto et al. 2007).. The data from pollen viability and mitotic analyses in the absence of meiotic analysis did not permit specification of the mechanism of genetic breakdown between the cultivated Bali and the wild accessions. However, these two analyses: (i) provided the initial information that very low pollen viability occurring as a result of genetic breakdown may have caused partial sterility in ACC 390 x Jim lA and ACC 390 x Jim 2 hybrids; and (ii) confirmed that the cultivated Bali (Jim lA and Jim 2) and wild (ACC 390 and ACC 351) accessions have the same chromosome number, which implies that chromosome number was not the causal factor of the genetic breakdown.. Meiotic analysis is necessalY to further investigate the genetic breakdown mechanism which occurred in the hybridisation of the cultivated Bali and the wild accessions of V vexillata. In the future, chromosome banding studies and the use of molecular markers could also be informative in attempts to elucidate the mechanism of genetic breakdown in V. vexillata.. 89.
(12) 6.0 INHERITANCE OF SELECTED TRAITS IN CULTIVATED AND WILD ACCESSIONS OF VIGNA VEXILLATA 6.1 Introduction One of the basic strategies in plant breeding is searching out genes that encode useful traits from cultivated species and their close relatives (SIeper and Poehlman 2006). Equally important is the need to understand how deleterious or unwanted traits are inherited. The development of an understanding of inheritance pattern and segregation ratios is thus an important step in crop improvement. In Vigna, inheritance of agronomic traits in mungbean (Sriphadet et al. 2007), and inheritance of time to flowering, flower colour, pod colour, seed colour, leaf mark, and seed dehiscence in cowpea (Aliboh et at. 1996; Sangwan and Lodhi 1998; Ishiyaku and Singh 2004; Othman et at. 2006; Adeyanju et at. 2007; Mustapha 2008; Mustapha and Singh 2008) have been reported. The inheritance in Vigna of a wide range of traits was documented by Fery (1980).. In contrast to Vigna generally, relatively few inheritance studies have been conducted in V. vexillata. James and Lawn (1991) evaluated the inheritance of qualitative and quantitative traits. in hybrid populations generated by crossing wild genotypes of Aflican and Australian origin. In a more targetted study, Ogundiwin et al. (2002) evaluated populations of V. vexillata as a source of resistance to cowpea mottle virus, as part of a cowpea improvement program. Given the scarcity of inheritance studies in V. vexillata, more information is needed to provide a basis for future plant breeding efforts to accelerate varietal development. The purpose of the experiments repOlied below was to document the inheritance of selected traits using hybrids between diverse genotypes. Emphasis was placed on the inheritance of cultivated vs. wild traits in segregating hybrid populations from crosses between cultivated and wild type accessions.. 6.2 Material and methods 6.2.1 Germplasm Population development, which included the development ofF t and F2 hybrid populations, and backcrosses (Be) between F I plants and the two respective parents (BCP 1 and BCP 2), was carried out as described in Chapter 4. As detailed previously, in the case ofthe cultivated Bali x wild and cultivated Bali x var. macrosperma crosses, most hybridisations failed to result in pods and lor the formation of viable seed (refer Table 4.2b). In two instances, involving crosses between the wild Australian genotype ACe 390 and the cultivated Bali genotypes Jim lA and Jim 2, viable but se1f-infe11ile F 1 plants were obtained. Because of this fertility barrier, no selfed F2 generation seeds were able to be obtained for these crosses. However, there was some limited success in obtaining backcross seeds on the F I plant using pollen from the two parental lines.. 90.
(13) In contrast, no hybrid breakdown was observed in the val'. macrosperma x wild hybrids, using both African and Australian wild genotypes. The hybrid between val'. macrosperma CPI 69030 and the wild Australian genotype ACC 390 was chosen for the inheritance study because in Experiment 1, these two parents exhibited extremes of diversity in morphological attributes. The var. macrosperma parent was characteristically robust, with thick stems, large ovate leaflets, non-dehiscent pods and large uniformly coloured seeds, while ACC 390 was typically gracile, with thin stems, small narrow leaflets, strongly dehiscent pods and small dark coloured seeds. As discussed in Chapter 3, there were many morphological similarities between var. macrosperma and the cultivated accessions from Bali. In the absence of any hybrid breakdown,. parental, FI> BCPI> BCP 2 , and F2 populations were available for study using the var. macrosperma x wild combination (Table 4.2b).. 6.2.2 Cultural details The evaluations of the cultivated Bali x wild backcross populations were calTied out between September 11, 2008 and December 20, 2008, in the shade house facilities of the School of Marine and Tropical Biology at James Cook University in Townsville, Queensland, Australia. The evaluation of the var. macrosperma x wild hybrid population was conducted between September 17, 2008 and JanualY 11, 2009, in the Genetic Garden facilities of the School of Marine and Tropical Biology at James Cook University in Townsville, Queensland, Australia. As observed in Experiment 1 (see Chapter 3), the Bali accessions exhibited sensitivity to long photoperiods. Therefore, in order to obtain the information about inheritance photoperiod sensitivity in backcross plants in the Bali x wild backcross populations, early summer was chosen for the experiment. Meanwhile, the evaluation of phenotypic expression of selected traits was carried out between July 15, 2008 and November 15, 2008 for the hybrid of CPI 69030 x CPI 29141 and its parent accessions and between September 25, 2008 and December 20,2008 for the hybrid ofCPI 69030 x CPI 60458 and its parent accessions.. For all evaluations, the plants were grown in spaced cylindrical PVC pots which were located on wire mesh benches c. 1 m above the ground. Individual pots were 200 mm in diameter and 200 mm depth and were painted silver to reflect radiation and so reduce the temperature inside the pots. The pots were filled with equal volumes of vermiculite and watered prior to sowing, as outlined previously in Section 3.2.2. Prior to sowing, the seeds were scarified and germinated as described previously in Section 3.2.2. Germinating seeds were sown two per pot for the Bali x wild backcross populations and one per pot for the var. macrosperma x wild hybrid population, at a depth of c. 1.5 em, when the radicle root was c. 5 mm long. After plants were established, a 1.2 m bamboo stake was placed vertically in the pot to provide support as the plant needed it. An application of 30 g Osmocote Plus® controlled-release fertiliser was given to each pot at. 91.
(14) sowing time to provide sufficient nutrients for vigorous growth. Plants were watered daily by hand. To ensure plants were not stressed between waterings, additional water was provided using a water-filled saucer under each pot.. As outlined in Chapters 3 and 4, insecticides and fungicide were applied whenever deemed necessary during the plant growth to avoid damage from insects and diseases. For the hybrid population located in the open environment of the Genetic Garden, the insecticide Imidacloprid (0.125 g.r') was applied to control the pod-sucking bug (Riptortus serripes), the brown bean bug (Melanacanthus scutellaris), and the green vegetable bug (Nezara viridula). In the shade house, applications of wettable sulphur (2.75 g,tl) were given to control powdely mildew (Podosphaera xanthii) and spider mite (Tetranychus urticae) that mostly infested the plants in. the summer when the temperatures and humidity inside the shade house were very high. In addition, the floor of shade house was hosed regularly, to moisten the environment in order to reduce the infestation of spider mite, and the door of the shade house was left open from October 10,2008 until the end of the experiment to reduce the inside temperature. Pods on several of the plants located in the Genetic Garden suffered damage from rainbow lorikeet parrots (Trichoglossus haematodes), with >10% of pods affected in the worst instances. The birds caused damage when about 50% of the plant population had set pods and used their beaks to remove the developing seeds from pods that were about to mature in c. 3-4 days. Most of the plants which were damaged by the birds were observed to have relatively larger seeds. Efforts applied to overcome the problem included hanging shiny computer compact disks around the plants to distract the birds and manually scaring them away by staying at the Genetic Garden during their feeding time from 6 am to 9 am and 4 pm to 6 pm each day. 6.2.3 Experimental design, data collection and statistical analysis. For each of the two Bali x wild hybrids, six plants of each parent, six F 1 plants and the available backcross plants were grown in a completely randomised design. All pots were moved to a new location two times during the experiment to reduce possible local spatial effects. The numbers of backcross plants differed for each parent in each combination, reflecting the differences in hybridisation success during population development as described in Chapter 4. For ACC 390 x Jim lA, there were nine backcross plants to ACC 390 (BCP 1) and 12 backcross plants to Jim 1A (BCP 2), while for ACC 390 x Jim 2, there were there were 11 backcross plants to ACC 390 (BCP,) and 43 backcross plants to Jim 2 (BCP 2).. For the var. macrosperma x wild combination, the populations evaluated comprised 10 plants of each parent, six F. plants, 25 BCP. plants (wild parent), 24 BCP2 plants (var. macrosperma. 92.
(15) parent) and 99 F2 plants. The population was grown in a completely randomised design. As for the Bali x wild populations, all pots were moved to a new location two times during the experiment to reduce possible spatial effects (e.g. exposure to wind or shading from nearby trees). Because of a shortage of available F I flowers when the backcross hybridisations were being made, only eight BCP J seeds were available for sowing with the other plants on September 17, 2008. An additional 17 BCP. seeds, from a later-set pod, were sown on October 25, 2008. The qualitative data measured on the eight early and the 17 late sown plants were combined in subsequent analyses. However, it was considered that for most of the quantitative traits, and particularly the phenological traits, the environmental differences due to the different sowing times would be too great.. In the two Bali x wild populations, differences were observed in the sizes of the backcross seeds. (i.e. BCP t and BCP2 generations) despite the fact that in all cases, the Bali accession was the maternal parent. In order to explore whether these differences may have had subsequent effects, the backcross seeds were separated into four size classes based on a visual assessment of the seed. The average size of the different classes, smallest to largest, were 0.6, 1.1, 1.6 and 2.3 g per 100 seeds for the BCP.. whilst the 100 seed weight for the BCP 2 classes were 0.7, 1.4,2.2, and 2.9 g, respectively. A somewhat wider range of variation was observed in the size of seeds obtained from the F I plants in the var. macrosperma x wild population, and the seeds were classified visually into five different size classes. The average weight of 100 seeds for seed classes 1 to 5 were 1.9,2.7,3.3,3.9, and 4.4 g, respectively.. Several qualitative (Table 6.1) and quantitative (Table 6.2) attributes, based in part on the descriptors used by James and Lawn (1991) and Grant et al. (2003), were observed and measured for each single plant within both the Bali x wild and var. macrosperma x wild populations. All the qualitative and quantitative descriptors were scored and measured as outlined in Section 3.2, with the exception that data on flowering, and pod and seed traits were not obtained from many of the Bali cultivated x wild plants. Firstly, due to their extreme sensitivity to photoperiod, all the Bali plants and some of the backcross plants to the Bali parent had not produced flowers by the time the experiment was necessarily ended (late December 2008). Given the experience with the Bali accessions in Experiment 1 (Chapter 3), it is likely that these plants would not have flowered until the shorter days of autumn (March - April). Secondly, the F. plants and most of the backcross plants that flowered failed to set pods.. 93.
(16) Table 6.1 Qualitative traits obsenTed in the inheritance studies with cultivated Bali x wild and with var. macrosperma x wild hybrid populations of V. vexillata. Trait. Definition. Leaflet shape. 1. Linear lanceolate leaflets with obtuse bases 2. Ovate leaflets with cuneate bases. 1. Narrow; mean length/width ratio> 2.5. Leaflet width. 2. Broad; mean length/width ratio « 2.5. 1. Short « 0.5 mm). Leaflet pubescence. 2. Long (> 0.5 mm). 1. Full anthocyanin (node and internode of the stem). Stem pigmentation*. 2. Node anthocyanin 3. No anthocyanin. 1. Dehiscent. Pod dehiscence. 2. Non - dehiscent. 1. Black speckled or dark brown, dull. Seed testa colour & lustre. 2. Light brown or tan, shinny 1. Apparent immunity to powdery mildew. Disease reaction. 2. Susceptibility to powdery mildew Tuber form. 1. Simple 2. Compound 3. Forked. * Observed in cpr 69030 x Ace 390 population only Table 6.2 Quantitative traits observed in the inheritance studies with cultivated Bali x wild and with var. macrospenna x wild hybrid populations of V. vexillata. Traits. Measurement. th. Size of terminal leaflet on 6 trifoliolate leaf. mm; length & width. th. Stem thickness at primary node, at 6 trifoliolate leaf stage. mm; diameter. Flowering. Date when first flower opened. First mature pod. Date when first pod ripened. Seed yield per plant. g/plant for first flush of pods. Dry above-ground biomass. g/plant. Fresh weight of tuberous root at final harvest. g/plant. Dry weight oftuberous root at final harvest. g/plant. Tuber diameter at widest point. mm; per plant. Weight of 100 seeds. g/100 seeds. Number of seeds per pod. 10 pods per plant; random. Pod length and width at pod maturity. mm; first 5 mature pods per plant. Number of flowers per peduncle. 5 peduncles per plant; random. Number of pods per fertile peduncle. 5 peduncles per plant; random. 94.
(17) For the qualitative traits (Table 6.1), the goodness of fit of a model assuming the simplest case of single gene control was first tested (Griffiths et al. 2008). The segregation ratios that were observed in the three segregating generations (F2 , BC p !> BC P2) were compared wilh expeclalions from the model for single gene control. If the Chi-squared probability was <0.90, digenic control was also tested. The goodness of fit was tested using GENSTAT IV and SPSS 16.0 Graduate Student Version software (SPSS, Inc). For the quantitative traits (Table 6.2), broad sense and nan-ow sense heritability were calculated by the variance ratios method (Allard 1999). Broad sense heritability is estimated on the basis of all genetic effects, whereas nalTOW sense heritability is estimated solely using an estimate of additive variance (SIeper and Poehlman, 2006). Variance of each component in the variance ratios method was calculated using SPSS 16.0 Graduate Student Version software (SPSS, Inc). Broad sense heritability is estimated from the formula: h2b = VGNp , whilst nalTOW sense heritability is estimated from the formula: h2n = VAN p (Sieper and Poehlman, 2006).. Two F I hybrids between the var. macrosperma accession CPI 69030 and wild accessions, one from Africa and one from Australia (Table 4.2b), were selected for further observation, together with the respective parental genotypes, for the qualitative and quantitative traits measured in Experiment 1 (Table 6.1,6.2). For each of these two genotype combinations, four individual F 1 plants, together with four plants of each of the parents, were grown in the shade house. The hybrid and parental genotypes were an-anged in rows on the bench top, with each genotype moved two times during the experiment, and individual plants within each genotype moved every two weeks, in order to reduce possible spatial effects. Simple ANOVA analyses were performed using SPSS 16.0 Graduate Student Version software (SPSS, Inc) to assess the extent of variation for the qualitative and quantitative traits among the parental and F 1 genotypes. In the event, it was not possible to obtain a complete set of data observations for the hybrid combination CPI 69030 x CPI 60458, due to photoperiod sensitivity. In the subsequent analyses, where data for CPI 69030 and CPI 60458 were missing, data for these accessions from Experiment 1 were used instead. In this same cross, complete data were obtained from only one of the four F 1 plants, because like CPI 60458, the other F 1 plants failed to flower before the experiment had to be terminated.. 95.
(18) 6.3 Results and discussion 6.3.1 Population development As previously discussed in Chapter 4, population development was carried out on three hybrid combinations, namely, Bali cultivated x Bali cultivated accessions, wild x Bali cultivated accessions, and var. macrosperma x wild accessions. Because there were almost no genotypic differences identified either within or between the different provenances of the Bali accessions (see Chapter 3), it was considered that there would be very limited useful information to be gained from further studies of those hybrid populations. Therefore, no further evaluation of those hybrid populations was undertaken. The results of the population development studies with the other hybrid populations are outlined below.. 6.3.1.1 Backcross populations involving Bali cultivated and Australian wild accessions Apart from providing the opportunity to establish the extent that hybrid fertility could be restored through backcrossing, the backcross progeny from the Bali cultivated x Australian wild hybrids provided an opportunity to gain some preliminaly information on the inheritance of cultivated vs. wild traits in V vexillata. Two hybrid populations were available for this purpose: ACC 390 x Jim lA and ACC 390 x Jim 2. For these F I hybrids, a limited number of successful backcrosses to both the cultivated and wild parent were achieved for later study of the inheritance of cultivated vs. wild traits.. Backcrosses that attempted to use the Bali x wild hybrid plant as the pollen donor were invariably unsuccessful, regardless of the particular combination of genotypes that was involved, regardless of whether the wild parent or the Bali parent was the pollen receptor, and regardless of whether the pollinations were done in the shade house or in the open garden environment. In all instances, the cross-pollinated flowers abscised 1-2 d after pollination. No evidence of pod development was observed from many (> 50) cross pollinations.. In contrast, most of the pods from the attempted backcrosses that used either the wild or cultivated parent as the pollen donor and the F I hybrid as the pollen receptor, showed some level of development, even though most subsequently abscised within ten days after pollination (DAP). (Figure 6.1). The pattern of pod development / abscission was similar in the two. different locations where the backcrosses were attempted, the shade house facilities (Figure 6.la-d) and the open garden environment (Figure 6.le), with the highest number of pods abscising around 5 - 6 DAP. Likewise, the pattern of pod development / abscission was similar regardless of whether the wild or cultivated parent was the pollen donor, or whether Jim lA or Jim 2 was the cultivated parent.. 96.
(19) ;I=====================jl~[]~p~O~ds~s~U~m~'Y~al~ar~te~r~PO~I~lin~~~io~n~-. :!. .1 :t I:~:~~----------- 1113~1::; 1.--------. - -: -: -: -. ~!. I. ~" ~, ~,~ !, [:,:' ,::. ,: 2. I. 3. 2. S. 4. 3. 6. 5. 0;. 7. 6. 8. 1. 9. 8. ---------------z:r"m,'ftj ftj""*;''''''i'Z»', ....... m. 10. 9. II. 10. 12. II. 13. 12. 14. 15. 16. 17. OJ,.., d,"ftj'. ~'W'?"''''''CZ''. 19 20 21 22 23 24 25 26 27 28 29 30 3 I J2 H. 18. Da)'s aftcr po Ilinatio n(DAP). 13. 14. IS. l6. 17. l8. 19 20. 21 12 23. Days aftcr pollination (DAP). 24 25 26 27. 28 29 30. 34 35. 3] 3Z 33 34 31. , tI Pads survival after pollin;~-iOnJ-. 2. I. 3. S. 4. 7. 6. 9. 8. 10. II. 12. 14 IS. 13. 16. 17. 18 19 20 21. n. 23 24 2S 26 27 2R 29 30 31 32 33 34 3S. Dnys nftcr pollin.tion (DAP). 10. ID Pods survival aflcr po LUmuion j.. -. -. -. AI. ~. fJ I. 2. 3. 4. S. 6. 7. S. 9. ~ 10. II. 12. ~RlI~~. r::lIRlI IJ. 14. IS. 16. 17. IS. 19 20. 21 22. Days after pollination (DAP). 23 24 25 26 27 28. 90. I. 80. I. 29 30 31 J2 33. 34 35. D Pods survival afterpollination. I-. 70 60. I. -. 50. 40 30 20 10. -. 'IJ I. ~. ~ ~ 2. 3. ~"'rJl. 4. 5. 6. 7. 8. 9. 10 II. ll!I 12. Il. 14 Da~'s. 15. 16. 17. 18. 19. 20 21. 22. 23. 24. 25. 26. 27. 28. 29. )0 31. J2. 33 34. 3S. after pollination (DAP). Figure 6.1 Pod survival time after pollination recorded when cultivated Bali x wild Australian hybrids were backcrossed to the parents, using the respective parent as the pollen donor: a. ACC 390 to ACC 390 x Jim lA in the shade house; b. Jim lA to ACC 390 x Jim lA in the shade house; c. ACC 390 to ACC 390 x Jim 2 in the shade house; d. Jim 2 to ACC 390 x Jim lA in the shade house; e. Jim 2 to ACe 390 x Jim lA in the open garden environment.. 97.
(20) Interestingly, very few flowers abscised within 1-2 DAP where the F 1 hybrid was used as the female parent (Figure 6.1). This suggested that in most instances, the cross-pollination process was successful and that some pod development was stimulated as a result of fertilisation of one or more ovules. Presumably, the subsequent abscission of most pods occuned as a consequence of the collapse of the developing seed embryos post-fertilisation. This pattem contrasted with the failure of the F 1 pollen to stimulate any pod development when transfened to the parent flowers which invariably abscised within 1-2 DAP. The latter response was not surprising in view of the low viability of the F 1 pollen as described in Chapter 5.. The backcross pods that survived beyond 12 DAP matured between 23 DAP and 31 DAP for the backcrosses in the shade house (Figure 6.1a-d), and between 23 DAP and 35 DAP for the backcrosses in the open garden environment (Figure 6.1 e). In most instances, these pods contained only one or two viable backcross seeds, although in a small number of instances, up to 4 viable seeds were obtained. A frequency distribution of the numbers of seeds per pod, summed across the five populations shown in Figure 6.1, is shown in Figure 6.2. The fact that most of the pods were single-seeded (Figure 6.2) implies that one viable seed was sufficient to prevent abscission, at least in these instances.. The small number of viable backcross seeds indicated that there was a high level of hybrid breakdown in those pods that survived to maturity, with the overwhelming majority of embryos failing to survive post-fertilisation. No attempt was made to dissect the small pods of the F 1 hybrid to count the number of ovules per pod. The mid-parent mean for seeds per pod based on Experiment 1 was 17 seeds (see chapter 3). Using this mean as an estimate of the potential backcross embryos would imply that for those backcross pods that survived to maturity (Figure 6.2), 10% of embryos survived. When the population of backcross pods that did not survive to maturity is considered (Figure 6.1), only 1% of possible embryos survived.. 2. 4. Number of seeds per pod. Figure 6.2 Frequency distribution of the numbers of seeds per backcross pod observed in cultivated Bali x Australian wild hybrids.. 98.
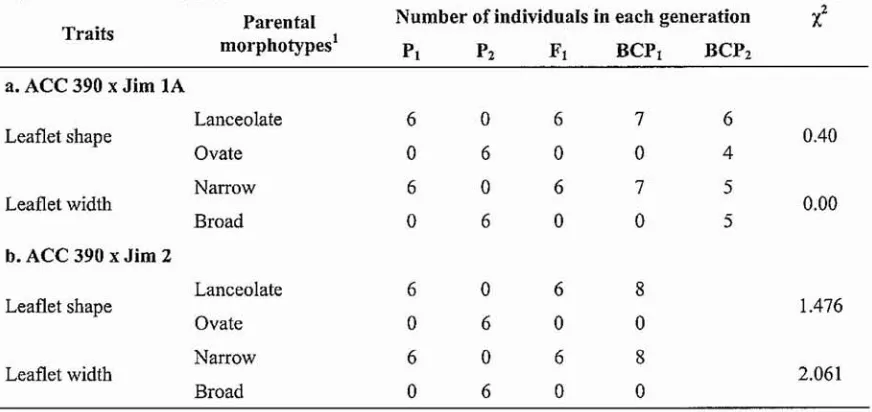
(21) 6.3.1.2 Hybrid population bet-ween var. macrosperma and Austi'alian wild accessions As discussed in Chapter 3, there was considerable similarity observed in Experiment 1 between var. macrosperma CPI 69030 and the Bali cultivated accessions for a range of traits typically associated with domestication, e.g. larger seed size, non-dehiscence of pods, thick stems, broad leaflet shape and large leaflet size. Therefore, the hybrid combination of var. macrosperma. cpr. 69030 x wild Australian accession ACC 390 provided a useful model for further exploring the inheritance of wild vs. cultivated traits, complementing the evaluation of the wild Australian x Bali cultivated backcross populations.. Backcrosses and F 2 generation development were carried out between May 2, 2008 and September 14,2008. There was almost no difficulty in obtaining backcross seeds (about four to eight seeds per backcross pod) and self-F. seeds for F2 generation (about seven to 11 seeds per pod), with the only exception being a limited number of cpr 69030 flowers readily available to backcross to the Fl. Because of the lack of suitable CPI 69030 flowers when the F 1 hybrid was flowering, fewer BCP 1 seed were obtained than planned. Thus, fewer than planned BCP. seeds were available for sowing when the time came to sow the main experiment exploring the inheritance I heritability of the cultivated vs. wild traits. Additional backcrosses were made to obtain more BCP 1 seed when a later flush of flowers became available on the CPI 69030 parent. These additional seeds were of necessity sown later than the main population. As discussed in Section 6.2.3, the additional later sown BCP 1 plants were used to provide additional infonnation on qualitative tTaits only.. 6.3.2 Phenotypic attributes in the Bali cultivated x Australian wild backcross populations Because the F I plants of the Bali cultivated x Australian wild hybrid populations were unable to self to produce F2 seed, the chi-square goodness of fit test was performed only using the backcross data, to compare the segregation ratios of selected qualitative traits, which were observed in the backcross populations, with the expected model ratios. The goodness of fit was considered to be statistically significant (i.e. P < 0.05) where the probability of a larger chisquare value than that observed was> 0.95. In the first instance, the simplest model of single gene control was tested for each trait, as is illustrated in Table 6.3 for the inheritance of broad vs. nalTOW leaflets in the ACC 390 x Jim IA backcross population.. Even though there were no F2 generation observations available, the results of the chi-square test for both of the ACC 390 x Jim IA and ACC 390 x Jim 2 hybrid combinations (Table 6.4), were consistent with the model that leaflet shape was controlled by a single dominant gene, as. 99.
(22) reported by James and Lawn (1991). The wild type lanceolate shape in Ace 390 was apparently dominant to the ovate shape in the Bali cultivated accessions. Meanwhile, in terms of leaflet size, which was measured as terminal leaflet width, again the wild leaflet size (narrow size) was apparently controlled by single dominant gene, which was apparently completely dominant to the cultivated leaflet size (broad size) (Table 6.4). This result was different to the study of James and Lawn (1991) which found that the broad leaflet trait of African wild accessions was completely dominant to the nan-ow leaflet type of Austronesian wild accessions.. Table 6.3 The model used to test the hypothesis of segregation ratios based only on the Bali cultivated x Australian wild backcross populations. The hypothesis was that lanceolate leaflet shape was conditioned by a single dominant gene in the cross between ACC 390 (P t ) and Jim lA (P2)' Generation. Traits. Observed (0). Expected (E). Deviation (D). D2/E. Lanceolate. 7. 7. 0. 0. Ovate. 0. 0. 0. 0. Lanceolate. 6. 5. I. 0.2. Ovate. 4. 5. -1. 0.2. Sum:. 004. Backcross to PI (ACC 390). to P2 (Jim lA). Probability (P) of a larger Chi-Square value> 0.99. Table 6.4 Number of individuals within the different phenotypic classes in each generation and the chi-square values for leaflet shape and leaflet width traits observed in two Bali cultivated x Australian wild hybrid popUlations (a) ACC 390 (PI) x Jim lA (P2) and (b) ACC 390 (p.) x Jim 2 (P2).. Traits. Par"ental morphotypes l. Number of individuals in each generation PI. P2. FI. Bep t. BCP2. Lanceolate. 6. 0. 6. 7. 6. Ovate. 0. 6. 0. 0. 4. Narrow. 6. 0. 6. 7. 5. Broad. 0. 6. 0. 0. 5. Lanceolate. 6. 0. 6. 8. Ovate. 0. 6. 0. 0. Narrow. 6. 0. 6. 8. Broad. 0. 6. 0. 0. ·l. a. ACC 390 x Jim lA Leaflet shape. Leaflet width. 0040. 0.00. b. ACC 390 x Jim 2 Leaflet shape. Leaflet width. 100. 1.476. 2.061.
(23) As was observed in Experiment I, the Bali cultivated accessions were strongly photoperiodsensitive, and they again failed to flower in this evaluation, which was sown as days were lengthening in late spring. In contrast, the Australian wild accession produced flowers within 38. to 40 DAS (Table 6.5). Likewise, all of the F I plants from the Bali cultivated x Australian wild hybrid combinations flowered - within 47 to 55 DAS in ACC 390 x Jim lA and 49 to 56 DAS in ACC 390 x Jim 2 (Table 6.5). Again as was observed in Experiment 2, there were no pods set on the F I plants, even when 'tripping' was undertaken to ensure pollen was released onto the floral stigma.. Six of the seven BCP 1 plants from the ACC 390 x Jim lA population, and six of the eight BCP 1 plants from the ACC 390 x Jim 2 population flowered during this experiment. In contrast, only three of the ten BCP2 plants of the ACC 390 x Jim IA and nine of the 41 BCP z plants of the ACC 390 x Jim 2 flowered. When considered together with the response of the F] generation, the data would seem to suggest that additive gene action for time to flowering. Time to flowering of the F I plants was within the parental range, although it appeared that the performance of the progeny was closer to that of the wild parent. When the F 1 was backcrossed to the earlier (wild) parent, more of the progeny flowered, whereas when the F] was backcrossed to the later (cultivated) parent, only a small number of progeny flowered. The fact that some BCP2 plants flowered indicated that it may be possible to undertake a backcross program using the cultivated Bali accession as the recurrent parent, but with selection for earliness to flower, to transfer the earliness trait from the wild to the cultivated germplasm. As such, it is likely that the wild material could potentially provide a genetic source of earliness which would obviate the strong photoperiod sensitivity of the Bali cultivated accessions.. Of the BCP t progeny from the wild x Bali populations, only two plants from each combination set pods successfully. Three of these plants set pods only when 'tripping' was conducted, whilst one of them set pods freely. All of the BCP z plants from both populations failed to set pods even when 'tripping' was conducted. This response suggested that hybrid fertility could be restored through backcrossing to the wild parent.. It was not clear whether the failure for hybrid fertility to be restored through backcrossing to the. Bali cultivated parent was absolute, or whether it may have been due in part to environmental effects such as temperature or photoperiod. For example, the failure may have been caused by high temperatures, which were constantly above 35°C during flower development period (about week 5 to week 9 - Figure 6.2) reducing the pollen viability in the BCP2 plants. Exposure to high temperatures during the flower development period (pre-anthesis) can reduce pollen viability in groundnut (Prasad et al. 1999) and common bean (Porch and Jahn 2001).. 101.
(24) Alternatively, pod set in the BCP 2 plants may have been suppressed by the lengthening days, given the generally greater sensitivity of the cultivated Bali genotypes to longer photoperiods.. 45.0 . , . . - - - - - - - - - - - - - - - - - - - - - - - - - - - - - - -. ~-=;:::==:;::==ii==::a:::::::;:==:;;:=::a::=:;==. --. ----. 40.0 I . . - - . • • . - - -••- .......I----I.----l•.--~.35.0 + - = - - - - - - - - - - - - - - - - - - - - - - - - - - - - - - - -. G ~. 30.0 +----. ... ~. ~ 25.0 i--------_---~-r-----~L-----~----=~==----:=:.;=:::::;..~==::;a. .~:::;....:~ 2o.0+1-"'---;-"~ .. ~~ ~. 15.0 + - - - - - - " " - - - - - - - - - - - - - - - - - - - - - - - - -. Eo<. 10.0. +-il------------------C:=w::i.:1:-:::-;;;:ii:'"::-::l - . - Weekly mean daily minima. 5.0. Weekly mean daily maxima -. 0.0. +I-------------------~I. +---,----.-~--~-_._____-___.__-~-_____,--_.___-~-----,----~--.________,. 2. 3. 4. 5. 7. 6. 8. 9. 10. II. 12. 13. 14. Weeks after sowing. Figure 6.2 Weekly means for daily minimum and maximum temperatures in the shade house during evaluation of ACe 390 x Jim lA and ACC 390 x Jim 2 backcross populations.. Given that only 9 of the 41 BCP z plants flowered before this experiment was necessarily telminated, it is possible that some self-fertile plants may have been identified in the remaining late flowering plants. Regardless, given that it was possible to produce viable BCP z plants, it is likely that further backcrossing to the cultivated parent would likewise be successful, and that over subsequent backcrossing generations, fertility would have been restored.. In tenns of numbers of flowers per peduncle, the F I plants exhibited three to four flowers per peduncle, which was intennediate between the wild Australian genotype (mean 1.8 flowers per peduncle, Table 6.5) and the Bali cultivated parents (mean 8.3 flowers per peduncle, Table 3.7). The numbers of flowers per peduncle in the BCP!, for both hybrid combinations, were similar to the F I, whilst the numbers of flowers in the BCP z was slightly closer to the Bali cultivated parent (Table 6.5). This might suggest that after the hybridisation between cultivated Bali accessions and wild accessions, for instance to transfer the photoperiod insensitivity, number of flowers per peduncle of the cultivated Bali parent could be recovered by backcrossing to the cultivated parent.. 102.
(25) Table 6.5 Putative quantitative traits observed in parents and their progenies for the ACC 390 (P t ) x Jim lA (P 2) and ACC 390 (PI) x Jim 2 (P 2) backcross populations. n. a. = dat(l/lOt (IVai/able, I/.m. = data /lot measured.. Traits. F,. Pz. PI. Range. Mean. BCP z. BCP t Range. Mean. Range. Mean. Range. Mean. Range. Mean. 1.8. I. 7 - 1.9. n.m. 2.7. 2.4 - 3.3. 2.4. 2.4 -2.6. 3.5. 2.6 - 5.0. 137.4. JlO.7-160.8. 147.1. 115.6 - 224.4. 141.7. 124.5 - 158.4. a. ACC 390 x Jim lA i. Morphological traits Stem thickness (mm) Terminal leaflet length (mm). 166.1. 143.4 -175.4. n.m. Terminal leaflet width (mm). 10.1. 8.5 - 11.2. n.m. 21.8. 16.4 - 28.8. 21.6. 18.9 - 25.1. 61.9. 30.7 - 80.6. Leaflet length/width ratio. 16.6. 15.2 - 17.4. n.m. 6.4. 5.6 - 7.0. 6.8. 5.4 - 10.4. 2.9. 1.7 - 5.2. Flowers per peduncle. 1.8. 1.6 - 1.8. n. a. 3.5. 3.0 - 4.2. 3.4. 2.4 - 3.8. 5.8. 3.0 - 7.3. Pods per fertile peduncle. 1.7. 1.6 - 1.8. n. a. n. a. 1.5. 1.5. n.a. Pod length (mm). 110.5. 107.4-114.2. n. a. n.a. 56.6. 56.6. n.n. Pod width (mm). 4.2. 4.2. n.a. n.a. 4.8. 4.8. n. a. Seeds per pod. 19.7. 19.5 - 20.1. n. a. n.a. 1.3. 1.0 - 1.6. n.a. 1.3. 1.2 - 1.3. n. a. n. a. 1.8. 1.5 - 2.1. n.a 13.1. 7.3 - 20.4. 14.0 - 86.0. 100 seeds weight (g). 13.6. 11.4-17.9. 8.1. 5.7 - 11.2. Dry above-ground biomass (g). 25.7. 14.0 - 34.0. 54.7. 46.0 - 64.0. Total dry matter (TDM) (g). 42.6. 35.9 - 50.1. n.a. n. a. 69.1. 52.1 - 86.0. n.a. Total seed yield per plant (g). 9.9. 9.6 - 10.3. n. a. n. a. 0.1. 0.1. n.a. Tuber fresh weight (g). 46.0. 32.0 - 62.0. 22.0. 18.0 - 28.0. 73.6. 48.0 - 110.0. 62.3. 28.0 - 84.0. 41.8. 18.0 - 98.0. Tuber dry weight (g). 7.0. 4.0 - 12.0. 1.0. 0.0 - 2.0. 12.8. 6.0 - 22.0. 10.3. 2.0 - 16.0. 4.4. 0.0 - 18.0. Seed harvest index (SRI). 0.3. 0.2 - 0.3. n. a. Tuber diameter (mm). 18.7. 14.9 - 22.5. 16.4. 12.0 - 24.2. 41.2. 12.0 - 82.0. 46.6. 14.0 - 80.0. 45.6. ii. Agronomic traits. n.a. 0.0. 0.0. n.a. 1.2. 1.0 - 1.3. n.a. 53.3. 45.0 - 82.0. 61.3. 1.1. 0.7 - 1.7. n. a. n. a. Flowering (d after sowing). 40.0. 38 - 43. n. a. 52.4. First mature pod (d after sowing). 56.2. 54 - 60. n. a. n.a. 80.5. 80 -81. n.a. Seed development period (d). 16.2. 16 - 17. n. a. n. a. 17.5. 17 - 18. n. a. Tuber harvest index (TRI). iii. Phenological traits 47 - 55. 57 - 68.
(26) Table 6.5 eon/.. Mean. F1. P2. PI. Traits. Range. Mean. Range. BCP 2. BCP\. Mean. Range. Mean. Range. Mean. Range. b. ACC 390 x Jim 2 i. Morphological traits Stem thickness (mm). n.m. 2.7. 2.4 - 3.1. 2.3. 1.9 - 2.5. 3.8. 3.0 - 5.2. Terminal leaflet length (mm). n.m. 130.7. 118.4 -145.2. 158.5. 141.5-181.4. 167.1. 132.1 - 194.4. Tenninalleaflet width (mm). n.m. 23.6. 21.0 - 29.4. 15.0. 10.2 - 18.6. 41.2. 30.0 -75.8. Leaflet length/width ratio. n.m. 5.6. 4.6 - 6.9. 11.1. 7.7 - 14.0. 4.7. 1.7 - 6.5. Flowers per peduncle. n.a. 3.6. 3.2 - 4.0. 2.8. 2.0 - 4.0. 4.4. 3.0 - 5.7. Pods per fertile peduncle. n.a. n. a. 1.5. 1.4-1.6. n.a. Pod length (mm). n.a. n. a. 68.6. 56.9 - 80.3. n.a. Pod width (mm). n.a. n. a. 3.7. 3.6 - 3.7. n.a. Seeds per pod. n.a. n. a. 6.1. 3.9 - 8.2. n. a. 100 seeds weight (g). n.a. n. a. 1.1. 0.9 - 1.3. n. a. Tuber diameter (mm). 5.0. 1.7 - 8.2. 27.5. 24.1 - 37.2. 25.5. 18.2 -35.5. 11.1. 4.1 - 20.0. Dry above-ground biomass (g). 52.3. 46.0 - 60.0. 42.5. 28.0 - 50.0. 30.8. 14.0 -52.0. 48.2. 6.0 - 100.0. Total dry matter (TDM) (g). n.a. n. a. 42.6. 40.9 - 44.3. n.a. Total seed yield per plant (g). n. a. n. a. 0.6. 0.3 - 0.9. n. a. Tuber fresh weight (g). 12.0. 8.0 - 16.0. 65.5. 56.0 -72.0. 89.5. 52.0 - 150.0. 31.7. 12.0 - 64.0. Tuber dry weight (g). 0.0. 0.0. 14.0. 10.0 - 16.0. 19.5. 10.0 - 30.0. 3.2. 0.0 - 10.0. Seed harvest index (SH1). n. a. n. a. 0.00. n. a. Tuber harvest index (THI). n. a. n. a. 0.0 2.4. 1.4-3.4. n. a. n. a. 51.8. 46.2. 39 - 52. 54.8. ii. Agronomic traits. iii. Phenological traits Flowering (d after sowing) First mature pod (d after sowing) Seed development period (d). n. a n. a. 104. 49 - 56. n.a. 68.5. 65 -72. n.a. n. a. 16.0. 16. n. a. 39 - 61.
(27) In this evaluation, the Bali cultivated parents had small values for tuber attributes, compared to the wild parent and the F (, F 2 and backcross generations (Table 6.5). This result was surprising, given that the Bali accessions are grown for their tubers. However, it is likely that the small tuber growth of these accessions was an artefact of the environmental conditions under which the plants were grown in this evaluation. Days were lengthening through most of the growing period and flowering in the Bali accessions was completely inhibited. In other quantitative short day plants, tuber formation is promoted under short photoperiods, as reported by Okubo et al. (1992) in winged bean (Psophocarpus tetragonolobus). In V. vexillata, Karuniawan and Lawn (2007) reported that artificial day length extension promoted vegetative growth, and reduced partitioning of dry matter into tubers.. 6.3.3 Evaluation of selected attributes in var. macrospel'ma x wild African hybrids. Generally, all the accessions and their hybrids that were evaluated in these studies exhibited ovate leaflet shape and broad leaflet size, but a mixed reaction to powdery mildew (Table 6.6). The fact that even the parents showed a mixed reaction to powdery mildew suggested that the observed differences were probably due to chance escape of infection by some plants. Based on the observations presented in Table 6.6, it appeared that dehiscent pod was dominant over non dehiscent pod, because both of the hybrid combinations between var. macrosperma (which exhibited non dehiscent pods) and the two wild African accessions (which exhibited dehiscent pods) had dehiscent pod attributes. A similar result was also observed for the seed testa pattern attribute, where black speckled was apparently dominant over uniform seeds (Table 6.6).. Table 6.6 Six qualitative traits observed in var. macrospel'ma x wild African hybrids and their parents.. Leaflet shape. P2 (CPI 29141) Ovate. FI (CPI 69030 x CPI 29141) Ovate. PI (CPI 69030) Ovate. FI (CPI 69030 x CPI 60458) Ovate. P2 (CPI 60458) Ovate. Leaflet width. Broad. Broad. Broad. Broad. Broad. Long. Long. Long. Short. Short. Dehiscent. Dehiscent. Non dehiscent. Dehiscent. Dehiscent. Speckled. Speckled. Unifonn. Speckled. Speckled. Mixed reaction. Mixed reaction. Mixed reaction. Mixed reaction. Mixed reaction. Traits. Leaflet hair length Pod dehiscence Seed testa pattern Disease reaction. 105.
(28) Some quantitative traits were measured on the. cpr. 69030 x. cpr. 29141 and. cpr. 69030 x. cpr. 60458 hybrids and their parents. Simple ANOVA and Least Significant Difference (LSD) tests were performed to test the level of differences among the. cpr 69030, cpr 29141, and F 1 means. and to estimate whether the F 1 performance for a specific trait was closer to the male parent (Cpr 69030) or the female parent (Cpr 29141) (Table 6.7).. Table 6.7 Putative quantitative traits observed in parental morphotypes and their hybrid for the CPI 69030 x CPI 29141 hybrid population. Means within a row followed by the same letter are not significantly different (P > 0.05). PI. Traits. (CPt 69030). FI. Pz (CPt 29141). a. Morphological traits Stem thickness (mm). 4.8 a. 2.6 b. 2.4 b. Tenninalleaflet length (mm). 130.9 b. 103.0 c. 142.8 a. Tenninalleaflet width (mm). 53.8 b. 64.8 a. 59.4 b. Leaflet length/width ratio. 2.4 a. 2.2 b. 1.7 c. Flowers per peduncle. 3.5 a. 3.7 a. 3.7 a. Pods per fertile peduncle. 2.7 a. 2.8 a. n.m. Percentage of setting pod (%). 75 a. 77a. n.m. Pod length (mm). 137.3 a. 102,4 b. 94.2 c. Pod width (mm). 5.9 a. 5.2 b. 4.1 c. Seeds per pod. 18.5 a. 11.5 c. 16.9 b. 100 seeds weight (g). 5.3 a. 3.4 b. 1.7 c. Tuber diameter (mm). 22.9 a. 18.7 b. 11.5 c. Dry above-ground biomass (g). 7.0 b. 16.0b. 58.0 a. Total dry matter (TDM) (g). 37.1 b. 66.4 a. 39.5 b. Total seed yield per plant (g). 16.1 a. 13.5 b. 5.9 c. Tuber fresh weight (g). 64.5 a. 42.0b. 29.0b. Tuber dry weight (g). 15.5 a. 1O.0b. 2.5 c. Seed harvest index (SHI). 0.4 a. 0.3 b. 0.1 c. Tuber harvest index (THI). 1.6 a. l.lb. 0.5 c. Flowering (days after sowing). 44.0 a. 51.7b. 73.5 c. First mature pod (days after sowing). 66.0 a. 69.7 a. 92.0b. Seed development period (days). 22.0 b. 18.0 a. 18.5 a. b. Agronomic traits. c. Phenological traits. A complete set of data for the 69030 x the wild African parent,. cpr. cpr 60458 cross was. not obtained (Table 6.7) because. 60458, and three of the four putative F 1 hybrid plants, were. 106.
(29) strongly photoperiod sensitive and did not flower within the experimental period. For comparative purposes, some data for reproductive stage attributes of CPI 60458 were substituted with results from harvest 1 Experiment 1. While useful for comparative purposes, it was not appropriate to analyse these data statistically, due to possible environment (E) effects and genotype x environment (G x E) interaction effects between the two studies.. For most of the quantitative traits, the F I plant phenotype was intermediate between the parental lines, CPI 69030 and. cpr. 29141, for instance, terminal leaflet length/width ratio, pod length,. pod width, 100 seeds weight and tuber diameter (Table 6.7). Meanwhile in some traits, e.g. tenninal leaflet width, and TDM, the F I plants had higher values than the higher parent value, whilst for terminal leaflet length and seeds per pod, the F I plants had lower values than the lower parent value (Table 6.7).. Number of pods per fertile peduncle and percentage of setting pods were only calculated in the. cpr 69030 and the F I plants, because the flowers of cpr 29141 were 'tripped' by hand to obtain pods and seeds, due to general failure to set pod in the shade house as described in Experiment 2 (Chapter 4). It suggested that the degree of self-pollination was presumably heritable qualitatively. There were no significant differences between CPI 69030 and the F I in those two traits. This was of interest because like. cpr 29141, the cultivated Bali accessions also exhibited. lower levels of self-pollination as observed in Experiment 2 (Chapter 4).. There was some degree of dominance observed in stem thickness, first mature pod and seed development period, as indicated by the F I performance being relatively closer to one parent compared to the other parent (Table 6.7).. Even though there were significant differences. between those three generations in flowering time, the F I performance was relatively closer to. cpr. 69030 in tenns of the first mature pod trait, because the F I plants had a shorter seed. development period than cpr 69030, which was similar to. cpr 29141 (Table 6.7).. For many traits, the performance of the F I plant of the CPI 69030 x CPI 60458 cross were also intermediate between the two parental lines (Table 6.8), as observed in the F I plants of the. cpr. 69030 x CPT 29141 cross (Table 6.7). In some traits, such as pod length, pod width, and 100 seed weight, the F I performance was consistently intermediate between the two parental lines in both these hybrids combination, whilst in number of seeds per pod, the F I performance was lower than the lowest parent lines. From those data, it would seem to suggest that additive gene action for that pod length, pod width and 100 seed weight. Meanwhile, even though it was suggested that additive gene action was observed for pod length, it appeared that the. 107.
(30) perfonuance of the progeny was closer to that of the parent that exhibited the shorter pods. Presumably, the increase in seed size was not accompanied by a significant increase in pod length, as a consequence, lower numbers of seeds per pod were observed in both hybrid combinations (Table 6.7, 6.8). It suggested that there was a small degree of dominance in that trait, as reported by Leleji (1975) in cowpea that short pod was partially dominant over long pod. Table 6.8 Putative quantitative traits observed in parental morphotypes and their hybrid for the CPI 69030 x CPI 60458 hybrid popUlation. The values were the mean values for each trait in each generation.. Traits. PI. P1. FI. (CPI69030). (CPI60458). a. Morphological traits Stem thickness (mm). 7.0. 4.2. 2.3. Terminal leaflet length (mm). 144.8. 116.0. 77.0. Terminal leaflet width (mm). 88.5. 69.3. 43.7. Leaflet length/width ratio. 1.6. 1.7. 1.8. Flowers per peduncle. 4.0. 3.4. 2.7. Pods per fertile peduncle. 2.9. 2.6. 1.9 1. Pod length (mm). 147.6 1. 105.0. 89.5 1. Pod width (mm). 6.4 1. 5.0. 4.1 1. Seeds per pod. 19.i. 9.4. l1.i. 1. 3.6. 1.0i. 100 seeds weight (g). 4.89. Tuber diameter (nun). 8.9. 5.4. 3.5. 52.5. 44.0. 29.7. Tuber fresh weight (g). 28. 38. 11. Tuber dry weight (g). 3.5. 6. 0. 84.7. 58.0b. 96.0. 16.3 3 16.0 Seed development period (days) • Values were obtained from harvest 1 Experiment I data; b Only 1 F1 plant flowered. 15.0'. b. Agronomic traits Dry above-ground biomass (g). c. Phenological traits Flowering (days after sowing). As was observed in the Bali cultivated x Australian wild backcross populations (Section 6.3.2), tuber vs. shoot and flower formation in the two populations of var. macrosperma x African wild hybrids appeared to be affected by photoperiod. The. cpr. 69030 x. cpr. 60458 evaluation. cpr 69030 x cpr 29141 evaluation, which was sown earlier. The values for tuber attributes of cpr 69030 in the cpr 69030 x cpr 60458 evaluation (Table 6.8) were lower than the values in cpr 69030 x cpr 29141 evaluation (Table experienced longer days (> 14 hours) than did the. 108.
(31) 6.7). In contrast, dry above-ground biomass of CPI 69030 was higher in the CPI 69030 x CPI 60458 evaluation, compared to the CPI 69030 x CPI 29141 evaluation. Meanwhile, the lengthening days during summer in the evaluation of CPI 69030 x CPI 60458 delayed flowering in both parental lines and the three of the four the F 1 plants. Interestingly, one of the four F 1 plants, which flowered during evaluation, flowered earlier than both parental lines (Table 6.8). This might suggest that heterosis in time to flowering occurred in this hybrid combination.. In order to obtain complete data for all four F I plants in the hybrid population of CPI 69030 x CPI 60458, the three F 1 plants that had not flowered by the end of the experiment were pmned back as outlined in Section 3.2.4. However, approximately 3 weeks after they were pruned back, those F I plants died, perhaps because of the limited number of internodes on the 20 em stern above the medium where, on other genotypes, the new shoots usually develop after being pmned back.. 6.3.4 Inheritance of selected traits in val'. macrosperma x wild Australian hybrids The val'. macrosperma x Australian wild accession ACC 390 hybrid population was chosen for the inheritance studies, rather than the two other hybrid combinations of val'. macrosperma. X. African accessions, in part because ACC 390 was used in the hybrid populations with the Bali cultivates accessions. In addition, expression of many of the wild traits in ACC 390 was more extreme that in some of the other wild accessions, providing greater differentiation from the cultivated attributes exhibited by val'. macrosperma. This enhanced the ability to discriminate between phenotypes and made observation of segregation easier, as suggested by Mendel (1866).. 6.3.4.1 Weather conditions The seasonal profiles of mean weekly maximum and minimum temperatures during the plant growth period for this study are shown in Figure 6.3. The main group of plants, sown on September 17, 2008, had all produced their first flush of mature pods by December 13,2008 (13 weeks after sowing). The subset of additional BCP 1 plants, sown on October 25, 2008, did not mature their first flush of pods until January 11, 2009 (week 17). Thus the main population of plants grew during the period spring to early summer (weeks 1-13, Figure 6.3) while the smaller subset grew during late spring to midsummer (weeks 6-17, Figure 6.3). Weekly mean minimum temperatures during weeks 1-13 ranged 15.8 - 24.1°C with occasional daily minima as low as 12°C and as high as 26°C. Weekly mean maximum temperatures ranged 35.6 - 40.7°C, with occasional daily maxima as low as 34°C and as high as 44°C. During weeks 6-17, weekly mean minimum temperatures ranged 21.0 - 24.1°C with occasional daily minima as low as 16°C and. 109.
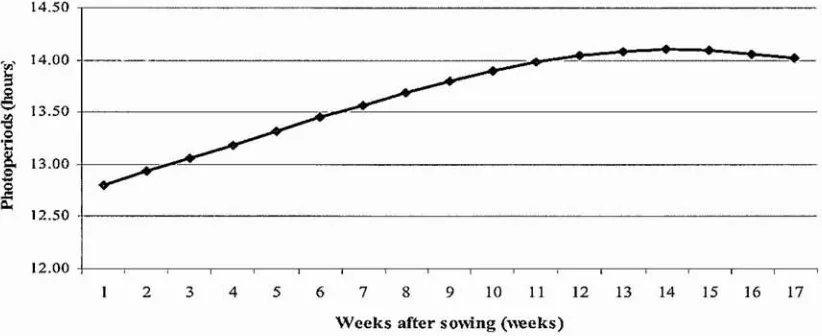
(32) as high as 26°C. Weekly mean maximum temperatures for weeks 6-17 ranged 36.7 - 40.7°e, with occasional daily maxima as low as 35°e and as high as Moe. 45.0 - , - - - - - - - - - - - - - - - - - - - - - - - - - - - - - - - - - 40.0 -;----------------~. i· · · · · · · ·. 35.0. E30'0~ ~. ... i. 25.0·. ~. 15.0. 5.0. ... ... .-.--*. '". '". *. •. '". .... ~...,~"'---::::::: .... ~::::---------------. 20.0. 10.0. .. -----------=~=_:_=~:::;;;Il~~;;;;;;;;;;~~;:;;:::;:::;;::::;;:-. I. l-------------------------I.. . . . Da~ly +J- - - - - - - - - - - - - - - - - - - - - - - - - 1. mini.ma. 1-. _Dally maxlma-. 0.0 2. 4. 3. 5. 6. 7. 8. 9. 10. II. 12. 13. 14. 15. 16. 17. Weeks after sO\ung. Figure 6.3 Weekly means for daily minimum and maximum temperatures during Experiment 4. The main popUlation was grown between week 1 and week 13. The additional population of BCP j was grown between week 6 and week 17.. Daily photoperiod increased from 12 h 48 min when the main group of plants was sown to 14 h 6 min at week 13 when these plants were harvested for biomass measurement (Figure 6.4). For the later sown subset, the daily photoperiod had already lengthened to 13 h 30 min when these plants were sown. These plants completed their last five weeks of growth when daily photoperiods were longest (> 14 h, Figure 6.4).. 14.50.----------------------------------. '",'. f. 14.00. ---------------------:--=_......,~~:!::==!::~~~~~.-. 5. ~. ~--. ... . - . = - - - - - - - - - - - - - - - - - - - -. 13.50 + - - - - - - - -. ~. '1:. ~ 13.00 +-~-------:~.-="-------------------------------. f. 12.50 · 1 - - - - - - - - - - - - - - - - - - - - - - - - - - - - - - - 12.00. +--,----------;----,-----,-----,-----.----,----,----,--------,------,------.------,----,-----.---,---~. 2. 3. 4. 5. 6. 7. 8. 9. 10. 11. 12. 13. 14. 15. ]6. 17. Weeks after sowing (weeks). Figure 6.4 Weekly means for daily photoperiod (including civil twilight) during Experiment 4. The main population was grown between week 1 and week 13. The additional population of BCP 1 was grown between week 6 and week 17.. 110.
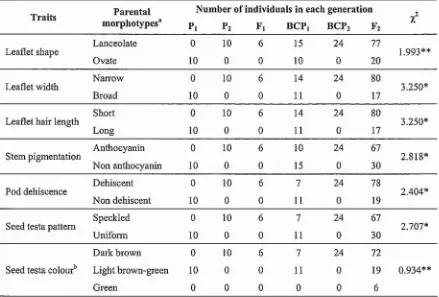
(33) In general, therefore, the later sown subset of BCP j plants experienced longer photoperiods and wanner conditions for most of their growth period than the early sown plants. Because of the large effects of photoperiod on phenology and other attributes of growth observed in the earlier studies, especially in Experiment 1, it was considered likely that there would be large environment (E) and genotype x environment (G x E) interaction effects on the expression of quantitative traits in the two groups of plants.. This concem was bome out by a comparison of the average time to flowering of the BCP 1 plants in the main population with that in the later sown subset. The earlier sown BCP t plants flowered an average 52 days after sowing (DAS), when daily photoperiod was 13 hours 36 minutes (week 7). The later sown plants flowered an average 57 DAS, when photoperiod was 14 h 6 min (week 14). Delays in flowering time when short day plants are exposed to longer photoperiods are a common OCCUlTence (Caber et al. 2001, Upadhyay et al. 1994). In tum, photoperiod-induced effects on phenology can have large effects on attributes of plant growth and seed yield (e.g. Lawn 1979b, Hadley et al. 1984).. Because of the risk of E and G x E effects on the expression of quantitative traits in the two groups of plants, the measurements of quantitative traits from the later sown subset of BCP t plants were excluded from the subsequent analyses of inheritance of these traits. The data for putative qualitative traits from both populations were used in the analyses of inheritance, on the basis that by their nature, environmental effects on expression of these traits are negligible.. 6.3.4.2 Qualitative traits. The standard Chi-square goodness of fit test was used to compare the segregation ratios that were observed in all the putative qualitative traits with the expected model ratios (Table 6.9). In the first instance, the simplest model of single gene control was tested for each trait. Where the apparent goodness of fit was not statistically significant (P < 0.05), more complex digenic models of control were evaluated. Coincidentally, most of the qualitative traits that were observed in this study were found to be controlled by single dominant genes (Table 6.10). The only trait where it was considered necessary to evaluate a more complex model was seed testa colour.. For both the leaflet shape and leaflet size traits, the segregation ratios were consistent with the hypothesis of single completely dominant gene control, with "l of 1.993 and 3.250, respectively (Tables 6.10). In tenns of leaflet shape, the wild type lanceolate shape was apparently dominant to the ovate shape of var. macrosperma, which is usually associated with domestication (Table. 111.
Figure


+7


Related documents
The adoption of sustainable innovations in the monopoly situation is of particular interest, as it correlates to the adoption of renewable distributed generation in the
Time-averaged velocity fields of stirred tank flow at high Reynolds numbers show Reynolds-independent behavior: average velocities and velocity fluctuation levels
Nuestra hipótesis supone que en la primera mitad del Holoceno las plantas y animales de lugares abiertos, que dominaron los paisajes de los periodos fríos del
the first value agrees with the widely used ratio of the total to selective extinction in filters B
In this project, we perform a genome-wide association study (GWAS) exploiting the concept of super variants in statistical genetics to identify potential risk loci con- tributing to
[r]
Considering the importance of study abroad programs for their po- tential contribution to broader internationalization efforts (American Council on Education, 2017) and the
To understand who is applying to the extramural LRP we used data from OAS to analyze the following parameters for new LRP applicants from FY2003 to FY2007: (i) total applications
