Audit Committees and Earnings Quality
Peter Baxter – University of the Sunshine Coast
Julie Cotter* – University of Southern Queensland
*Address for correspondence - School of Accounting, Economics and Finance, Faculty of Business, University of Southern Queensland, Toowoomba QLD 4350, AUSTRALIA
Abstract
This research investigates whether audit committees are associated with improved earnings quality for a sample of Australian listed companies prior to the introduction of mandatory audit committee requirements in 2003. Two measures of earnings quality are used based on models first developed by Jones (1991) and Dechow and Dichev (2002). Our results indicate that formation of an audit committee reduces intentional earnings management but not accrual estimation errors. We also find differences in the
associations between audit committee accounting expertise and the two earnings quality measures. Other audit committee characteristics examined are not significantly related to either earnings quality measure.
Keywords: Audit committees, Corporate governance, Earnings management, Earnings
quality
JEL Descriptors: G30, G38, M41
_____________
1. Introduction
The purpose of this paper is to investigate the association between audit committees and earnings quality in Australia. We examine two key aspects of this relation, audit committee formation and audit committee characteristics. We use measures of earnings quality based on models first developed by Jones (1991) and Dechow and Dichev (2002). Measures based on the Jones „earnings management‟ model are generally characterised as capturing managements‟ intent to manipulate earnings, while measures based on Dechow and Dichev‟s „accrual estimation error‟ model include accrual estimation errors arising from management lapses or environmental uncertainties.
Improved quality of financial reporting practices, and more specifically earnings, has been widely cited as one of the major benefits of companies establishing audit
committees (Blue Ribbon Committee, 1999; Australian Accounting Research Foundation (AARF) et al., 2001; Ramsay, 2001). However, the approach adopted by the Australian Stock Exchange (ASX)1 from the early 1990s to 2003 was one of disclosure only, requiring listed companies to provide statements about their main corporate governance practices, including whether they had an audit committee and if appropriate, why they did not comply with best practice guidelines. Audit committees only became mandatory in 2003 for those listed companies on the S & P All Ordinaries Index following the recommendations of the ASX Corporate Governance Council2 (ASX Corporate
1 Following the merger of the Australian Stock Exchange with the Sydney Future Exchange in 2006, the ASX became the Australian Securities Exchange.
Governance Council, 2003).3 Given the previous relative lack of audit committee
regulation in Australia as compared to the US and other overseas jurisdictions4, pre-2003 Australia represents a rich empirical setting for the analysis of the association between audit committees and earnings quality.
Davidson et al. (2005) and Koh et al. (2007) are the only known published studies to utilise this voluntary institutional setting to explore the relationship between audit committees and earnings quality. We extend their research in several ways. First, we capture earnings quality using measures of accrual estimation errors as well as abnormal accruals. The accrual estimation errors measure is a more comprehensive measure of earnings quality. We are not aware of any prior published research into the relationship between audit committees and earnings quality that uses measures based on Dechow and Dichev‟s (2002) accrual estimation errors model. A comparison of our results between these two earnings quality measures allows us to investigate the potential impact of audit committees on different aspects of earnings quality.5 Second, we examine whether earnings quality increases following the voluntary formation of an audit committee. While several studies including Davidson et al. (2005) have examined whether the existence of an audit committee is associated with earnings quality, tests of this
association do not differentiate between whether (a) the audit committee impacts earnings
3 In addition, entities in the top 300 of the Index are now required to comply with the ASX Corporate Governance Council‟s best practice recommendations relating to the composition, operation and responsibility of the audit committee (Australian Stock Exchange, 2006).
4 Audit committees have been mandatory on the major US stock exchanges since as early as 1978 (Vanasco, 1994). More recently, there has been an increasing trend around the world towards requiring listed companies to not only establish audit committees, but also to ensure that they meet pre-specified requirements including composition and reporting obligations. For example, in the US following
quality or (b) firms with high quality earnings are more likely to form an audit
committee. Overseas research (Wild, 1994; Jeon et al., 2004) has found mixed evidence about the impact of audit committee formation on earnings quality. Third, in addition to the audit committee characteristics examined by Davidson et al. (2005) and Koh et al. (2007), we investigate the impact of audit committee expertise on earnings quality. Recent unpublished work in the US by Dhaliwal et al. (2006) reports an association between audit committee accounting expertise and accruals quality. Finally, we use a more refined measure of audit committee independence than that used in prior Australian studies that investigate the association between audit committee characteristics and earnings quality (Davidson et al., 2005; Koh et al., 2007).
Our results suggest that earnings quality increases in the year following voluntary audit committee formation. However this is only the case when earnings quality is captured using measures based on Jones‟ (1991) earning management model rather than Dechow and Dichev‟s (2002) accrual estimation error model. This result appears to indicate that audit committees are effective in reducing intentional accrual manipulations, which are better captured by the Jones model. We also find differences in the
similar to those found by Davidson et al. (2005) with the exception of audit committee independence. Using our more refined measure of independence, we find that this audit committee characteristic does not impact earnings quality.
The remainder of this paper is organised as follows: Section 2 outlines the prior literature and hypotheses tested in this paper. Section 3 delineates our earnings quality measures, while Section 4 describes the empirical analysis. Section 5 concludes the paper.
2. Prior literature and hypotheses
2.1 Audit committee formation
Several prior studies provide empirical support for a cross-sectional association between audit committees and financial reporting quality (e.g., McMullen, 1996; Dechow
et al., 1996; Beasley et al., 2000). However, the research designs used in these prior studies are unable to establish whether the existence of an audit committee per se impacts earnings quality. For a more direct test of the impact of audit committees on earnings quality, it is necessary to consider changes in earnings quality subsequent to the formation of an audit committee.
We propose an association between the formation of an audit committee and an increase in earnings quality. Tests will allow a direct assessment of whether the voluntary formation of an audit committee is followed by an increase in earnings quality for our sample of Australian companies.
H1: The formation of an audit committee is associated with an increase in
earnings quality.
2.2 Audit committee characteristics
Independence
The independence of an audit committee is often considered an essential characteristic influencing the committee‟s effectiveness in overseeing the financial reporting process. It can be argued that independent directors are in the best position to serve as active overseers of the financial reporting process, thereby having a greater ability to withstand pressure from management to manipulate earnings (Klein, 2002).
Expertise
In addition to independence, the expertise of the audit committee is generally considered an important characteristic for its effective operation. It has been argued that effective oversight by an audit committee requires that its members possess sufficient expertise in accounting and auditing to independently assess the matters that are presented to them (Beasley and Salterio, 2001; Davidson et al., 2004; DeFond et al., 2005).
Several prior studies have found a significant association between the expertise of the audit committee and earnings quality (e.g., Xie et al., 2003; Bedard et al., 2004; Choi
et al., 2004; Dhaliwal et al., 2006). However, some inconsistencies exist between the results of these studies and others such as Van der Zahn and Tower (2004) who failed to find an association between the magnitude of earnings management and the audit committee's financial expertise amongst the independent directors.
Activity and size
The level of activity of an audit committee has been recommended as important to enhance its effectiveness in improving earnings quality. Menon and Williams (1994) suggest that the mere formation of an audit committee does not mean that the committee is actually relied on by the board of directors to enhance its monitoring ability. Choi et al.
Inconsistent results in the prior studies also exist for the association between audit committee activity and earnings management or earnings quality. While Xie et al. (2003), Van der Zahn and Tower (2004) and Vafeas (2005) find evidence of a significant
association between these variables, Choi et al. (2004), Bedard et al. (2004) and Davidson et al. (2005) find that audit committee activity is not significantly related to earnings management. Similar inconsistent results also exist in relation to the size of the audit committee. We use the following hypothesis:
H2: The independence, expertise, activity, and size of an audit committee are
positively associated with earnings quality.
3. Earnings quality measures
3.1 Earnings quality vs earnings management
This paper uses two measures of earnings quality. The first measure uses a modified version of the Jones (1991) model of discretionary accruals. This measure has been widely used in the literature to capture earnings management, which can be viewed as an inverse measure of earnings quality. Schipper (1989, p. 92) defines earnings management as "…a purposeful intervention in the external financial reporting process, with the intent of obtaining some private gain." Under this perspective, opportunistic earnings management negatively impacts on the quality of earnings, i.e., the greater the earnings management, the lower the earnings quality.6
Our second measure of earnings quality uses a modified version of the Dechow and Dichev (2002) accrual estimation errors model. This model is based on the argument that estimation errors in accruals and subsequent corrections of these errors decrease the
quality of accruals and earnings. However, unlike the Jones (1991) type models of discretionary accruals, no attempt is made to separate the intentional from the
unintentional accrual estimation errors (Dechow and Dichev, 2002). This is because both types of errors imply low quality earnings.
3.2 Measures of Earnings Quality
We capture earnings quality using absolute value measures from the two models described below. The sign of these measures is deemed not to be relevant since all
deviations from underlying earnings reduce earnings quality, regardless of their direction. They are inverse measures of earnings quality. We use cross-sectional rather than time-series specifications for each of our measures since we require measures of earnings quality for specific firm years. Information on the Global Industry Classification Standard (GICS) is used to form the industry matched samples required to calculate our earnings quality variables. To ensure sufficient degrees of freedom and enhance the validity of these measures, we limit our sample to companies in those industry groups that had 20 or more companies listed on the ASX. For companies in large industry groups, our industry matched samples comprise 30 companies.
Our first measure of earnings quality (EQJones) is based on the modified version of the Jones (1991) discretionary accruals model proposed by Dechow et al. (1995).7 We use cross-sectional samples of companies in the same industry groups as the sample companies. The absolute value of discretionary accruals is used as our first measure of earnings quality (EQJones).
It has been argued that there is the potential for discretionary accruals models to misclassify expected accruals as unexpected because of the incompleteness of the expected accruals model (Bernard and Skinner, 1996; Larcker and Richardson, 2004). Guay et al. (1996) suggests that their evidence was consistent with the models estimating discretionary accruals with considerable imprecision and/or misspecification. Hansen (1999) concludes that studies relying entirely on the validity of discretionary accruals models were likely to under- or overstate proposed earnings management behaviour. Dechow et al. (1995) demonstrates that discretionary accruals models typically generated tests of low power for earnings management of economically plausible magnitudes.
In an attempt to overcome criticisms of the modified Jones model, we use an additional proxy for earnings quality. Our second measure of earnings quality (EQDD) uses the cross-sectional version of the Dechow and Dichev (2002) accrual estimation error model employed by Francis et al. (2005).8 McNichols (2002) provides a critique of the Dechow and Dichev (DD) model9. Following McNichols‟ (2002) critique and
associated recommendations for improvement, Francis et al.(2005) add two variables from the Jones (1991) model, i.e., the change in current sales and the level of property plant and equipment.
We calculate EQDD by estimating the modified following regression for each sample company relative to its industry group of companies for each of the years of interest. All variables in equation (4) are divided by average total assets:
WCt= b0 + b1CFOt-1 + b2CFOt + b3CFOt+1 +b4Salest + b5PPEt +t (4)
8
Where:
WCt = Working capital in year t i.e. Accounts receivable + Inventory -
Accounts payable - Taxes payable + Other assets (net); CFOt-1 = Cash flows from operations in year t – 1;
CFOt = Cash flows from operations in year t;
CFOt+1 = Cash flows from operations year in year t + 1;
Salest = Sales in year t less sales in year t – 1;
PPEt = Gross property, plant and equipment in year t
This measure of earnings quality captures the extent to which accruals map into cash flow realisations in past, present and future cash flows. Francis et al. (2005) use the standard deviation of the residuals from this model as a measure of earnings quality. However, we are not able to use the standard deviation of the residuals from our cross-sectional industry model since this would provide a measure of earnings quality across all companies in the industry group rather than just the company of interest. Following Srinidhi and Gul (2007) who also need to capture this measure on a firm-year basis, we use the absolute value of the residual as our measure of earnings quality. The higher the absolute residual for each sample company, the lower is the quality of earnings.
4. Empirical analysis
4.1 Data and sample
increase in earnings quality, these variables are estimated for the years before and after audit committee formation. That is, we use industry matched samples to estimate our earnings quality measures for both the pre and post formation years. In addition, they are re-estimated for each of our sample firms in 2001, since this is the year used to test the associations between earnings quality and audit committee independence, expertise, activity, and size proposed in hypothesis 2.10
Data required for these audit committee variables is hand collected from the 2001 annual reports. Audit committee independence and expertise for each director is assessed from disclosures about directors‟ backgrounds, qualifications and experience. The definition of director independence as specified by the ASX Corporate Governance Council (2003) was used11. Accounting and legal expertise are defined in terms of professional qualifications.
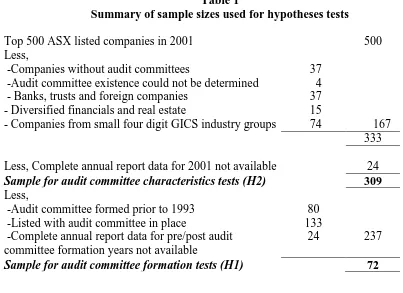
[Insert table 1 here]
The sample is drawn from the top 500 Australian companies listed on the Australian Stock Exchange (ASX) with financial years ending during 2001. Sample selection procedures and final sample sizes for hypotheses tests are shown in Table 1. We exclude companies without an audit committee (37) and those companies for which it could not be determined whether an audit committee existed (4). Banks, trusts and
foreign companies (37) are also excluded since financial reporting requirements for these companies differ from those of other companies listed on the ASX. Companies in the
10 This year is selected as the base year to avoid any effects of companies anticipating the new ASX listing rule requiring audit committees to be formed by all companies in the S&P All Ordinaries Index. This new rule came into effect from 1 January 2003.
Diversified Financials and Real Estate industry groups (15) are excluded because they do not typically generate any sales revenue, which is needed to calculate our earnings quality variables. As we require sufficiently large numbers of companies to form the industry matched samples needed to calculate our measures of earning quality, we delete 74 companies from several small GICS industry groups12. Finally, we delete 24 companies where complete annual report data for 2001 is not available. This leaves a final sample size of 309 companies for tests of the association between audit committee characteristics and earnings quality (H2). Table 2 Panel A shows the industry breakdown of our sample.
[Insert table 2 here]
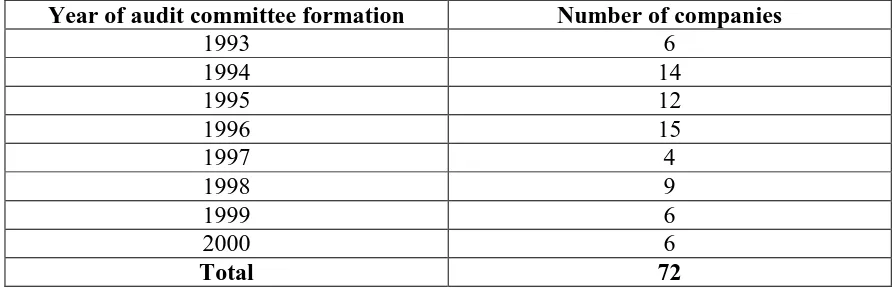
Further deletions from our sample are needed for tests of the association between the formation of an audit committee and earnings quality (H1). In particular, we exclude companies for which we are unable to reliably determine the audit committee formation year from annual reports. These comprise companies whose audit committees were formed prior to 1993 requirements to disclose audit committees in annual reports (80), those that listed on the ASX with an audit committee already in place (133), and those for which pre/post formation year annual report data is not available (24). This left a sample of 72 companies for tests of hypothesis one. Panel B of Table 2 shows the number of companies forming their audit committee by year. The higher numbers of formations during the 1994 to 1996 period suggest that the 1993 introduction of disclosure requirements provided an impetus for some companies to form an audit committee.
4.2 Audit committee formation and earnings quality
To determine the effect of audit committee formation on earnings quality, we compare our earnings quality measures between the years before and after each company‟s audit committee was formed. Panel A of Table 3 shows the results of
matched-pairs t-tests for significant differences for these accruals measures pre and post audit committee formation.13 For the accruals levels variables derived from the modified Jones (1991) model, the mean for EQJones(post) (0.1370) is significantly less than the mean for EQJones(pre) (0.2033). This result suggests that earnings quality calculated based on the Jones (1991) model is significantly higher in the year after formation of the audit committees compared to the year before audit committee formation. These results support our first hypothesis that the formation of an audit committee is associated with an increase in earnings quality.
[Insert table 3 here]
However, the results for the measure of earnings quality based on the Dechow and Dichev (2002) model do not show a significant difference between the years before and after audit committee formation. Correlation coefficients between EQJones and EQDD are not significant (see Table 5), indicating that these two measures capture quite different aspects of earnings quality. It is possible that the observed change in EQJones between the pre and post formation years is due to factors other than the formation of the audit committee, such as changes in the board and auditor. To control for the impact of
13
these potentially correlated omitted variables on the relationship between earnings quality and audit committee formation, the following pooled regression is estimated:
EQ= a+ b0FORMATION + b1 ROA + b2 BDIND + b3BDACCEX + b4BDLEGEX
+ b 5BDCMEET + b6BDSIZE + b7AUDITOR + (5)
FORMATION is a dummy variable that equals zero in the pre formation year and one in the post formation year. Each of our control variables is measured in both the pre and post formation years. Return on assets (ROA) is included to control for potential changes in firm performance. It is possible that the observed increase in earnings quality could be associated with a change in firm performance. Prior research has shown that the measurement of discretionary accruals can be problematic for firms with extreme
financial performance (Dechow et al., 1995; Kothari et al., 2005). It is also possible that changes to the board of directors or company auditor occurring at the same time that the audit committees were formed could be associated with the increase in earnings quality. Hence, we include controls for board independence (BDIND), size (BDSIZE), accounting expertise (BDACCEX), legal expertise (BDLEGEX), meetings per year (BDMEET), and auditor quality (AUDITOR) for both the pre and post audit committee formation years.
higher earnings quality. ROA and BDMEET are also significantly negatively associated with EQJones. None of these variables are significantly correlated with EQDD.14
Our EQJones results support those of Wild (1994) who finds a significant increase in the market reaction to earnings reports released after the formation of the audit
committee. However they are inconsistent with the results of Jeon et al. (2004) who find no significant decrease in earnings management for Korean firms after they established audit committees. A potential reason for the inconsistency between our results and those of Jeon et al. is the different legal environments between Korea and Australia. Their sample included a majority that were required by Korean government law to establish an audit committee. The period of study for our paper was prior to the mandatory
requirement for audit committee formation by large Australian listed companies, which came into effect on 1 January 2003. Companies that form audit committees voluntarily, not because of a government requirement, are likely to be more effective at constraining earnings management and therefore improving earnings quality. This is because they have other incentives to ensure their audit committees operate effectively, which also drive the decision to voluntarily form an audit committee.
4.3 Audit committee characteristics and earnings quality
Table 4 provides the descriptive statistics for the variables used in the tests of association between audit committee characteristics and earnings quality (H2) as well as several control variables relevant to this association. The mean and median values for EQJones are similar to those reported by Davidson et al. (2005) for their absolute
discretionary accruals measure that is based on the same cross-sectional modified Jones model that we use. We exclude several outliers for EQJones and EQDD from our primary analysis and also report results of sensitivity analysis using logged transformations of our earnings quality measures.
Overall, the descriptive statistics indicate that there is considerable variation in the audit committee variables for the sample companies. The mean proportion of independent directors on the audit committee is 0.53. Prior US studies such as Yang and Krishnan (2005) provide evidence that audit committees in the United States have much higher proportions of independent directors, which reflects the greater degree of audit committee regulation. Our measures of ACMEET and ACSIZE are slightly higher than those
reported by Davidson et al. (2005). This is most likely due to the larger average size of the firms in our sample and the exclusion of firms without an audit committee from our sample. Descriptive statistics for full board level variables that correspond to our audit committee variables are also shown in Table 4. Davidson et al. (2005) and Koh et al.
(2007) found board independence to impact earnings quality. It is likely that some of the other board level variables are also associated with earnings quality. The remaining variables in Table 4 are controls for auditor quality, leverage, firm size, losses and operating cycle.
[Insert table 4 here]
skewed and we therefore take a log transformation of this variable (LNTA). LOSS equals 1 if income for the year is less than zero, 0 otherwise. 108 of the sample firms report a loss in 2001. Length of operating cycle is measured as 360/(sales/average account receivables). Operating cycles for our sample firms range between 0 and 1050 days, with a mean of 65.68 days. This variable is highly positively skewed and we therefore use a log transformation for our hypotheses tests (LNOPCYCLE). We do not include controls for volatility of operating cash flows or sales since we are unable to obtain a sufficient time-series of data to calculate these measures for the majority of our sample firms.
Table 5 shows Pearson and Spearman correlation coefficients between the earnings quality, audit committee, full board and control variables. For EQJones,
Pearson correlations show significant positive relationships with LOSS and LNOC, while Spearman correlations show significant relationships with ACACCEX (+), BDIND (-), BDACCEX (+), BDSIZE (-) and LOSS (+). The Spearman correlations between EQJones and both ACACCEX and BDACCEX are positive rather than negative as expected. This result appears to suggest that accounting expertise could be related to an increase rather than a decrease in earnings management. When we use a log
transformation of EQJones, Pearson correlations with ACACCEX, BDACCEX, LOSS and LNOC are all positive and significant, while BDSIZE is significantly negatively associated with EQJones. Overall, these results do not support the relations between EQJones and the audit committee characteristics predicted in H2.
When we consider EQDD, Pearson correlations show significant negative relationships between this measure of earnings quality and ACACCEX, ACSIZE, BDSIZE, LNTA, and a significant positive relation with LOSS. Spearman correlations support these results and also show a significant positive relation between EQDD and LNOC. When we use a log transformation of EQDD, the same variables remain
significant. These results indicate initial support for the predicted H2 relations between earnings quality and audit committee size and accounting expertise.
Not surprisingly, most of our audit committee and full board level variables are very highly correlated; with the correlation coefficients for the independence and expertise measures ranging between 0.69 and 0.78. Further, audit committee size is significantly positively correlated with full board size and firm size. Interestingly, the two measures of audit committee expertise (ACACCEX and ACLEGEX) are
significantly negatively correlated with each other. This suggests that the two forms of expertise are substitutes for each other.
We use the following regression model to test our second hypothesis that earnings quality is positively associated with audit committee independence, expertise, activity and size. EQ denotes the two earnings quality measures described above (EQJones and EQDD). This model is estimated on our sample of listed Australian companies in 2001:
EQ= a + b1 ACIND + b2ACACCEX + b3ACLEGEX + b4ACMEET + b5ACSIZE + b6 AUDITOR+ b7 LNTA+ b8LEV + b9 LOSS+ b10LNOC+
(6)
data about industry membership for all of our sample firms, while we were only able to obtain operating cycle data for 284 of our sample firms. We rerun this model controlling for full board independence, expertise, activity and size. Several of these variables are significantly positively correlated with their corresponding audit committee measures and that is why we exclude them from equation 6. However, some of these board variables are significantly associated with our EQ measures and we therefore attempt to control for their impact by including them in a sensitivity test of this model.
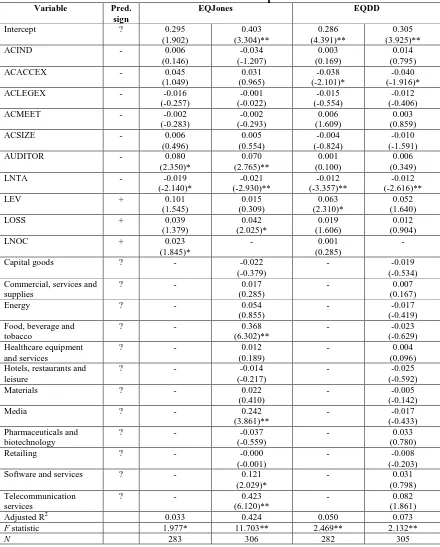
Table 6 shows the results from OLS regressions of equation 6. None of our audit committee variables are significantly associated with EQJones. Similarly, Davidson et al. (2005) report insignificant coefficients for ACMEET and ACSIZE, and mixed results for ACIND depending on how it is measured.15 Our results indicate that EQDD is
significantly negatively correlated with ACACCEX indicating that this measure of earnings quality is higher when there are a greater proportion of audit committee
members with accounting expertise. This result is consistent with Dhaliwal et al. (2006) who find a significant positive relation between accounting expertise and accruals quality. Our other audit committee variables are not significantly related to EQDD.16
[Insert table 6 here]
When logged transformations of our EQ variables are used, EQDD remains significantly negatively associated with ACACCEX, while EQJones is significantly
15 These authors proxy audit committee independence using a dichotomous non-executive director measure and find mixed results depending on whether they code this variable with a value of one if the audit committee is comprised entirely of non-executive directors or a majority. In sensitivity tests, their
significant results for this variable become insignificant when they remove non-executive directors that had related party transactions.
16
positively associated with this variable. When we add the full board variables to our models, the relationship between EQDD and ACACCEX becomes insignificant and the remainder of our results are qualitatively the same. Given the high correlation between our board and audit committee accounting expertise variables (r = 0.77), it is difficult to reliably interpret this result. We therefore rerun our EQDD models with BDACCEX instead of ACACCEX and find that BDACCEX is not significantly related to EQDD. This result suggests that it is accounting expertise at the audit committee level rather than the full board level that positively impacts earnings quality.
The results for control variables shown in table 6 indicate significant associations between EQDD and LNTA, and between EQJones and LNTA and AUDITOR, as well as some mixed results for LEV, LOSS and LNOC. The significant positive relations that we observe between EQJones and ACACCEX and AUDITOR are contrary to expectations. Several of the industry dummy variables are significant for EQJones, which captures variation in the exercise of discretionary accruals across industries.
Overall, H2 is generally not supported, with the exception of audit committee accounting expertise when the EQDD measure of earnings quality is considered. The weight of evidence suggests that the higher the proportion of accounting expertise a company has on its audit committee, the lower its accrual estimation errors.
5. Conclusions
increase in earnings quality (H1); and the independence, expertise, activity, and size of an audit committee are positively associated with earnings quality (H2). Overall, the results provide support for H1, but not H2.
Several conclusions can be drawn from our results. First, we find that a
discretionary accruals measure based on the Jones (1991) earnings management model, decreases significantly in the year following audit committee formation. Since measures based on this model are generally characterised as capturing managements‟ intent to manipulate earnings, our results imply that the establishment of an audit committee is an effective way to reduce earnings management, and hence improve the quality of earnings. When we capture accrual estimation errors using measures based on Dechow and
Dichev‟s (2002) model, we do not find an increase in earnings quality following audit committee formation. This disparity in results between the two types of earnings quality measures highlights the potential impact of audit committees. While improved quality of financial reporting practices has been widely cited as a major benefit of audit committees, this result appears to indicate that this improvement most likely occurs through a
reduction in earnings manipulations rather than lower accrual estimation errors deriving from management lapses or environmental uncertainties. A caveat on these results is the relatively small sample size available for tests of H1.
audit committees. Future research that explores this result further may be able to shed some light on this unexpected finding.A potential limitation of our research relates to the endogeneity of audit committees. The characteristics of audit committees are not
necessarily independent of earnings quality. Companies with higher quality earnings may be more likely to choose audit committee characteristics that signal the strength of their financial reporting system (Engel, 2005).
Overall, our results highlight the multifaceted nature of earnings quality and the potential for audit committees to impact it. As we have found, different measures of earnings quality can lead to different results and inferences. Each of the available models of earnings quality has its own particular limitations and these should be considered when interpreting our results. Additional research that separates out the intentional and
References
Australian Accounting Research Foundation, Institute of Internal Auditors Australia and Australian Institute of Company Directors, 2001, Best Practice Guide: Audit
Committees.
ASX Corporate Governance Council, 2003, Principles of Good Corporate Governance
and Best Practice Recommendations.
Australian Stock Exchange, 2006, ASX listing rules (Retrieved 4 August 2006 from
http://www.asx.com.au/supervision/rules_guidance/listing _rules1.htm). Beasley, M., J. Carcello, D. Hermanson and P. Lapides, 2000, Fraudulent financial
reporting: consideration of industry traits and corporate governance mechanisms,
Accounting Horizons 14, 441-454.
Beasley, M. and S. Salterio, 2001, The relationship between board characteristics and voluntary improvements in audit committee composition and experience,
Contemporary Accounting Research 18, 529-570.
Bedard, J., S. Chtourou and L. Courteau, 2004, The effect of audit committee expertise, independence and activity on aggressive earnings management, Auditing: A Journal of Practice and Theory 23, 13-35.
Bernard, V. and D. Skinner, 1996, What motivates managers‟ choice of discretionary accruals?, Journal of Accounting and Economics 22, 313-325.
Blue Ribbon Committee, 1999, Report and recommendations of the Blue Ribbon Committee on Improving the Effectiveness of Corporate Audit Committees, The Business Lawyer 54, 1067-1095.
Choi, J., K. Jeon and J. Park, 2004, The role of audit committees in decreasing earnings management: Korean evidence, International Journal of Accounting, Auditing and Performance Evaluation 1, 37-60.
Davidson, R., J. Goodwin-Stewart and P. Kent, 2005, Internal governance structures and earnings management, Accounting and Finance 45, 241-268.
Davidson, W., B. Xie and W. Xu, 2004, Market reaction to voluntary announcements of audit committee appointments: the effect of financial expertise, Journal of Accounting and Public Policy 23, 279-293.
Dechow, P. and I. Dichev, 2002, The quality of accruals and earnings: the role of accrual estimation errors, The Accounting Review 77, 35-59.
Dechow, P., R. Sloan and A. Sweeney, 1995, Detecting earnings management, The Accounting Review 70, 193-225.
Dechow, P., R. Sloan and A. Sweeney, 1996, Causes and consequences of earnings manipulations: an analysis of firms subject to enforcement actions by the SEC,
Contemporary Accounting Research 13, 1-36.
DeFond, M., R. Hann and X. Xu, 2005, Does the market value financial expertise on audit committees of boards of directors?, Journal of Accounting Research 53, 153-193.
Dhaliwal, D., V. Naiker and F. Navissi, 2006, Audit committee financial expertise, corporate governance and accruals quality: an empirical analysis, Working paper (University of Arizona, University of Auckland and Monash University).
Francis, J., R. LaFond, P. Olsson and K. Schipper, 2005, The market pricing of accruals quality, Journal of Accounting and Economics 39, 295-337.
Guay, W., S. Kothari and R. Watts, 1996, A market-based evaluation of discretionary accrual models, Journal of Accounting Research 34, 83-105.
Hansen, G., 1999, Bias and measurement error in discretionary accrual models, Working paper (Penn State University).
Healy, P. and J. Wahlen, 1999, A review of earnings management literature and its implications for standard setting, Accounting Horizons 13, 365-383.
Jeon, K., J. Choi and J. Park, 2004, The relationship between new audit committee establishment and earnings management, Korean Accounting Review 29, 143-178. Jones, J., 1991, Earnings management during import relief investigations, Journal of
Accounting Research 29, 193-228.
Kalbers, L. and T. Fogarty, 1998, Organisational and economic explanations for audit committee oversight, Journal of Managerial Issues 10, 129-150.
Kent, P., J. Routledge and J. Stewart, 2008, Innate and discretionary accrual quality and corporate governance, Paper presented at the AFAANZ Annual Conference, Sydney. Klein, A., 2002, Audit committee, board of director characteristics and earnings
management, Journal of Accounting and Economics 33, 129-150.
Klein, A., 2003, Likely effects of stock exchange governance proposals and Sarbanes-Oxley on corporate boards and financial reporting, Accounting Horizons 17, 343-355. Koh, P., S. Laplante and Y. Tong, 2007, Accountability and value enhancement roles of
corporate governance, Accounting and Finance 47, 305-333.
Kothari, S., A. Leone and C. Wasley, 2005, Performance matched discretionary accrual measures, Journal of Accounting and Economics 39, 163-197.
Larcker, D. and S. Richardson, 2004, Fees paid to audit firms, accrual choices and corporate governance, Journal of Accounting Research 42, 625-658.
McMullen, D., 1996, Audit committee performance: an investigation of the consequences associated with audit committees, Auditing: A Journal of Practice and Theory 15, 87-103.
McNichols, M., 2002, Discussion of „The quality of accruals and earnings: the role of accrual estimation errors‟, The Accounting Review 77, 61-69.
Menon, K. and D. Williams, 1994, The use of audit committee for monitoring, Journal of Accounting and Public Policy 13, 121-139.
Rahman, R. and F. Ali, 2006, Board, audit committee, culture and earnings management: Malaysian evidence, Managerial Auditing Journal 21, 783-804.
Ramsay, I., 2001, Independence of Australian Company Auditors: Review of Current
Australian Requirements and Proposals for Reform (Commonwealth of Australia,
Canberra, ACT).
Schipper, K., 1989, Commentary on earnings management, Accounting Horizons 36, 91-102.
SIRCA Ltd, 2004, Aspect financial database (Retrieved 4 August 2006 from
http://www.sirca.org.au/uni/services/Data/accounting/aspect_financial.html)
Srinidhi, B. and F. Gul, 2007, The differential effects of auditors' non-audit and audit fees on accrual quality, Contemporary Accounting Research 24, 595-629.
Vafeas, N., 2005, Audit committees, boards and the quality of reported earnings,
Contemporary Accounting Research 22, 1093-1122.
Van der Zahn, M. and G. Tower, 2004, Audit committee features and earnings management: further evidence from Singapore, International Journal of Business Governance and Ethics 1, 233-257.
Vanasco, R., 1994, The audit committee: an international perspective, Managerial Auditing Journal, 9, 18-42.
Vicknair, D., K. Hickman and K. Carnes, 1993, A note on audit committee independence: evidence from the NYSE on „grey‟ area directors, Accounting Horizons 7, 53-57. Wild, J., 1994, The audit committee and earnings quality, Journal of Accounting,
Auditing and Finance 22, 247-276.
Xie, B., W. Davidson and P. DaDalt, 2003, Earnings management and corporate
governance: the role of the board and audit committee, Journal of Corporate Finance
9, 295-316.
Yang, J. and J. Krishnan, 2005, Audit committees and quarterly earnings management,
Table 1
Summary of sample sizes used for hypotheses tests
Top 500 ASX listed companies in 2001 500
Less,
-Companies without audit committees 37
-Audit committee existence could not be determined 4 - Banks, trusts and foreign companies 37 - Diversified financials and real estate 15
- Companies from small four digit GICS industry groups 74 167 333 Less, Complete annual report data for 2001 not available 24
Sample for audit committee characteristics tests (H2) 309
Less,
-Audit committee formed prior to 1993 -Listed with audit committee in place
-Complete annual report data for pre/post audit committee formation years not available
80 133
24
237
Table 2
Panel A: Sample of 309 companies used for audit committee characteristics tests by industry group
Industry group Number Percentage
Capital goods 33 10.7
Commercial services and supplies 21 6.8
Energy 20 6.5
Food, beverage and tobacco 29 9.4
Healthcare equipment and services 18 5.8
Hotels, restaurants and leisure 14 4.5
Materials 71 23.0
Media 20 6.5
Pharmaceuticals and biotechnology 16 5.2
Retailing 21 6.8
Software and services 25 8.1
Technology hardware and equipment 10 3.2
Telecommunication services 11 3.5
Total 309 100
Panel B: Number of audit committees formed each year by 72 ASX listed companies that formed their audit committees following the 1993 requirements for audit
committee disclosures.
Year of audit committee formation Number of companies
1993 6
1994 14
1995 12
1996 15
1997 4
1998 9
1999 6
2000 6
Table 3
Comparisons of earnings quality for the years pre and post audit committee formation for 72 ASX listed companies
Panel A: Matched-pairs t-tests
Variable N Min. Max. Median Mean Std. Dev.
t
EQJones(pre) 69 0.01 0.83 0.1209 0.2033 0.2046 3.058** EQJones(post) 69 0.00 0.83 0.0923 0.1370 0.1444
EQDD(pre) 71 0.00 0.50 0.0561 0.0906 0.1047 -0.300 EQDD(post) 71 0.00 0.72 0.0580 0.0961 0.1199
Panel B: Pooled regression results
Variable Pred. sign EQJones EQDD
Intercept 0.284
(4.187)**
0.098 (2.220)*
FORMATION - -0.066
(-2.254)*
0.007 (0.350)
ROA - -0.160
(-2.512)**
-0.047 (-1.121)
BDIND - 0.080
(1.276)
0.047 (1.123)
BDACCEX - -0.002
(-0.018)
0.025 (0.421)
BDLEGEX - 0.103
(0.986)
0.060 (0.881)
BDMEET - -0.006
(-2.230)*
-0.003 (-1.494)
BDSIZE - -0.003
(-0.390)
-0.002 (-0.358)
AUDITOR - -0.052
(-1.647)
0.007 (0.363)
Adjusted R2 0.098 -0.006
F statistic 2.867** 0.901
N 138 142
* significant at the 0.05 level, ** significant at the 0.01 level (p-values are one-tailed)
EQJones = Cross sectional earnings quality proxy from modified Jones (1991) model (i.e., absolute value of abnormal accruals)
EQDD = Cross sectional earnings quality proxy from Dechow and Dichev (2002) adjusted for Jones (1991) model variables (i.e., absolute value of regression residuals)
FORMATION: 1 = year after audit committee formation; 0 = year before audit committee formation ROA = Return on assets calculated as operating profit after tax scaled by average total assets BDIND = Proportion of independent directors on the board
BDSIZE = Number of board members
BDACCEX = Proportion of directors on the board with accounting qualifications BDLEGEX = Proportion of directors on the board with legal qualifications BDMEET = Number of board meetings per annum
Table 4
Descriptive statistics for 309 Australian listed companies in 2001
Panel A Continuous variables
Variable Minimum Maximum Median Mean Std Dev Skewness
EQJones 0.00 2.66 0.09 0.18 0.25 4.32
EQDD 0.00 1.29 0.05 0.10 0.15 4.83
ACIND 0.00 1.00 0.50 0.53 0.34 -0.12
ACACCEX 0.00 1.00 0.33 0.31 0.30 0.74
ACLEGEX 0.00 1.00 0.00 0.13 0.20 1.49
ACMEET 0.00 13.00 3.00 3.06 1.60 1.74
ACSIZE 2.00 7.00 3.00 3.18 1.00 1.16
BDIND 0.00 1.00 0.40 0.42 0.25 0.04
BDACCEX 0.00 0.80 0.20 0.22 0.18 0.65
BDLEGEX 0.00 0.50 0.09 0.11 0.12 0.99
BDMEET 3.00 33.00 11.00 11.34 4.28 0.88
BDSIZE 3.00 17.00 6.00 6.33 2.23 1.55
TA ($M) 3.94 84,961.00 138.28 1,276.30 6,020.56 10.60
LNTA 15.19 25.17 18.74 19.01 1.77 0.55
LEV 0.00 2.52 0.47 0.46 0.26 2.34
OPCYCLE 1.00 1050.00 48.00 65.68 96.94 6.32
LNOC 0.00 6.96 3.87 3.72 1.02 -0.95
Panel B Dichotomous variables
Variable Frequency of 1s Frequency of 0s
AUDITOR 247 (79.9%) 62 (20.1%)
LOSS 108 (34.9%) 201 (65.1%)
EQJones = Cross sectional earnings quality proxy from modified Jones (1991) model (i.e., absolute value of abnormal accruals)
EQDD = Cross sectional earnings quality proxy from Dechow and Dichev (2002) model adjusted for Jones (1991) model variables (i.e., absolute value of regression residuals)
ACIND = Proportion of independent directors on audit committee
ACACCEX = Proportion of directors on audit committee with accounting qualifications ACLEGEX = Proportion of directors on audit committee with legal qualifications ACMEET = Number of audit committee meetings for the year
ACSIZE = Number of audit committee members
BDIND = Proportion of independent directors on the board
BDACCEX = Proportion of directors on the board with accounting qualifications BDLEGEX = Proportion of directors on the board with legal qualifications BDMEET = Number of board meetings for the year
BDSIZE = Number of board members TA = Total assets
LNTA = Natural log of total assets
LEV = Total liabilities divided by total assets
OPCYCLE = Operating cycle measured as 360/(sales/average account receivables)
LNOC = Natural log of operating cycle, measured as 360/(sales/average account receivables) AUDITOR: 1 = Big 5 or 6 auditor; 0 = Non-big 5 or 6 auditor
Table 5
Pearson and Spearman Correlations for 309 Australian listed companies in 2001 (Pearson correlations are above diagonal; p values are shown in parenthesis)
EQJones EQDD ACInd ACAccEx ACLegEx ACMeet ACSize BDInd BDAccEx BDLegEx BDMeet BDSize LNTA Lev Auditor Loss LNOC
EQJones - 0.01 (0.818) -0.05 (0.370) 0.06 (0.319) -0.05 (0.343) -0.07 (0.195) -0.01 (0.226) -0.08 (0.148) 0.09 (0.119) -0.05 (0.369) 0.04 (0.537) -0.10 (0.079) -0.09 (0.114) 0.06 (0.286) 0.10 (0.071) 0.11* (0.047) 0.13* (0.035) EQDD 0.07
(0.127)
- 0.03 (0.560) -0.14* (0.015) -0.04 (0.468) -0.03 (0.567) -0.11* (0.048) 0.05 (0.347) -0.11 (0.053) 0.00 (0.998) 0.01 (0.802) -0.15** (0.008) -0.24** (0.000) -0.03 (0.632) -0.05 (0.394) 0.17** (0.003) 0.04 (0.522) ACInd -0.07
(0.252)
-0.02 (0.772)
- -0.10 (0.09) -0.07 (0.235) 0.19** (0.001) 0.03 (0.668) 0.77** (0.000) -0.14* (0.018) -0.18** (0.002) 0.07 (0.252) 0.16** (0.006) 0.18** (0.002) -0.01 (0.899) 0.12* (0.039) -0.09 (0.108) -0.05 (0.423) ACAccEx 0.13*
(0.025)
-0.12* (0.043)
-0.13* (0.018)
- -0.20** (0.000) -0.03 (0.554) -0.10 (0.082) -0.12* (0.042) 0.77** (0.000) -0.13* (0.024) 0.05 (0.356) -0.03 (0.619) -0.00 (0.983) 0.08 (0.175) -0.12* (0.029) -0.02 (0.782) -0.06 (0.290) ACLegEx 0.01
(0.858) 0.01 (0.943) -0.07 (0.213) -0.18** (0.002)
- 0.04 (0.534) -0.05 (0.391) -0.12* (0.040) -0.17** (0.003) -0.69** (0.000) -0.05 (0.396) 0.10 (0.075) 0.16** (0.004) -0.02 (0.788) 0.04 (0.499) -0.01 (0.867) 0.05 (0.414) ACMeet -0.07
(0.242) -0.04 (0.503) 0.20** (0.000) -0.01 (0.824) 0.09 (0.117)
- 0.21** (0.000) -0.04 (0.540) -0.04 (0.540) 0.04 (0.477) 0.15** (0.008) 0.34** (0.000) 0.39** (0.000) 0.10 (0.083) 0.15** (0.009) -0.20** (0.001) -0.04 (0.284) ACSize -0.08
(0.170) -0.12* (0.043) 0.03 (0.547) -0.07 (0.250) 0.04 (0.484) 0.16** (0.004)
- 0.03 (0.633) 0.03 (0.633) -0.06 (0.294) 0.09 (0.110) 0.33** (0.000) 0.23** (0.000) 0.12* (0.042) 0.06 (0.315) -0.13* (0.028) 0.11 (0.059) BDInd -0.11*
(0.045) -0.02 (0.690) 0.77** (0.000) -0.14* (0.018) -0.10 (0.074) 0.22** (0.000) 0.12* (0.035)
- -0.16** (0.005) -0.15** (0.009) 0.07 (0.223) 0.18** (0.002) 0.26** (0.000) 0.01 (0.928) 0.18** (0.001) -0.10 (0.096) -0.01 (0.888) BDAccEx 0.13*
(0.021) -0.04 (0.498) -0.16** (0.006) 0.78** (0.000) -0.13 (0.020) -0.01 (0.900) 0.07 (0.258) -0.16** (0.006)
- -0.15** (0.008) -0.12* (0.043) -0.12* (0.043) -0.04 (0.519) 0.06 (0.323) -0.14* (0.015) 0.02 (0.775) -0.07 (0.262) BDLegEx 0.02
(0.724) -0.00 (0.974) -0.16** (0.005) -0.12* (0.035) 0.70** (0.000) 0.09 (0.115) -0.01 (0.860) -0.13* (0.027) -0.11* (0.045)
- -0.01 (0.883) -0.01 (0.883) 0.09 (0.106) 0.09 (0.132) -0.02 (0.676) 0.04 (0.528) 0.05 (0.428) BDMeet 0.01
(0.905) -0.01 (0.917) 0.10 (0.074) 0.07 (0.252) -0.03 (0.617) 0.22** (0.000) 0.13* (0.018) 0.11 (0.063) 0.11 (0.051) -0.05 (0.405)
- 0.01 (0.899) 0.09 (0.132) 0.11* (0.046) -0.01 (0.819) 0.04 (0.535) -0.01 (0.824) BDSize -0.13*
(0.027) -0.19** (0.001) 0.15** (0.009) -0.01 (0.861) 0.14* (0.012) 0.28** (0.000) 0.36** (0.000) 0.17** (0.002) -0.09 (0.134) 0.05 (0.364) 0.03 (0.565)
- 0.26** (0.000) 0.12* (0.030) 0.21** (0.000) -0.17** (0.003) 0.04 (0.284) LNTA -0.09
(0.114) -0.21** (0.000) 0.16** (0.005) 0.01 (0.852) 0.18** (0.002) 0.43** (0.000) 0.25** (0.000) 0.25** (0.000) -0.00 (0.953) 0.12* (0.031) 0.12* (0.032) 0.52** (0.000)
- .40** (0.000) 0.34** (0.000) -0.32** (0.000) -0.04 (0.480) Lev 0.03
(0.567) -0.00 (0.972) -0.03 (0.636) 0.07 (0.209) 0.06 (0.268) 0.11 (0.054) 0.15** (0.008) -0.00 (0.950) 0.07 (0.229) 0.09 (0.123) 0.16** (0.005) 0.16* (0.005) 0.42** (0.000)
- 0.14* (0.016)
-0.18** (0.002)
-0.04 (0.494) Auditor 0.09
(0.098) -0.06 (0.314) 0.11* (0.047) -0.11 (0.055) 0.06 (0.287) 0.16** (0.006) 0.10 (0.089) 0.17** (0.003) -0.10 (0.091) 0.01 (0.898) -0.01 (0.907) 0.23** (0.000) 0.34** (0.000) 0.14* (0.018)
- -0.09 (0.113)
-0.04 (0.475) Loss 0.18**
(0.002) 0.19** (0.001) -0.09 (0.123) -0.02 (0.703) 0.01 (0.901) -0.22** (0.000) -0.11* (0.046) -0.09 (0.117) -0.01 (0.901) 0.05 (0.353) -0.01 (0.904) -0.20** (0.000) -0.34** (0.000) -0.17** (0.002) -0.09 (0.113)
- 0.21** (0.000) LNOC 0.08
(0.173) 0.13* (0.025) -0.04 (0.501) 0.01 (0.823) 0.01 (0.850) -0.10 (0.109) 0.09 (0.140) -0.03 (0.679) 0.06 (0.314) 0.01 (0.833) -0.02 (0.748) -0.02 (0.780) -0.09 (0.138) -0.03 (0.579) -0.07 (0.222) 0.19** (0.002) -
Table 6
Regression estimates of earnings quality variables on audit committee and control variables for 309 ASX listed companies in 2001
Variable Pred. sign
EQJones EQDD
Intercept ? 0.295 (1.902) 0.403 (3.304)** 0.286 (4.391)** 0.305 (3.925)**
ACIND - 0.006
(0.146) -0.034 (-1.207) 0.003 (0.169) 0.014 (0.795)
ACACCEX - 0.045
(1.049) 0.031 (0.965) -0.038 (-2.101)* -0.040 (-1.916)*
ACLEGEX - -0.016
(-0.257) -0.001 (-0.022) -0.015 (-0.554) -0.012 (-0.406)
ACMEET - -0.002
(-0.283) -0.002 (-0.293) 0.006 (1.609) 0.003 (0.859)
ACSIZE - 0.006
(0.496) 0.005 (0.554) -0.004 (-0.824) -0.010 (-1.591)
AUDITOR - 0.080
(2.350)* 0.070 (2.765)** 0.001 (0.100) 0.006 (0.349)
LNTA - -0.019
(-2.140)* -0.021 (-2.930)** -0.012 (-3.357)** -0.012 (-2.616)**
LEV + 0.101
(1.545) 0.015 (0.309) 0.063 (2.310)* 0.052 (1.640)
LOSS + 0.039
(1.379) 0.042 (2.025)* 0.019 (1.606) 0.012 (0.904)
LNOC + 0.023
(1.845)*
- 0.001
(0.285)
-
Capital goods ? - -0.022 (-0.379)
- -0.019 (-0.534) Commercial, services and
supplies
? - 0.017
(0.285)
- 0.007
(0.167)
Energy ? - 0.054
(0.855)
- -0.017 (-0.419) Food, beverage and
tobacco
? - 0.368
(6.302)**
- -0.023 (-0.629) Healthcare equipment
and services
? - 0.012
(0.189)
- 0.004
(0.096) Hotels, restaurants and
leisure
? - -0.014
(-0.217)
- -0.025 (-0.592)
Materials ? - 0.022
(0.410)
- -0.005 (-0.142)
Media ? - 0.242
(3.861)**
- -0.017 (-0.433) Pharmaceuticals and
biotechnology
? - -0.037
(-0.559)
- 0.033
(0.780)
Retailing ? - -0.000
(-0.001)
- -0.008 (-0.203) Software and services ? - 0.121
(2.029)*
- 0.031
(0.798) Telecommunication
services
? - 0.423
(6.120)**
- 0.082
(1.861)
Adjusted R2 0.033 0.424 0.050 0.073
F statistic 1.977* 11.703** 2.469** 2.132**
N 283 306 282 305
* significant at the 0.05 level; ** significant at the 0.01 level (p-values are one-tailed when direction is as predicted, otherwise two-tailed). Variable definitions are provided in table 4.