Teachers’ pay statistics
Standard Note: SN/SG/1877
Last updated: 11 December 2008
Author: Paul Bolton
Section Social & General Statistics
This note looks at the average pay and the starting salary for a school teacher, how this compares to other jobs, different sectors of the economy and how it has changed over time. The majority of this note focuses on England and Wales, although a comparison with the situation in Scotland is also made. Readers may also be interested in the following notes:
Teacher supply
Education: Historical statistics
DCSF data on teachers, including teachers’ pay can be found on the DCSF research and
statistics pages
Contents
1 Trends in Pay 2
1.1 Different occupations 2
1.2 Starting salaries 3
2 Average salaries in 2006 3
2.1 Different types of teachers 3
2.2 Different occupations 4
2.3 Teachers in Scotland 4
2.4 Teachers in the independent sector 4
3 International Comparisons 6
4 Changes to the classroom teachers’ pay scale 5
4.1 Annual pay awards 5
4.2 Performance pay and the upper pay scale 6
5 Reference tables 7
This information is provided to Members of Parliament in support of their parliamentary duties and is not intended to address the specific circumstances of any particular individual. It
1
should not be relied upon as being up to date; the law or policies may have changed since it was last updated; and it should not be relied upon as legal or professional advice or as a substitute for it. A suitably qualified professional should be consulted if specific advice or information is required.
Trends in Pay
1.1 All teachers
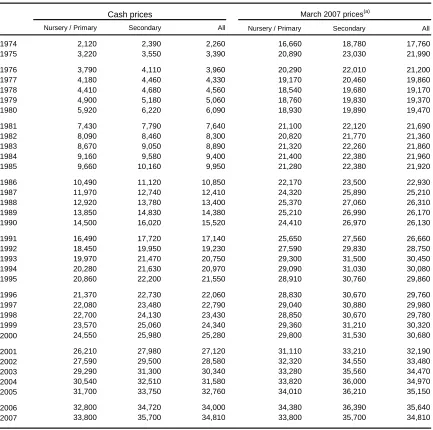
The enclosed Table 1.1 gives the average salary for qualified nursery/primary and secondary teachers in the maintained sector in England and Wales since 1974. This covers all qualified teachers, from classroom teachers to head teachers. Trends in real terms are illustrated opposite. This shows an overall upward trend, but the first two decades tended to see a sharp upturn in salaries followed by a longer period of no real
increase or real declines. Average salaries increased in real terms in each of the eight years to March 2006 (the longest continuous period of growth in the whole period) but fell in real terms in the year to March 2007.
Average salaries of qualified teachers
2007 prices
£0 £5,000 £10,000 £15,000 £20,000 £25,000 £30,000 £35,000
1974 1976 1978 1980 1982 1984 1986 1988 1990 1992 1994 1996 1998 2000 2002 2004 2006 Secondary
Nursery and primary
The average salary of both groups of teachers has followed a very similar trend. Nursery/primary teachers pay increased by a greater amount over the entire period; an average annual real increase of 2.2% compared to 2.0% for secondary school teachers. In 1974 the average (mean) salary for nursery/primary teachers was just below the mean for all employees1 and secondary teachers earned 10% above average.2 In 2007 the means for
nursery/primary and secondary teachers were 22% and 12% above mean earnings for all full-time employees.3
It should be noted that changes in the average actually paid to teachers result from changes in their distribution on their pay spines and changes in various allowances as well as the annual pay settlements (value of any particular spine point over time). In general terms, one would expect that average pay would increase by more than the pay settlement if the profession becomes relatively more experienced (low turnover, few new years, few retiring) and by less than the settlement if it becomes less experienced (high numbers of new teachers entering and experienced teachers leaving the profession). Section C of this note looks in more detail at pay settlements.
1.2 Different occupations
Using data from the New Earnings Survey and its replacement the Annual Survey of Hours and Earnings it is possible to look at trends in real average salaries among different occupations.4 The change in survey methods and coverage means that these figures should
be seen as broadly indicative only. On this basis the mean salary of full-time teachers increased by 134% in real terms5
between 1975 and 2008. This was a slightly larger
1
Average salary for full-time employees whose pay was not affected by absence
2
HC Deb 29 January 2001 c33-34w
3
2007 Annual Survey of Hours and Earnings (ASHE), ONS. Table 14.1a
4
Adults in full-time employment. The NES data goes up to 1997, individual occupations given here are public sector employees only and the data is for Great Britain. ASHE data from 1997 covers all public and private sector employees in these occupations and the data is for the UK as a whole.
5
increase than for the police (128%) and the pubic sector as a whole (114%), but less than for nurses and midwives (147%) and the private sector as a whole (136%). These comparisons are affected by the choice of starting date as the previous chart shows that mean pay levels were quite erratic in the mid 1970s and 1975 was a relative peak for teachers’ pay. If 1980 is used as a baseline then teachers’ pay increased at a faster rate than any of the other comparators given here.6 Section 2 looks at recent comparisons of salaries for different
occupations in cash terms
1.3 Starting salaries
The attached Table 1.2 gives, for various years since 1979, the starting point of the classroom teacher’s salary scale, the starting salary for a newly qualified nurse and the median starting salary for graduates in graduate-type jobs. The real increases in each figure were broadly similar over the whole period, although the starting salary for a newly qualified nurse has increased by the greatest amount. In 1979 the starting salary for a teacher was £3,231; this was about 81% of the median graduate starting salary. By 2008, a teacher’s starting salary was 82% of the estimated median graduate starting salary. It should be noted that the figures for teachers and nurses exclude any area based payments for those employed in London or the South East. In addition they exclude the one-off ‘golden hellos’ paid to newly qualified teachers in certain shortage subjects and the value of student loan write offs.
2
Average salaries in 2007
2.1 Different types of teachers
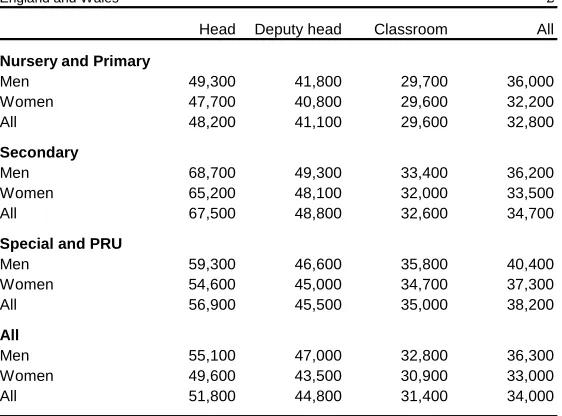
The enclosed Table 2.1 shows the latest information from the Department for Children, Schools and Families (DCSF) on the average salary of different teachers in the maintained sector. The chart opposite summarises these figures. At the end of March 2007 the average salary for all teachers in maintained schools in England and Wales was £35,000. The average classroom teacher salary was £32,200. Male
teachers earned more than their female colleagues; although the disparity becomes more obvious only at ages 40 and over.7 Male teachers were also more likely to be heads or
deputies and hence their overall average salary was also higher. The differences between the pay of primary and secondary teachers is much greater among deputy heads and heads especially.
Average salary of full-time qualified teachers, £000s
-10 20 30 40 50 60 70
Head Deputy head Classroom
Nursery and Primary Secondary All
Teachers in similar posts are on the same pay scale. Classroom teachers on the main pay scale normally move up one spine point for each year they teach until they reach the top of
6
New Earnings Survey, various years, ONS; Annual Survey of Hours and Earnings (ASHE), various years, ONS
7
the scale. Movement up the upper pay scale is no automatic. Teachers can also receive additional allowances for management responsibilities, Special Needs and Recruitment & Retention. Teachers who work in and around London receive an allowance to account for the higher costs of living. Differences in the proportion of teachers with management points, and (to a lesser degree) the proportion on the upper pay scale are the main reasons for the variation between the pay of primary and secondary classroom teachers. In March 2007 55% of secondary teachers received at least one management point, compared to 32% of primary teachers.8
2.2 Different occupations
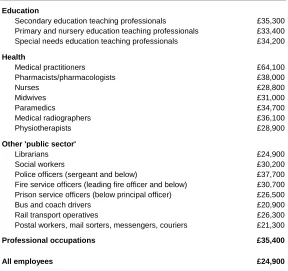
Table 2.2 appended compares median teachers’ salaries with other, mainly public sector type occupations. This data is taken from the Annual Survey of Earnings and Hours and is based on all teachers for the different phases. In April 2008 median salaries for each group of teachers was above the average for all employees. However, they were all below the median for all professional occupations, although the difference was not especially large for secondary and special school teachers.
2.3 Teachers in Scotland
Following the publication of the McCrone Report9 in 2001 an agreement was reached that
made a number of significant changes to the pay and conditions of teachers in Scotland.10
The pay deal involved a 21.5% increase in over 3 years and a shortening of the pay spine from nine to seven points by August 2003.11 This was followed by a four-year pay deal. The
salary for a newly qualified (probationer) teacher from 1 April 2008 is £20,427, compared to £20,627 in England and Wales (from September 2008). The top of the pay scale in Scotland (without any further allowances) is £32,583 and can be reached after six years. The top of the main pay scale in England and Wales is currently £30,148 and can be reached after five years.12
2.4 Teachers in the independent sector
There is no simple way to compare pay in the maintained and independent sectors. The main problem is the variety of salaries and remuneration packages across the independent sector. Independent schools are not covered by any one governing body. Just over half of all independent schools in the UK belong to one of eight associations that form the Independent Schools Council (ISC). These schools contain 80% of all independently educated pupils.13
Even within these associations there is no consistency over pay. Individual schools are free to offer salaries based on the prevailing market conditions.
According to the Independent Schools Information Service all ISC schools are expected to pay at leastthe national salary scales, with individual schools adding an agreed percentage to these rates.14
Larger schools have their own pay scales, which are likely to improve ‘significantly’ on state sector scales. In addition, there are also allowances for house and
8
ibid. Table G3
9
Independent Committee of Inquiry into Professional Conditions of Service of Teachers
10
A Teaching Profession for the 21st Century: Agreement reached following recommendations made in the McCrone Report, Scottish Executive
11
www.teachinginscotland.com
12
Salaries agreement 2004-2008, Scottish Negotiating Committee for Teachers
13
ISC census 2007, Independent Schools Council
14
pastoral staff in boarding schools. Other extra benefits for independent school staff may include accommodation in boarding schools and fee remission for their children.15
A survey for the Times Educational Supplement from 2000 found enormous variation within the independent sector. Staff in boarding schools were generally paid more and ‘top’ independent teachers could receive around 15% more than an equivalent state teacher. The survey also found that in some smaller independent schools pay could be much less than in state schools. Head teachers were paid between £40,000 and £100,000 with benefits ‘often’ including accommodation, a car, health insurance and children’s school fees.16 These figures
only show a limited part of the overall pay situation in this sector. There clearly are significant variations between these schools and averages will tend to hide such disparities.
3
Changes to the classroom teachers’ pay scale
3.1 Annual pay awards
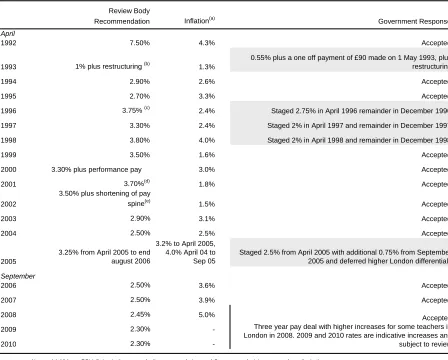
Table 3.1 at the end of this note details the School Teachers’ Review Body (STRB) recommendations on classroom teacher pay and the Government’s response since 1992. In eleven of the sixteen years the recommendations were accepted.17 Staging of awards means
that part of the recommended increase is delayed, although the recommended salary is reached later in the year. The cost of this for a classroom teacher on average salary, compared to full implementation, was around £140, £190, £280 and £160 in 1996, 1997, 1998 and 2005 respectively.18
A number of the pay settlements have been more complicated than a simple across the board increase to all spine points. Performance pay and the upper pay scale were introduced in 2000. The headline increase of 3.7% in the 2001 pay settlement was the minimum increase any teacher would receive. Those below the top of the pay scale received more than this, the largest increase was for newly qualified teachers who received an increase of 6.6%. The 2002 settlement included an uplift of 3.5% for all spine points in April plus a shortening of the pay scale to six points from September. These changes generally brought pay increases above the headline figure, as illustrated in first chart in this note and Table 1.1.
Annual pay rounds take account of the current rate of inflation, although the review body reports a number of months before any change is implemented and the actual value of a given headline percentage increase can only be calculated in retrospect a year or so after it is implemented. Since 1992 headline pay increases (when implemented) have been below the (then) current rate of inflation19 in April 1998, April 2003, April/September 2005, and in
each subsequent settlement to September 2008. However, as described in Section 1, average pay generally increased over the 10 years to 2006. This may reflect an increased number of teachers on the upper pay scale and/or changes in pay beyond the headline percentage increases. The data on teachers’ pay is based on a census of all teachers in the maintained sector which lags behind by around 18 months. Data up to March 2007 is the first to support the case that below inflation pay settlements have contributed to a real fall in average teachers’ pay.
15
ISIS website (www.isis.org.uk)
16
Where does all the money go?; The earnings game, Times Education Supplement 11 February 2000
17
The table does not distinguish between recommendations that were funded, or those that had to be met from existing budgets.
18
Average salaries as in Table 1
19
3.2 Performance pay and the upper pay scale
The Government first put its proposals on reforming teachers’ pay to the STRB in September 1999. These were that teachers who meet national standards at the performance threshold would receive an initial increase of £2,000 and access to an upper pay scale. Progress up this pay scale would depend on performance, and could mean basic salaries of up to £30,000. The current starting point of the upper pay scale (outside London) is £32,660; the maximum is point three, which is worth £35,121. Teachers on the upper pay scale can also receive the allowances mentioned earlier. Other proposals included a new series of management allowances (on a separate scale) to replace responsibility points and higher salaries of over £40,000 for Advanced Skills Teachers (ASTs).
The implementation of the performance threshold was delayed by a judicial review until December 2000, but backdated to September 2000. Teachers could apply for assessment at the threshold once they reached the top of the main pay scale. Over 200,000 teachers in England applied in the first year, 80% of those eligible. Of these, 195,000 were assessed as meeting the threshold standards.20
Progress up the scale is based on ‘continued substantial and sustained performance and contribution to the school’.21
This is therefore not automatic, but has to be agreed by the school’s governing body on the head teacher’s recommendation. The STRB stated that teachers would not normally progress more quickly that at two-yearly intervals.
At the end of March 2007 44% of full-time classroom teachers in nursery/primary schools and 46% of those in secondary schools were on the upper pay scale.22
4 International
Comparisons
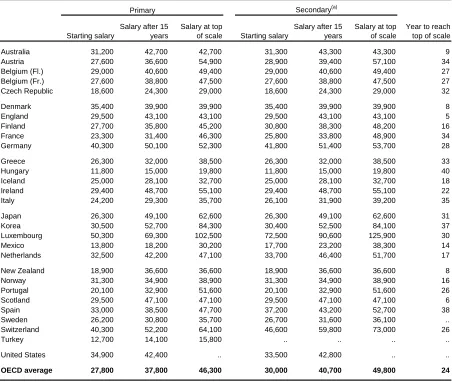
The OECD has produced a comparison of teachers’ starting salaries, typical salary after 15 years and at the top of the scale. This, as with all international comparisons, needs to be viewed with caution. The treatment of allowances/bonuses and the definition of the top of the salary scale are particularly problematic. All allowances are excluded from the figures for England; the definition of the maximum salary is the top of the main scale, again without any allowances. In other countries certain bonuses are included, as it is often difficult to separate bonuses from basic salary increments. Table 4.1 appended gives these figures for primary and secondary teachers in OECD countries. The starting salary for teachers in England was above the majority of countries and above the OECD average. However, the difference was much smaller for secondary school teachers who have a higher starting salary in a number of other countries. The relatively short pay spine in England meant that the salaries after 15 years were above OECD average to a greater degree, but the maximum was below. It takes five years to reach the top of the main classroom teacher pay scale in England, shorter than in any other OECD country and 19 years less than the OECD average. The upper pay spine is not included in this analysis. If it were and the figures for other countries remained the same, then the maximum figures would be above the OECD average and years to reach the top of the scale would be increased, although still below the OECD average.
20
HC Deb 13 November 2001 c714-5w
21
School Teachers’ Review Body Eleventh Report 2002 (Cm 5353) para. 61
22
5 Reference
tables
Table 1.1
Cash prices March 2007 prices(a)
Nursery / Primary Secondary All Nursery / Primary Secondary All
1974 2,120 2,390 2,260 16,660 18,780 17,760
1975 3,220 3,550 3,390 20,890 23,030 21,990
1976 3,790 4,110 3,960 20,290 22,010 21,200
1977 4,180 4,460 4,330 19,170 20,460 19,860
1978 4,410 4,680 4,560 18,540 19,680 19,170
1979 4,900 5,180 5,060 18,760 19,830 19,370
1980 5,920 6,220 6,090 18,930 19,890 19,470
1981 7,430 7,790 7,640 21,100 22,120 21,690
1982 8,090 8,460 8,300 20,820 21,770 21,360
1983 8,670 9,050 8,890 21,320 22,260 21,860
1984 9,160 9,580 9,400 21,400 22,380 21,960
1985 9,660 10,160 9,950 21,280 22,380 21,920
1986 10,490 11,120 10,850 22,170 23,500 22,930
1987 11,970 12,740 12,410 24,320 25,890 25,210
1988 12,920 13,780 13,400 25,370 27,060 26,310
1989 13,850 14,830 14,380 25,210 26,990 26,170
1990 14,500 16,020 15,520 24,410 26,970 26,130
1991 16,490 17,720 17,140 25,650 27,560 26,660
1992 18,450 19,950 19,230 27,590 29,830 28,750
1993 19,970 21,470 20,750 29,300 31,500 30,450
1994 20,280 21,630 20,970 29,090 31,030 30,080
1995 20,860 22,200 21,550 28,910 30,760 29,860
1996 21,370 22,730 22,060 28,830 30,670 29,760
1997 22,080 23,480 22,790 29,040 30,880 29,980
1998 22,700 24,130 23,430 28,850 30,670 29,780
1999 23,570 25,060 24,340 29,360 31,210 30,320
2000 24,550 25,980 25,280 29,800 31,530 30,680
2001 26,210 27,980 27,120 31,110 33,210 32,190
2002 27,590 29,500 28,580 32,320 34,550 33,480
2003 29,290 31,300 30,340 33,280 35,560 34,470
2004 30,540 32,510 31,580 33,820 36,000 34,970
2005 31,700 33,750 32,760 34,010 36,210 35,150
2006 32,800 34,720 34,000 34,380 36,390 35,640
2007 33,800 35,700 34,810 33,800 35,700 34,810
Note: Data prior to 1993 includes sixth form colleges (a) Figures adjusted using the all-times RPI
Sources: School Workforce in England (including Local Authority level figures), January 2008 (Revised), DCSF
DCSF time series -teachers' pay; ONS - CSDB database series CHAW 31 March each year
Table 1.2
Starting salaries for teachers, nurses and graduates As at April
Teachers (a) Nurses (b) Graduates(c)
1979 3,231 3,150 3,970
1986 6,423 6,475 8,000
1992 11,184 10,820 12,800
1997 12,711 12,385 15,500
2002 16,632 15,445 20,000
2006 19,161 19,166 23,000
2007 19,641 19,454 23,500
2008 20,133 20,225 24,500
Real change
1979 to 2007(d) +54.9% +59.6% +53.4%
Notes: (a) School Teacher starting salary (main scale/spine point 0)
(b) Minima of Band 5 from October 2004 and clinical grade D and Staff nurse (SRN) previously
(d) Adjusted using the all-items RPI Sources: HC Deb 2 February 1988 c585-8W
HC Deb 26 February 2001 c380-81w
Graduate Market Trends Spring 2002 and earlier. AGR summer survey 2006 and earlier
School Teachers’ Review Body eleventh report 2002 (Cm5353) and earlier
School Teachers' pay and conditions document, various years, DCSF/DfES
Agenda for change pay circulars, various, DH
(c) Median Graduate starting salary in graduate-type jobs. Taken from the Association of Graduate Recruiters' Annual Graduate Salaries and Vacancies Surveys, summer surveys from 2006
Review Body for Nursing Staff, Midwives, Health Visitors and Professions Allied to Medicine Nineteenth report 2002 (Cm 5345) and earlier
Table 2.1
England and Wales £
Head Deputy head Classroom All
Nursery and Primary
Men 49,300 41,800 29,700 36,000
Women 47,700 40,800 29,600 32,200
All 48,200 41,100 29,600 32,800
Secondary
Men 68,700 49,300 33,400 36,200
Women 65,200 48,100 32,000 33,500
All 67,500 48,800 32,600 34,700
Special and PRU
Men 59,300 46,600 35,800 40,400
Women 54,600 45,000 34,700 37,300
All 56,900 45,500 35,000 38,200
All
Men 55,100 47,000 32,800 36,300
Women 49,600 43,500 30,900 33,000
All 51,800 44,800 31,400 34,000
Source: School Workforce in England (including pupil: teacher ratios and pupil: adult ratios), January 2007 (Revised), DCSF. Table G1 Average salary of full-time regular teachers in maintained schools, by sex,
[image:8.595.73.354.508.716.2]Table 2.2
Median salaries(a) of full-time employees, selected occupations, April 2008
UK
Education
Secondary education teaching professionals £35,300 Primary and nursery education teaching professionals £33,400 Special needs education teaching professionals £34,200
Health
Medical practitioners £64,100 Pharmacists/pharmacologists £38,000
Nurses £28,800
Midwives £31,000
Paramedics £34,700
Medical radiographers £36,100
Physiotherapists £28,900
Other 'public sector'
Librarians £24,900
Social workers £30,200
Police officers (sergeant and below) £37,700 Fire service officers (leading fire officer and below) £30,700 Prison service officers (below principal officer) £26,500 Bus and coach drivers £20,900 Rail transport operatives £26,300 Postal workers, mail sorters, messengers, couriers £21,300
Professional occupations £35,400
All employees £24,900
Table 3.1
Teachers' Pay Awards -England and Wales
Review Body
Recommendation Inflation(a) Government Response
April
1992 7.50% 4.3% Accepted
1993 1% plus restructuring (b) 1.3%
0.55% plus a one off payment of £90 made on 1 May 1993, plus restructuring
1994 2.90% 2.6% Accepted
1995 2.70% 3.3% Accepted
1996 3.75% (c) 2.4% Staged 2.75% in April 1996 remainder in December 1996 1997 3.30% 2.4% Staged 2% in April 1997 and remainder in December 1997
1998 3.80% 4.0% Staged 2% in April 1998 and remainder in December 1998
1999 3.50% 1.6% Accepted
2000 3.30% plus performance pay 3.0% Accepted
2001 3.70%(d) 1.8% Accepted
2002
3.50% plus shortening of pay
spine(e) 1.5% Accepted
2003 2.90% 3.1% Accepted
2004 2.50% 2.5% Accepted
2005
3.25% from April 2005 to end august 2006
3.2% to April 2005, 4.0% April 04 to Sep 05
Staged 2.5% from April 2005 with additional 0.75% from September 2005 and deferred higher London differentials
September
2006 2.50% 3.6% Accepted
2007 2.50% 3.9% Accepted
2008 2.45% 5.0%
2009 2.30%
-2010 2.30%
-Notes: (a) All items RPI inflation in the year to April, recommendations and Government decisions are made earlier in the year (b) The recommendations would cost a total of 1.5% in 1993/94 and an additional 0.35% in 1994/95
(c) more for lower end of scale
(d) Those below the top of the main pay scale received more, up to 6.6% for new teachers. The total cost was 4.2% (e) The pay scale will be shortened from 9 to 6 points with the same maxima
Sources: Schools Teacher' Review Body seventeenth report and earlier editions School Teachers' Pay and Conditions Document 2008 and earlier editions HC Deb 29 January 1998 c307-310w
HC Deb 6 February 1997 c698-701w HC Deb 8 February 1996 c294-296w HC Deb 9 February 1995 c247-8w HC Deb 3 February 1994 c848w HC Deb 12 February 1993 c838-9w HC Deb 10 February 1992 c348-9w
Table 4.1
Annual statutory teachers' salaries in state schools, 2006
$US converted using PPPs
Primary Secondary(a)
Starting salary
Salary after 15 years
Salary at top
of scale Starting salary
Salary after 15 years
Salary at top of scale
Year to reach top of scale
Australia 31,200 42,700 42,700 31,300 43,300 43,300 9 Austria 27,600 36,600 54,900 28,900 39,400 57,100 34 Belgium (Fl.) 29,000 40,600 49,400 29,000 40,600 49,400 27 Belgium (Fr.) 27,600 38,800 47,500 27,600 38,800 47,500 27 Czech Republic 18,600 24,300 29,000 18,600 24,300 29,000 32
Denmark 35,400 39,900 39,900 35,400 39,900 39,900 8 England 29,500 43,100 43,100 29,500 43,100 43,100 5 Finland 27,700 35,800 45,200 30,800 38,300 48,200 16 France 23,300 31,400 46,300 25,800 33,800 48,900 34 Germany 40,300 50,100 52,300 41,800 51,400 53,700 28
Greece 26,300 32,000 38,500 26,300 32,000 38,500 33 Hungary 11,800 15,000 19,800 11,800 15,000 19,800 40 Iceland 25,000 28,100 32,700 25,000 28,100 32,700 18 Ireland 29,400 48,700 55,100 29,400 48,700 55,100 22
Italy 24,200 29,300 35,700 26,100 31,900 39,200 35
Japan 26,300 49,100 62,600 26,300 49,100 62,600 31
Korea 30,500 52,700 84,300 30,400 52,500 84,100 37
Luxembourg 50,300 69,300 102,500 72,500 90,600 125,900 30 Mexico 13,800 18,200 30,200 17,700 23,200 38,300 14 Netherlands 32,500 42,200 47,100 33,700 46,400 51,700 17
New Zealand 18,900 36,600 36,600 18,900 36,600 36,600 8 Norway 31,300 34,900 38,900 31,300 34,900 38,900 16 Portugal 20,100 32,900 51,600 20,100 32,900 51,600 26 Scotland 29,500 47,100 47,100 29,500 47,100 47,100 6
Spain 33,000 38,500 47,700 37,200 43,200 52,700 38
Sweden 26,200 30,800 35,700 26,700 31,600 36,100 .. Switzerland 40,300 52,200 64,100 46,600 59,800 73,000 26
Turkey 12,700 14,100 15,800 .. .. .. ..
United States 34,900 42,400 .. 33,500 42,800 .. ..
OECD average 27,800 37,800 46,300 30,000 40,700 49,800 24
.. not available