How the large-scale EV rollout would impact the
UK energy system? – Analysis of Network
Investments and Changes in Fuel Use
Christian F. Calvillo*1, [email protected]
Karen Turner1, [email protected]
* Corresponding author
1 Centre for Energy Policy, International Public Policy Institute, University of Strathclyde.
Abstract
The electrification of transport has been identified as a key policy area, which has multiple implications on the energy system, the economy, and the environment. Focusing on electric vehicles (EV), several examples of studies analysing the impact of a large scale penetration of EVs can be found in the literature. However, these studies usually focus only on the implications for the electricity network. Therefore, the challenge is to understand how the expected rollout of EVs affects the energy system on different dimensions beyond the power sector.
With the aim of identifying wider impacts of a large rollout of EVs in the UK and to inform effective analysis of energy policy, we use the UK TIMES model to implement five different EV charging scenarios, varying on the timing (i.e. ‘smartness’) of the charge and the location on where it happens. We conclude that ‘dumb’ and decentralised charging will require considerably larger investment on the network than the ‘smart’ and centralised counterparts. The location and ‘smartness’ of EV charging it is, therefore, important to mitigate potential negative impacts on the power system and to reduce fuel costs for the final consumer. Moreover, we have found a shift of emissions from the transport to the power sector. These results show the importance following a whole system approach, to maximise the effectiveness of policies and to avoid carbon leakage.
1.
Introduction
As a part of their actions to tackle climate change and air quality concern, a number of countries around the world are pushing ambition targets for the decarbonisation of transport. One of such actions is the widespread roll-out of electric vehicles (EV). In the case of the UK, the Government has set the target of all new cars and vans to be effectively zero direct emission by 2040 (UK Government, 2018), and other sources such as National Grid (the British TSO) expect an overall EV penetration of 90% by 2050 (National Grid, 2018).
A large penetration of EVs is likely to bring important challenges to the energy system, potentially requiring new generation capacity and network reinforcements (Su et al., 2019). For instance, Blokhuis et al. (2011) analyses the potential electricity peak load increases due to sustainable energy transitions. The authors take the city of Eindhoven to analyse the effects of the introduction of heat pumps and EVs on peak load projections, concluding that under worst case assumptions, peak loads in Eindhoven increase with 200% until 2040. Also, the study estimates that the necessary network investment for facilitating this 2040 peak demand is in the range of € 305–375 million. However, Impacts on fuel costs or emissions are not considered.
Pudjianto et al. (2013) also analyse the growth of electricity loads caused by the electrification of transport and heat. The authors develop a range of numerical simulations on different distribution network topologies (urban and rural) in the UK, assessing the need and the cost of network reinforcements required to accommodate future load. The study concludes that under current passive distribution network and passive demand approaches, electricity peak demand its likely to increase up to 2–3 times and significant distribution network reinforcement will be required, costing up to £36bn across the period 2010–2050. Note that this study does not include the transmission network in their analysis and it does not analyse the impact on energy costs or CO2 emissions.
Many studies have been developed to address some of these challenges. However, most of them fail to analyse the implications of a large penetration of EVs outside the power sector, not considering, for example, the changes on fuel use and consumer costs. The objective of this paper is to provide insight on this issue, by modelling five types of EV charging scenarios, using the UK TIMES model, under a high EV penetration context. These scenarios vary in where the charging take place and the ‘smartness’ of the charge. Decentralised charging is assumed to occur at distribution level (i.e. charging is done at home or at work in the city), whereas centralised charging is assumed to occur before the distribution level. ‘Dumb’ charging consist in charging at peak hours, when people come back from work and electricity demand is highest, and ‘Smart’ charging only occurs when it is cheaper to do so (mostly overnight).
The work developed in this paper aims to provide insight on the wider effects of the electrification of transport, analysing the implications of a large penetration of EV under different charging scenarios, and discussing best practices on informing energy policy. Note that this analysis does not give a full wider-economy picture, but it is a key step along that path.
2.
Methodology (Model description and base scenario)
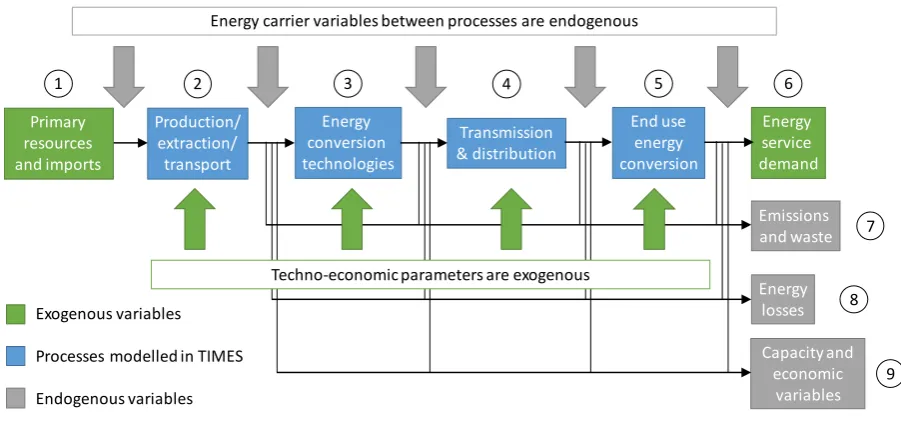
[image:4.595.70.521.455.669.2]TIMES is a bottom-up an energy system-wide model, which considers all the processes of the energy system. The model considers all the processes that transform, transport, distribute and convert energy to supply energy services (see Figure 1).
Figure 1. Modelling of the energy system in TIMES (Calvillo et al., 2017)
TIMES uses linear-programming to find a least-cost energy system, able to meet specified energy service demands, according to a number of user constraints. A more detailed description of the
1 2 3 4 5 6
7 Production/ extraction/ transport Energy conversion technologies Transmission & distribution Energy service demand End use energy conversion Emissions and waste 8 Energy losses 9 Capacity and economic variables Energy carrier variables between processes are endogenous
Techno-economic parameters are exogenous Primary
resources and imports
Exogenous variables
Processes modelled in TIMES
model can be found in Calvillo et al. (2017) and official documentation can be found in Loulou et al. (2004, 2005).
The UK TIMES model (UKTM, version V.1.2.2) is used in this study to test the impact of different EV charging strategies in a context of high EV penetration. See (UCL, 2014) for more information on the UK TIMES model.
UKTM is a very large model with thousands of variables, parameters and constraints. UKTM differs from other TIMES versions on parameters and input data used, which should reflect the characteristics of the country or region modelled. However, the general structure of the models is similar, so the insights obtained here are very likely to be useful and applicable to other TIMES models.
2.1
Car demand projections in UKTM
Table 1 shows the expected car transport demand used for this analysis. The Car, Bus, LGV and HGV demand drivers are based on Department of Transport (DfT) Road traffic forecasts 2015 for England and Wales. This is assumed to be representative of the whole UK (GOV.UK, 2015). Note that these projections are based in travelled miles, which are independent of car ownership method.
Table 1. Car transport demand projections.
2010 2015 2020 2025 2030 2035 2040 2045 2050 Billion
miles
219.9 233.8 251.9 270.6 281.6 293.3 303.7 315.3 327.5
Index 100% 106% 114% 123% 128% 133% 138% 143% 149%
3.
Parameters and scenario description
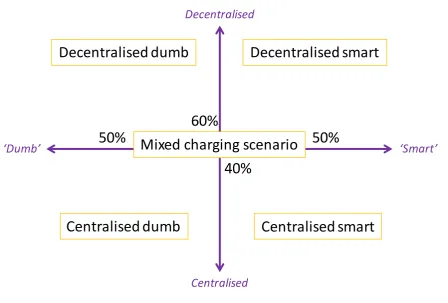
Five different EV charging scenarios are analysed in this study. As shown in Figure 2, these scenarios vary in where the charging take place and the ‘smartness’ of the charge. The scenarios are:
Decentralised ‘dumb’ charging Decentralised ‘smart’ charging Centralised ‘dumb’ charging Centralised ‘smart’ charging
Decentralised charging is assumed to occur at distribution level (i.e. charging is done at home or at work in the city), whereas centralised charging is assumed to occur before the distribution level. That is, in big parking lots in the outskirts of cities, similar to the ‘park and ride’ schemes (Mills and White, 2018). ‘Dumb’ charging consist in charging at peak hours, when people come back from work and electricity demand is highest, and ‘Smart’ charging only occurs when it is cheaper to do so (mostly overnight).
Figure 2. The five EV charging scenarios.
These scenarios are compared with a ‘business-as-usual’ base scenario with no EV penetration.
3.1
EV parameters
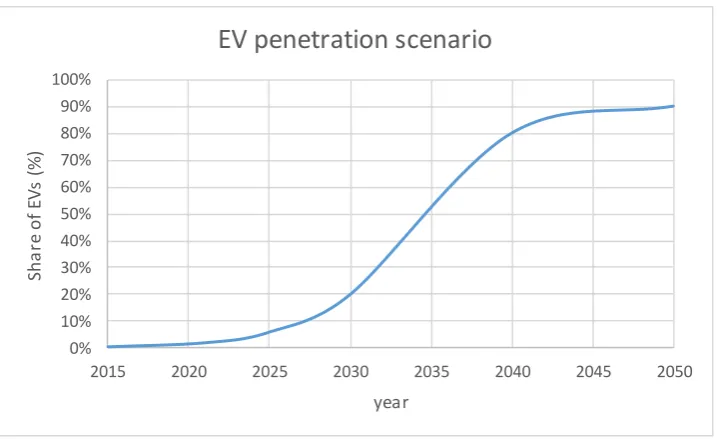
Figure 3 shows the EV rollout projection used in this study. The expected EV penetration is around 20% by 2030, 80% by 2040 and 90% by 2050, which applies to all five EV charging scenarios described above. This EV penetration scenario is based on the SPEN RIIO-T2 Electricity Scenarios 2018 consultation (SPEN, 2018) and National Grid Future Energy Scenarios FES2018
(National Grid, 2018).
‘Dumb’
‘Smart’
Decentralised
Centralised
Decentralised smart
Centralised smart
Decentralised dumb
Centralised dumb
60%
40%
Figure 3. Considered EV penetration for all EV charging scenarios
Table 2 summarises the main EV parameters considered in this study. The EV technical efficiency are expected to increase in the future, whereas vehicle upfront costs and operation and maintenance costs are expected to decrease. In particular, these costs are reduced considerably from the first commercial options in 2010 to current costs, and it is expected to continue to decrease in the future. These projections roughly align with the forecasts provided by Bloomberg
New Energy Finance (2018) and the International Energy Agency (2018).
Table 2. EV parameters used in this study.
2010 2020 2030 2040 2050
Lifetime (years) 12
Technical efficiency (vehicle
km/MJ) 1.45 1.62 1.75 1.84 1.89
Vehicle cost* (k£/vehicle) 43.21 22.06 20.92 19.77 18.63
Fixed operation & maintenance
cost* (k£/vehicle) 2.93 1.68 1.62 1.55 1.48
*2010 prices
3.2 Network reinforcement cost parameters
Table 3 shows the considered capital investment, operation and maintenance costs for network reinforcements. These costs apply for all new network capacity implemented in the energy system as a result of the increasing EV demand. These costs roughly align with different network
0% 10% 20% 30% 40% 50% 60% 70% 80% 90% 100%
2015 2020 2025 2030 2035 2040 2045 2050
Sh
a
re
o
f
EV
s
(%
)
year
reports including the analysis developed by Kiani Rad and Moravej (2017), IEA ETSAP (2014) and the
Electricity Networks Strategy Group (2012).
Table 3. Transmission and distribution network reinforcement cost parameters used in this study.
Technical lifetime
(years)
Investment costs*
(m£/GW)
Fixed operation &
maintenance
cost* (m£/GW)
Transmission 40 628.26 6.34
Distribution 25 328.13 12.61
*2010 prices
4.
Results and discussion
UKTM produces a very large quantity of results for all sectors in the energy system. For the sake of brevity, only results related to energy mix for the power sector, car energy use and technology changes, and CO2 emissions are reviewed here (changes in other sectors are not analysed).
Figure 4 shows the network investments for new transmission and distribution capacity under the different EV charging scenarios and the base case. For the transmission network (Figure 4.a), no new capacity is required until 2030, where new investment occurs, especially for the ‘dumb’ charging scenarios (3 to 4 times the investment of the base case). However, the smart charging scenarios and the mixed one present a smaller difference relative to the base scenario. In 2040, the increasing penetration of EVs, reaching 80% in 2040, creates the need for extra transmission network capacity for that year, reaching the b£12 in the ‘dumb’ charging scenarios, which is approximately three times the investment of the base case. Interestingly, the decentralised ‘smart’ scenario also presents an important increase of investment (around b£10), contrasting with the centralised ‘smart’ alternative (around b£6 of investment in 2040), suggesting that not only the smartness of the EV charge affects the required transmission capacity, but the location where the charging takes place is important as well. In 2050, extra network investment is needed relative to the base scenario, but there is little difference between charging scenarios.
considerably more investment than the ‘smart’ case, especially for the large EV penetration increment in 2040 (see yellow checked columns in Figure 4.b). Lastly, the investment costs for the mixed charging scenario fall between the centralised ones and the smart decentralised one,
Figure 4. New transmission and distribution network investment across scenarios.
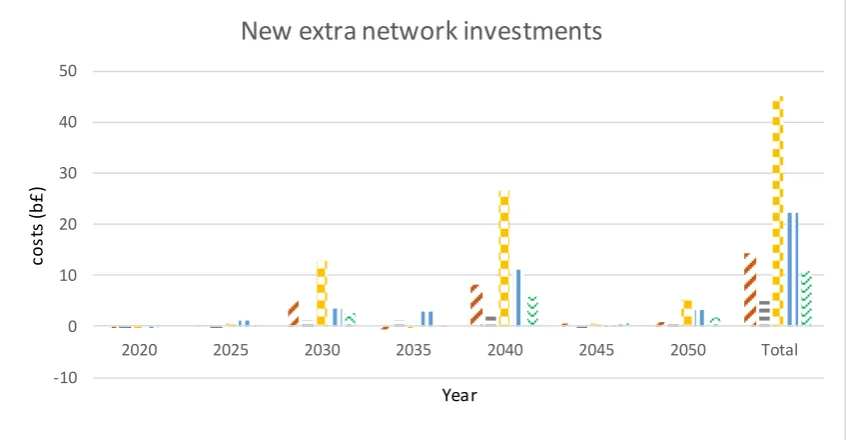
Figure 5 shows the total investments of new network capacity, relative to the base scenario. These total values are calculated as the sum of the transmission and distribution network investments in each EV scenario (see Figure 4) minus the equivalent investment made in the base case (which is assumed as investment that needed to be carried out independently of the presence of EVs).
Figure 5 shows the large difference in investment costs between scenarios, where the ‘best’ case is the centralised-smart charge scenario with b£4.9 total investment, the ‘worst’ case is the decentralised-dumb charge scenario with b£45.3. Moreover, the importance of the smart charge is evident, as the scenarios implementing smart charging require less than half the investment of
0 2 4 6 8 10 12 14
2030 2035 2040 2045 2050
co
st
s
(b
£
)
Year
a) New transmission network capacity
Base CentralCharge_dumb CentralCharge_smart
DecenCharge_dumb DecenCharge_smart MixedCharge_realistic
0 5 10 15 20
2020 2025 2030 2035 2040 2045 2050
co
st
s
(b
£
)
Year
b) New distribution network capacity
Base CentralCharge_dumb CentralCharge_smart
their ‘dumb’ counterparts. Also, the figure shows how the investments in TIMES react to the increase points in EV demand. So in 2030, with 20% EV penetration, and 2040, with 80% EV penetration, is where the largest investments are made.
[image:10.595.73.497.244.464.2]Note that, as expected, the mixed charging scenario falls somewhere in between the ‘best’ and ‘worst’ scenarios, with b£10.8 total cost. However, this cost is lower than the one from the centralised ‘dumb’ scenario (b£14.4), suggesting that the smartness of charge is potentially more important to reduce network investment costs than the location of charging. Moreover, this difference shows that the cost relation between charging scenarios do not follow a linear path.
Figure 5. New extra network investments relative to the base scenario.
Figure 6 shows the fuel use changes for car transport. For the sake of brevity, only the scenarios: base, centralised-smart and decentralised-dumb are shown here. In the base scenario, the use of petrol and diesel stay stable up to 2020, and then use of diesel steadily decreases until 2045 when is no longer used. However, petrol partly replaces diesel and its use increases slightly from 2035. This exchange of fuels is caused by the replacement of conventional petrol and diesel cars by hybrid petrol-electric cars (non-plug-in, such as the Toyota Prius (Toyota, 2019)).
In the centralised ‘smart’ charge scenario (Figure 6.b) the fuel use for car transport is similar to the base case up to 2020. After this point, diesel use falls more rapidly than in the base case, disappearing in 2035. Petrol use also decreases importantly from 2020, whereas electricity use increases due to the EV penetration. Moreover, the total use in absolute values in 2050 is 50% less than the base case. This is caused of the increased efficiency of EVs, relative to conventional cars (in this study EVs are assumed is slightly over three times more efficient than conventional
-10 0 10 20 30 40 50
2020 2025 2030 2035 2040 2045 2050 Total
co
st
s
(b
£
)
Year
New extra network investments
Figure 6. Car transport energy use per fuel type for a) base, b) centralised ‘smart’ charge and c) decentralised ‘dumb’ charge scenarios.
Figure 7 shows the fuel costs for car transport under different scenarios. In the base scenario (Figure 7.a), the fuel costs increases steadily up to 2050. However, this contrasts with the
0 200 400 600 800 1000 1200
2010 2015 2020 2025 2030 2035 2040 2045 2050
Fu el u se ( P J) Year
a) Base scenario
BIO DIESEL ELC LPG PETROL
0 200 400 600 800 1000 1200
2010 2015 2020 2025 2030 2035 2040 2045 2050
Fu el u se ( P J) Year
b) Centralised 'smart' charge
BIO DIESEL ELC LPG PETROL
0 200 400 600 800 1000 1200
2010 2015 2020 2025 2030 2035 2040 2045 2050
Fu el u se ( P J) Year
c) Decentralised 'dumb' charge
Figure 7. Car transport energy cost per fuel type for a) base, b) centralised ‘smart’ charge and c) decentralised ‘dumb’ charge scenarios. 0 5000 10000 15000 20000
2010 2015 2020 2025 2030 2035 2040 2045 2050
Fu el c o st s (M £ ) Year
a) Base scenario
BIO DIESEL ELC LPG PETROL
0 5000 10000 15000 20000
2010 2015 2020 2025 2030 2035 2040 2045 2050
Fu el c o st s (M £ ) Year
b) Centralised 'smart' charge
BIO DIESEL ELC LPG PETROL
0 5000 10000 15000 20000
2010 2015 2020 2025 2030 2035 2040 2045 2050
Fu el c o st s (M £ ) Year
c) Decentralised 'dumb' charge
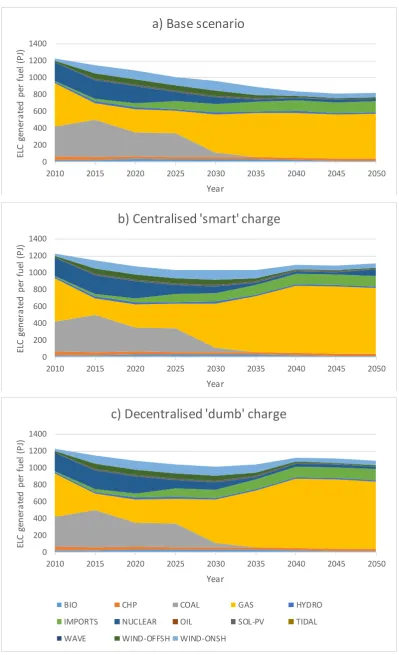
Figure 8. Electricity generation per input fuel for a) base, b) centralised ‘smart’ charge and c) decentralised ‘dumb’ charge scenarios. 0 200 400 600 800 1000 1200 1400
2010 2015 2020 2025 2030 2035 2040 2045 2050
EL C g en er a te d p er fu el ( P J) Year
a) Base scenario
BIO CHP COAL GAS HYDRO
IMPORTS NUCLEAR OIL SOL-PV TIDAL
WAVE WIND-OFFSH WIND-ONSH
0 200 400 600 800 1000 1200 1400
2010 2015 2020 2025 2030 2035 2040 2045 2050
EL C g en er a te d p er fu el ( P J) Year
b) Centralised 'smart' charge
BIO CHP COAL GAS HYDRO
IMPORTS NUCLEAR OIL SOL-PV TIDAL
WAVE WIND-OFFSH WIND-ONSH
0 200 400 600 800 1000 1200 1400
2010 2015 2020 2025 2030 2035 2040 2045 2050
EL C g en er a te d p er fu el ( P J) Year
c) Decentralised 'dumb' charge
BIO CHP COAL GAS HYDRO
IMPORTS NUCLEAR OIL SOL-PV TIDAL
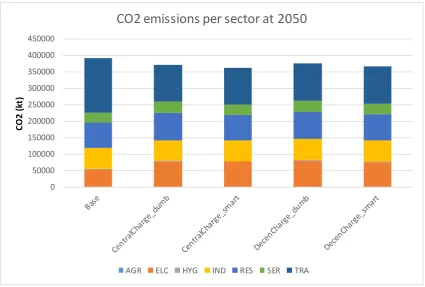
Figure 9 shows the total sectoral emissions across the different scenarios. As expected, transport related emissions (TRA) decreased approximately 32% relative to the base scenario. However, the extra electricity generation required to fuel EVs has produced an increase of emissions in the power sector (ELC) in the range of 42 – 48%. All EV scenarios present a reduction in overall CO2 emissions relative to the base case, with the ‘smart’ charging scenarios presenting greater reductions (-7.5% in CentralCharge_smart and -6.5% in DecenCharge_smart) than the ‘dumb’ ones
(-5.1% CentralCharge_dumb and -4.3% DecenCharge_dumb). The difference on emissions between
[image:16.595.72.498.281.568.2]‘smart’ and ‘dumb’ scenarios is attributed to the electricity production in peak time, which is mostly supplied by more polluting technologies than during off-peak times.
Figure 9. Comparison of CO2 emission production per sector at 2050.
4.1
Discussion of results
Analysing the results of this study, it is evident that the different charging scenarios show great difference across most outputs. Network investment costs is one example of this, with total cost ranging from b£4.9 to b£45.3. These outputs also remark on the importance ‘smart’ charging, with an approximate reduction of 50% on network investment costs, relative to the ‘dumb’ cases. Moreover, the location where the charging takes place can significantly affect network reinforcement costs, where the decentralised charging can be up to three times more expensive
0 50000 100000 150000 200000 250000 300000 350000 400000 450000
C
O
2
(
kt
)
CO2 emissions per sector at 2050
than the centralised charging. Note that the obtained network cost do not consider charging point costs, which could potentially change these differences between scenarios. These results could be used to inform policies that promote more centralised and/or ‘smart’ EV charging schemes, potentially reducing the need of expensive network investments.
Another interesting result is the timing of the network investments. Figure 5 shows how the investments in TIMES react to the increase points in EV demand. That is, the largest investments are made in 2030 (increase up to 20% EV penetration) and 2040 (increase up to 80% EV penetration). The timing of the investment is relevant for further economic analysis as the required network expansion is likely to be a complex project requiring several years to finance and implement, so the investment pathways shown in TIMES are likely to be impractical or unrealistic.
For energy use in car transport, the results show that there is no significant difference in fuel use between the considered EV scenarios (see Figure 6.b and Figure 6.c). This is an expected outcome as all scenarios implement the same EV penetration and the required input fuel is the practically same independently of the charging point (very minor differences due to network losses). On the contrary, energy costs show major differences across scenarios (see Figure 7) as the electricity marginal cost (a proxy for price) reflects on the network reinforcement costs. Therefore, the cost to charge their EVs will be considerably higher in those scenarios with higher network reinforcement needs.
The difference between these scenarios also show that the EV charging approach will have an important impact on overall energy costs for the final consumer. Not only for charging EVs but for all activities that require electricity. Hence, it is likely that households will not agree on EV policies and/or will not participate in the expected EV uptake if energy prices raise significantly, as in the case of the decentralised ‘dumb’ charging scenario. The potential impacts on energy prices is an important consideration for policy makers while designing effective EV policies.
4.2
Research limitations and future work
We believe that this study and the selected scenarios provide valuable insight on the potential impacts of the expected rollout of EVs. However, there are some opportunity areas and limitations of this study that should be taken into account. For instance, four ‘extreme’ EV charging scenarios have been considered, analysing what would happen if 100% of EVs were to be charged in a certain way. Certainly, any of these scenarios in isolation is unlikely to happen and a mix of charging approaches is most likely to be the case (e.g. the mixed charging scenario considered). However, these ‘extreme’ scenarios give a range of outcomes that can provide valuable insight for policy makers and network operators.
The TIMES model is an important tool for energy policy analysis with several examples of its use worldwide (IEA-ETSAP, 2019). However, the energy network representation is limited in TIMES. In particular, UKTM is a single region model, so the modelled energy networks do not consider geographical location of generation and demand points and the intrinsic complexities of the network. Therefore, the network investment costs obtained in this study should be considered as rough estimates, and other more specific types of power system models (such as PLEXOS or SEDM
(Pennock et al., 2016)) could be used for a more accurate approximation of network costs.
Nevertheless, we believe that these TIMES result give insight of the order of magnitude of such costs and to be able to compare the impacts of the ‘smartness’ and the location of EV charging. In addition, the TIMES model provides a whole system view approach, producing several other relevant results, such as changes in energy use for transport, changes in marginal fuel costs, changes in emissions, etc.
As future work, we will plan to use other models in combination with TIMES to expand the results obtained here. For instance, power system models could be used to improve the cost estimation of network reinforcements. Also, macroeconomic models such as CGE (Scottish Government, 2016)
5.
Conclusions
This study analysed five EV charging scenarios in the context of a large penetration of EVs. Four of these scenarios represent extreme cases of charging: ‘smart’ vs ‘dumb’, and centralised vs decentralised, whereas the fifth scenario represented a more realistic mixed-charging one. Using the UK TIMES model, we analysed the impacts of these scenarios in terms of network investment needs to accommodate the increasing EV demand, changes in fuel costs for the final consumer and changes in CO2 emissions.
The results obtained show the importance of the ‘smartness’ of EV charging in terms of network reinforcements and fuel costs, where ‘dumb’ charging (i.e. charging at peak times) represent approximately double the cost than under ‘smart’ charging (at off-peak times). The impact of the location of the charging was also assessed, and the decentralised charging (e.g. charging at home, at the end of the distribution network) presented higher overall costs, up to three times those of the centralised charging alternative (e.g. charging outside cities in a centralised location). Another interesting result of this analysis is that the decentralised ‘smart’ case is more costly than the centralised ‘dumb’ case, which suggest that the location of EV charging might be more important in reducing overall costs than the ‘smartness’ of charge. Also note that these differences in network investment costs are passed to the final consumers as an increase in energy marginal costs (energy prices). These outcomes are also important to take into account while designing energy tariffs and EV policies.
Looking into CO2 emissions, all EV scenarios presented a similar reduction in emissions for the transport sector of approximately 32% by 2050, relative to the base case without EV penetration. However, we observed a shift of sectoral emissions as the power sector, required to generate more energy to meet EV demand, increased their emissions in the range of 42 to 48%, relative to the base case. Note that the ‘smart’ charging scenarios produced lower emissions in the power sector as the more polluting power plants are normally used to generate power at peak times. Also, these results show the importance of a whole system approach to tackle climate change, where policies that target a particular sector (e.g. promoting EV uptake) need to be accompanied with other policies that ensure that there is no emission transfer to other sectors or ‘outsourced’ to other countries.
Acknowledgement
References
Blokhuis, E., Brouwers, B., van der Putten, E., Schaefer, W., 2011. Peak loads and network investments in sustainable energy transitions. Energy Policy, Sustainability of biofuels 39, 6220–6233. https://doi.org/10.1016/j.enpol.2011.07.021
Bloomberg New Energy Finance, 2018. Electric Vehicle Outlook 2018.
Calvillo, C., Turner, K., Bell, K., McGregor, P., Hawker, G., 2017. ClimateXChange :: Using the TIMES
model in developing energy policy [WWW Document]. URL
http://www.climatexchange.org.uk/reducing-emissions/using-times-model-developing-energy-policy/ (accessed 10.2.17).
Calvillo, C.F., Sánchez-Miralles, A., Villar, J., Martín, F., 2017. Impact of EV penetration in the interconnected urban environment of a smart city. Energy 141, 2218–2233. https://doi.org/10.1016/j.energy.2017.12.006
Electricity Networks Strategy Group, 2012. OUR ELECTRICITY TRANSMISSION NETWORK: A VISION FOR 2020.
IEA ETSAP, 2014. Electricity Transmission and Distribution - Technology Brief E12.
IEA-ETSAP, 2019. IEA-ETSAP | Energy Systems Analysis Applications [WWW Document]. URL https://iea-etsap.org/index.php/applications (accessed 2.1.19).
International Energy Agency, 2018. Global EV Outlook 2018 - Towards cross-modal electrification.
Kiani Rad, H., Moravej, Z., 2017. An approach for simultaneous distribution, sub-transmission, and transmission networks expansion planning. Int. J. Electr. Power Energy Syst. 91, 166–182. https://doi.org/10.1016/j.ijepes.2017.03.010
Loulou, R., Goldstein, G., Noble, K., 2004. Documentation for the MARKAL Family of Models. Loulou, R., Remne, U., A. Elbaset, A., Lehtila, A., Goldstein, G., 2005. Documentation for the TIMES
Model PART I.
Mills, G., White, P., 2018. Evaluating the long-term impacts of bus-based park and ride. Res. Transp. Econ., Competition and Ownership in Land Passenger Transport (selected papers
from the Thredbo 15 conference) 69, 536–543.
https://doi.org/10.1016/j.retrec.2018.07.028 National Grid, 2018. National Grid - Future Energy Scenarios.
Pennock, S., Gill, S., Bell, K., 2016. The Scottish Electricity Dispatch Model, in: 2016 13th International Conference on the European Energy Market (EEM). Presented at the 2016 13th International Conference on the European Energy Market (EEM), pp. 1–5. https://doi.org/10.1109/EEM.2016.7521297
Pudjianto, D., Djapic, P., Aunedi, M., Gan, C.K., Strbac, G., Huang, S., Infield, D., 2013. Smart control for minimizing distribution network reinforcement cost due to electrification. Energy Policy, Special Section: Transition Pathways to a Low Carbon Economy 52, 76–84. https://doi.org/10.1016/j.enpol.2012.05.021
GOV.UK, 2015. Road traffic forecasts 2015 [WWW Document]. URL
https://www.gov.uk/government/publications/road-traffic-forecasts-2015 (accessed 2.12.18).
Sanchez-Miralles, A., Gomez San Roman, T., Fernandez, I., Calvillo, C., 2014. Business Models Towards the Effective Integration of Electric Vehicles in the Grid. IEEE Intell. Transp. Syst. Mag. 6, 45–56. https://doi.org/10.1109/MITS.2014.2329327
SPEN, 2018. RIIO T2 Energy Scenarios Consultation [WWW Document]. SPEnergyNetworks. URL https://www.spenergynetworks.co.uk/pages/riio_t2_energy_scenarios_consultation.asp x (accessed 11.20.18).
Su, J., Lie, T.T., Zamora, R., 2019. Modelling of large-scale electric vehicles charging demand: A
New Zealand case study. Electr. Power Syst. Res. 167, 171–182.
https://doi.org/10.1016/j.epsr.2018.10.030
Toyota, 2019. Prius | Overview & Features | Toyota UK [WWW Document]. URL https://www.toyota.co.uk/new-cars/prius/ (accessed 1.29.19).
UCL, 2014. UKTM-UCL [WWW Document]. URL
http://www.ucl.ac.uk/energy-models/models/uktm-ucl (accessed 3.12.18).