Predicting wind-driven rain catch ratios in building simulation
using machine learning techniques
Ioanna Vrachimi, Daniel C´
o
stola
University of Strathclyde, Glasgow, United Kingdom
Abstract
Wind-driven rain catch-ratios are an important boundary condition for the study of the hygrothermal behaviour and durability of building envelopes. Mea-surements are time-consuming, expensive and of lim-ited applicability to other facades of other buildings and sites. CFD simulations are accurate, but time consuming and simplified calculation have large un-certainty. This work focuses on improving the use of WDR catch-ratios in building simulation using artifi-cial neural networks (ANNs). Results obtained indi-cate that an ANN can predict WDR catch-ratio with an uncertainty of ±0.07 for a confidence interval of 95%. ANNs have the ability to combine results from multiple experiments/simulations to provide catch-ratios at any position at the fa¸cade and extrapolate them to a range of fa¸cade’s aspect ratios.
Introduction
[image:1.595.313.537.269.340.2]There is a strong integration between data driven models and building performance simulation in recent years (Amasyali and El-gohary (2018)). Historically, this has been done with regression analysis and the present work is part of a larger project that evaluates opportunities to use more comprehensive machine learning techniques to im-prove the quality of data driven models in building performance simulation. Previous instances of this work were on wind pressure coefficient for isolated and non-isolated low-rise buildings (Vrachimi et al. (2017)). This one is expanding this work in direction of other phenomena, in this case wind driven rain (WDR), while other phenomena will be addressed by the project at later stages (e.g. convective heat and mass transfer coefficients, sky temperature models). Indoor air quality and occupant’s perception of it largely depends on indoor humidity. Thus, in the building physics area, moisture-associated problems have become an important subject. Numerical heat-air-moisture (HAM) transfer models are increasingly being used to study the hygrothermal performance
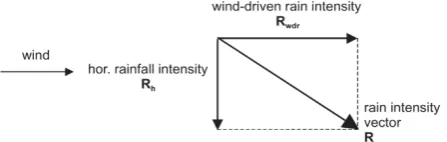
Figure 1: Rain intensity vector R and its components: Wind-driven rain intensityRwdrand horizontal rain-fall intensity Rh (Blocken and Carmeliet (2004))
of building facades. Accurate HAM-transfer analyses require adequate boundary conditions. Typically, the input of HAM models comprises of a standard meteorological data record (containing air tempera-ture, relative humidity, solar radiation, cloud factor, reference wind speed, wind direction and horizontal rainfall intensity) from which the specific boundary conditions are calculated. Although most boundary conditions can be quite adequately described for HAM-transfer analysis, there is at least one that is still considered to be problematic: wind driven rain (Blocken and Carmeliet (2007)).
WDR is considered to be one of the most important moisture sources affecting building envelopes and during the last twenty years, research has been conducted around this. The aim of those studies lies in the evaluation of one parameter, the catch ratio, which links the unobstructed horizontal rainfall intensity to the WDR intensity on the building as shown in Figure 1 (Blocken and Carmeliet (2004)) and defined in equation 1.
ηd(d, t) =
Rwdr(d, t)
Rh(d, t)
, η(t) =Rwdr(t) Rh
(1)
Rwdr(d, t) and Rh(d, t) are the specific WDR
in-tensity and specific unobstructed horizontal rainfall intensity for raindrops with diameterd. Rwdr(t) and
Rh(t) respectively, refer to the same quantities but
This WDR catch ratio can be evaluated with on-site measurements, semi-empirical models and numerical simulations. Measurements are expensive and they considerably take more time than semi-empirical models. Secondary sources are largely used to obtain WDR catch-ratio as they are inexpensive and straightforward. The most widely used models are the Straube and Burnett (S&B) model (Straube and Burnett (2000)), ISO Standard (ISO (2009)) and the Computational Fluid Dynamics (CFD) model by Choi (1993) further developed by Blocken and Carmeliet (2002); Blocken et al. (2007). ISO Standard and S&B model are defined by equations 2 and 3 respectively, below.
Rwdr=
2
9 CRCT O W U10R 0.88
h cosθ (2)
Rwdr=DRF ×RAF ×U(z) ×Rh ×cosθ (3)
where CR is the roughness coefficient, CT is the
topography coefficient, O is the obstruction factor, W is the wall factor, U10 is the reference wind speed at 10m height in the upstream undisturbed flow (m/s), R0h.88 is the horizontal rainfall intensity (mm/h or L/m2) and θ is the angle between the wind direction and the normal to the fa¸cade. For equation 3, DRF is the driving rain function, RAF is the rain admittance factor,U(z) is the mean wind velocity vector (m/s), Rh is the horizontal rainfall intensity (mm/horL/m2) and θ is the same as the previous equation. Both models have been described and compared in detail by Blocken and Carmeliet (2010).
A comparison of the two semi-empirical models shows that the S&B model provides information for three building fa¸cade geometries whereas the ISO Standard model provides for six. A relatively low number for both models considering the number of different fa¸cade geometries that can exist. The S&B model though brings up the independence of building and scale for RAF values. Regarding the two models and the position on the fa¸cade they have two different approaches. The ISO Standard model provides wall factors (W) across different points on fa¸cade, but no more than nine for a three-storey building. On the other hand, the S&B model provides contour graphs with maximum and minimum RAF values. Although the two parameters define the same thing, the ratio of the WDR intensity on the fa¸cade to the free-field WDR intensity, they don’t share the same values at some fa¸cade positions (Blocken and Carmeliet (2010)). The use of considerably simplified WDR intensity and therefore WDR catch-ratio has major limitations and may incur in high error in the hygrothermal behaviour of building facades (Abuku et al. (2009)).
Artificial Neural Networks (ANNs) have shown successful results in a variety of fields, such as banking (Tavana et al. (2017)), ocean engineering
(Seyedashraf et al. (2017)), microelectronics (Khera and Khan (2017)), human science (Aram et al. (2017)), agriculture (Elnesr and Alazba (2017)), thermal comfort (von Grabe (2016)) and particularly on applications related to building performance and physics (Deb et al. (2016); Kumar et al. (2013); Magalh˜aes et al. (2017); Melo et al. (2014)). The same approach will be used for this work as well. In terms of WDR catch ratio data, available data at the Heat Air Moisture Finite Element Method (HAMFEM) program (Janssen (2000)) and data from a CFD simulation (Choi (1994)) will be used. The user has to manually choose the fa¸cade in the database with the closest aspect ratio to the fa¸cade under analysis, as the linear interpolation algorithm has no means to extrapolate results for new fa¸cade aspect ratios from the existing datasets. This was one of the first attempts to implement CFD simulation results in heat-air-moisture (HAM) software (Blocken et al. (2007)). Based on the above, the present paper describes an investigation on modelling WDR catch ratios using ANN and the reference data from HAMFEM and CFD simulations.
Methodology
This section describes the reference data from CFD simulations and HAMFEM program used in the anal-ysis, the use of the data in the quantification of the uncertainty in ISO Standard and S&B model and the development of ANN to calculate WDR catch ratio based on the reference data.
Reference data
This work relies on two datasets both originally devel-oped using CFD simulations. The first dataset is pro-vided by HAMFEM program (Janssen (2000)), origi-nally developed by Blocken and Carmeliet (2007) and the second one on data from Choi (1994).
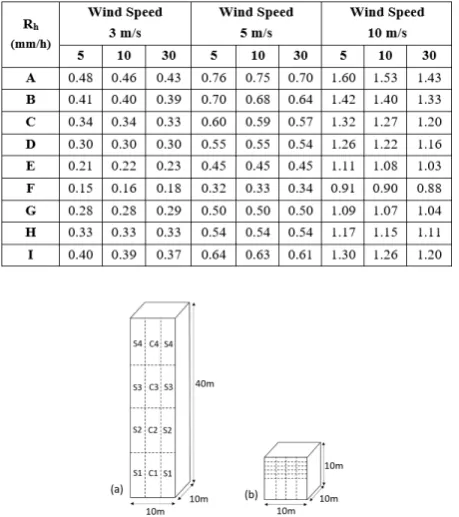
Table 1: Catch ratios for various horizontal rainfall intensities as obtained by (Choi (1994))
20 and 30 m/s, at 250 m height, and horizontal rain-fall intensities of 10, 30 and 50 (mm/h). HAMFEM dataset was originally developed using CFD simula-tions and shows catch ratio data at the local position of analysis on the fa¸cade. The model available from HAMFEM program as shown in Figure 2(b) shows a building with 10m height with the same cross sec-tion area as the previous model, i.e. 10m by 10m. The reference data has been tested for 9 wind speeds (from 0 m/s up to 10 m/s) and for 16 horizontal rain fall intensities (from 0 mm/h to 30 mm/h) result-ing in a total of 4861 entries from both data. Table 2 shows sample data available from HAMFEM and Figure 3 shows the cubic sized model’s facade which was divided into 40 areas. Assuming that both, the building and the flow are symmetrical, 9 areas named from A to I as shown in Figure 3, have been chosen from one side of the cube as sample data to be pre-sented in Table 2. Training and validation of ANN has been done using the above data.
Table 2: Sample data of catch ratios from HAMFEM dataset for various horizontal rainfall intensities as obtained by (Blocken et al. (2007))
[image:3.595.114.226.648.757.2]Figure 2: Models’ geometric parameters
Figure 3: Facade sections of HAMFEM
ISO Standard and S&B model
As ISO Standard and S&B semi-empirical models are the most common sources of WDR data. The two calculation models are applied to the high-rise and cubic reference buildings. In the ISO model,CR
is calculated based on equations 4 and 5 below, and terrain category I, with KR = 0.17, z0 = 0.01 and
zmin = 2.
CR(z) =KRln(
z z0
)f or z≥zmin (4)
CR(z) =CR(zmin)f or z < zmin (5)
CT andO, based on this case, are both considered to
be 1 based on tables in Blocken and Carmeliet (2010). The wall factorW is chosen based on the information in the Standard depending on the building size, shape and height of point of interest with values of 0.2, 0.3, 0.4 and 0.5.
For the S&B model, the RAF data provided for fa-cades only includes aspect ratios of H W, or W H. Strictly speaking, the S&B model cannot be applied for the cubic model Figure 2(b) but because this model is applied in practice for cubic buildings, it will also be applied here. For this work, W H is used for the cubic model and RAF data used for both models are 0, 0.5, 0.8 and 1.
Figure 4 shows the catch ratios on the windward facades of the two building models estimated by the semi-empirical models and compares them to the ref-erenced data produced by CFD for three Rh values.
ANNs for WDR catch ratio
The modelling of the neural networks for this work has been done using the statistical package R and the ‘neuralnet’ package (Fritsch et al. (2016)). The neural networks in this package are feed-forward trained and focuses on multi-layer perceptrons (MLP) (G¨unther and Fritsch (2010)). MLP is a neural network with input and output layers and one or more hidden lay-ers between them. The training and validation data was randomly separated by R to 80% and 20% re-spectively. Five input parameters were used for the creation of the neural network: the x coordinate, the y coordinate of the point on building’s fa¸cade, the as-pect ratio of the fa¸cade, wind speed and horizontal rain intensity.
Several configurations of ANN were investigated to define the best number of hidden layers and neurons in each layer with the chosen one shown in Figure 5. The log sigmoid function as shown in equation 6, has been used in all configurations of the ANN to ensure that the output signal of each node is smooth and as stated by Duch and Jankowski (1999) and Widrow and Lehr (1990) is the most appropriate for this ap-plication
s(x) = 1/(1 +e−x) (6)
Figure 4: Comparison of wind-driven rain catch ra-tios for the two datasets, as obtained by three models (reference data, ISO, S&B) for three different hori-zontal rainfall intensities
itself.
The input and output data of the ANN were normalised within the same boundaries as the activation function which is the sigmoid function in this case between 0 and 1 (Guoqiang Zhang et al. (1998)). Validation is a critical aspect of any model construction and therefore only the validation results were included in the graphs of ANN predictions compared to HAMFEM database values. The comparison between the HAMFEM WDR catch ratio values data and the ANN results was analysed based on the RMSE, which was used to calculate confidence intervals based on the same criterion and assumptions listed in the previous section. The frequency of errors between the HAMFEM database and the neural network results was also analysed using histograms.
Figure 5: Artificial Neural Network Layout
Results and Discussion
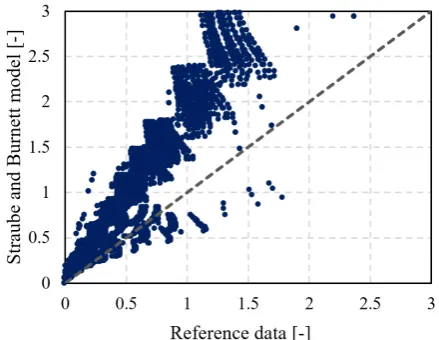
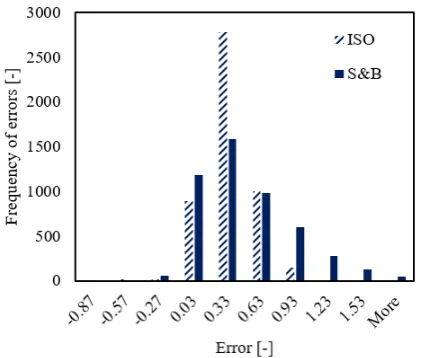
Figures 6 and 7 show a comparison for each data entry between the reference data and the two existing data sources of WDR catch ratio used in building simulations. These figures show symmetry plots where reference data is on x-axis and the ISO and S&B data on y-axis. In both cases, the state of the art data fails to capture the complexity of WDR catch ratio distribution in the models. This can be better quantified through the histograms in Figure 8 which show the frequency of errors. Errors are comparable for both data sources and vary from -0.37 to +1.87, which is on similar order of magnitude of WDR catch ratio data (varies from 0 to +2.3 in this dataset). Assuming a normal distribution of errors, the calculated confidence intervals of ISO and S&B data are ±0.56 and ±1.03 respectively for a confidence level of 95%. Due to the fact that S&B model provides maximum and minimum RAF values, for comparison purposes the average value between the two is used in this case.
Figure 6: Symmetry plot of reference data of reference data compared to Straube and Burnett model
[image:4.595.313.533.552.722.2]WDR data from the reference data. ANN results have good agreement, particularly in comparison to data in Figures 6 and 7 (which represent the best practice in terms of WDR data using semi-empirical sources). The best setting for the ANN comprises two hidden layers with 5 and 3 nodes respectively (Figure 5). The frequency of errors (calculated based on the method outlined earlier) is shown in Figure 10. Predictions using this set of ANN have a confidence interval of
[image:5.595.316.530.73.252.2]±0.07 (RMSE=0.036) for a confidence level of 95%. Table 3 includes all the weights and biases extracted from the trained ANN which shows the effect of wind speed and horizontal rainfall intensity on the ANN output. The closer to 0 the weights are the less or no effect they have on the WDR catch-ratios.
Figure 7: Symmetry plot of reference data of reference data compared to ISO Standard model
Figure 8: Histogram of errors in WDR catch ratio calculations for ISO Standard and S&B model
Conclusions
[image:5.595.63.283.275.436.2]This work described the development of artificial neu-ral networks for the prediction of wind-driven rain catch-ratios. As main objective of this work, is the use of machine learning in building simulation which in this case is wind-driven rain catch-ratios. The con-clusions drawn based on the results presented are:
Figure 9: Symmetry plot of reference data of reference data compared to ANN
Figure 10: Histogram of errors in ANN calculations of reference data from CFD and HAMFEM compared to ANN
• The trained and tested artificial neural networks using the reference data from CFD simulations and Heat Air Moisture Finite Element Method program showed that wind-driven rain catch ra-tios can be predicted with ±0.07 confidence in-terval for a confidence level of 95%.
• One artificial neural network per wind speed or horizontal rainfall intensity could possibly be considered for further work as weights and biases indicate their effect on the results.
• A neural network with 2 hidden layers with 5 and 3 nodes respectively showed the best results when compared to other ANN configurations.
Acknowledgment
This research is funded by the University of Strath-clyde and BRE Trust. Their financial contribution is greatly acknowledged.
References
[image:5.595.315.528.290.445.2] [image:5.595.66.277.471.650.2]numeri-Table 3: Weights and biases of the ANN
cal simulations. Journal of Wind Engineering and Industrial Aerodynamics 97(5-6), 197–207.
Amasyali, K. and N. M. El-gohary (2018). A review of data-driven building energy consumption predic-tion studies.Renewable and Sustainable Energy Re-views 81(April 2017), 1192–1205.
Aram, Z., S. Jafari, J. Ma, J. C. Sprott, S. Zen-dehrouh, and V. T. Pham (2017). Using chaotic artificial neural networks to model memory in the brain. Communications in Nonlinear Science and Numerical Simulation 44, 449–459.
Best, A. C. (1950). The size distribution of raindrops.
Quarterly Journal of the Royal Meteorological So-ciety 76(327), 16–36.
Blocken, B. and J. Carmeliet (2002, oct). Spatial and temporal distribution of driving rain on a low-rise building, Volume 5.
Blocken, B. and J. Carmeliet (2004). A review of wind-driven rain research in building science. Jour-nal of Wind Engineering and Industrial Aerody-namics 92(13), 1079–1130.
Blocken, B. and J. Carmeliet (2007). On the errors as-sociated with the use of hourly data in wind-driven rain calculations on building facades. Atmospheric Environment 41(11), 2335–2343.
Blocken, B. and J. Carmeliet (2010). Overview of three state-of-the-art wind-driven rain assessment models and comparison based on model theory.
Building and Environment 45(3), 691–703.
Blocken, B., S. Roels, and J. Carmeliet (2007). A combined CFD-HAM approach for wind-driven rain on building facades. Journal of Wind Engi-neering and Industrial Aerodynamics 95(7), 585– 607.
Choi, E. C. C. (1993, jan). Simulation of wind-driven-rain around a building. Computational Wind En-gineering 1, 721–729.
Choi, E. C. C. (1994). Determination of wind-driven-rain intensity on building faces. Journal of Wind Engineering and Industrial Aerodynamics 51(1), 55–69.
Deb, C., L. S. Eang, J. Yang, and M. Santamouris (2016). Forecasting diurnal cooling energy load for institutional buildings using Artificial Neural Net-works. Energy and Buildings 121, 284–297.
Duch, W. and N. Jankowski (1999). Survey of neural transfer functions. Neural Computing Surveys 2, 163–212.
Elnesr, M. and A. Alazba (2017). Simulation of wa-ter distribution under surface dripper using artifi-cial neural networks.Computers and Electronics in Agriculture 143(October), 90–99.
Fritsch, S., F. Guenther, M. Suling, and S. M. Mueller (2016). Training of neural networks. Package ’neu-ralnet’. The R project for statistical computing. pp. 13.
G¨unther, F. and S. Fritsch (2010). neuralnet: Train-ing of Neural Networks. The R Journal 2(1), 30– 38.
Guoqiang Zhang, B. Eddy Patuwo, and Michael Y. Hu (1998). Forecasting with artificial neural net-works: The state of the art. International Journal of Forecasting 14, 35–62.
ISO (2009). Hygrothermal performance of buildings – calculation and presentation of climatic data – Part 3: calculation of a driving rain index for ver-tical surfaces from hourly wind and rain data.e. In-ternational Organization for Standardization (ISO 2009;15927-3).
[image:6.595.59.538.91.256.2]Khera, N. and S. A. Khan (2017). Prognostics of alu-minum electrolytic capacitors using artificial neu-ral network approach. Microelectronics Reliabil-ity (October), 0–1.
Kumar, R., R. K. Aggarwal, and J. D. Sharma (2013). Energy analysis of a building using artificial neural network: A review. Energy and Buildings 65, 352– 358.
Magalh˜aes, S. M., V. M. Leal, and I. M. Horta (2017). Modelling the relationship between heating energy use and indoor temperatures in residential build-ings through Artificial Neural Networks consider-ing occupant behavior. Energy and Buildings 151, 332–343.
Melo, A. P., D. C´ostola, R. Lamberts, and J. L. M. Hensen (2014). Development of surrogate models using artificial neural network for building shell en-ergy labelling. Energy Policy 69, 457–466.
Seyedashraf, O., A. Rezaei, and A. A. Akhtari (2017). Dam break flow solution using artificial neural net-work. Ocean Engineering 142(June 2016), 125– 132.
Straube, J. and E. Burnett (2000). Simplified prediction of driving rain deposition. Proceed-ings of the international Building Physiscs Confer-ence (February), 375–382.
Tavana, M., A.-R. Abtahi, D. Di Caprio, and M. Poortarigh (2017). An Artificial Neural Net-work and Bayesian NetNet-work model for liquidity risk assessment in banking.Neurocomputing 275, 2525– 2554.
von Grabe, J. (2016). Potential of artificial neural networks to predict thermal sensation votes. Ap-plied Energy 161, 412–424.
Vrachimi, I., A. P. Melo, and D. C´ostola (2017). Pre-diction of wind pressure coefficients in building en-ergy simulation using machine learning. Proceed-ings of International Building Performance Simu-lation Association Conference (September), 2334– 2341.