_____________________________
a)[email protected] b)
Optimization of gas-filled quartz capillary discharge waveguide for
high-energy laser wakefield acceleration
Zhiyong Qin1,2, Wentao Li1,3,a), Jiansheng Liu1,4,b), Jiaqi Liu1,2, Changhai Yu1,
Wentao Wang1, Rong Qi1, Zhijun Zhang1, Ming Fang1,2, Ke Feng1,2, Ying Wu1,2,
Lintong Ke1,2, Yu Chen1,2, Cheng Wang1, Ruxin Li1,4,5, and Zhizhan Xu1,4,5
1State Key Laboratory of High Field Laser Physics, Shanghai Institute of Optics and Fine Mechanics, Chinese Academy
of Sciences, Shanghai 201800, China
2University of Chinese Academy of Sciences, Beijing 100049, China
3 Department of Physics, SUPA and University of Strathclyde, Glasgow G4 0NG, United Kingdom
4 Collaborative Innovation Center of IFSA (CICIFSA), Shanghai Jiao Tong University, Shanghai 200240, China
5 School of Physics Science and Technology, ShanghaiTech University, Shanghai 200031, China
A hydrogen-filled capillary discharge waveguide made of quartz is presented for high-energy laser wakefield acceleration (LWFA). The experimental parameters (discharge current and gas pressure) were optimized to mitigate ablation by a quantitative analysis of the ablation plasma density inside the hydrogen-filled quartz capillary. The ablation plasma density was obtained by combining a spectroscopic measurement method with a calibrated gas transducer. In order to obtain a controllable plasma density and mitigate the ablation as much as possible, the range of suitable parameters was investigated. The experimental results demonstrated that the ablation in the quartz capillary could be mitigated by increasing the gas pressure to ~7.5–14.7 Torr and decreasing the discharge current to ~70–100 A. These optimized parameters are promising for future high-energy LWFA experiments based on the quartz capillary discharge waveguide.
I. INTRODUCTION
In recent years, laser wakefield acceleration (LWFA)1-10 has attracted considerable attention owing to
high-quality tunable monoenergetic electron beams with low energy spread, low divergence angle, and high brightness have been produced4,5,16 by supersonic helium or hydrogen gas jets, the high energy gain
remains a severe challenge for LWFA8. Previous experiments have demonstrated that a plasma channel,
produced by a several-centimeter-long capillary discharge waveguide2,7,8, can effectively achieve
multi-GeV energy acceleration17,18.
Two kinds of capillary discharge waveguides, ablative capillary19-21 and gas-filled capillary2,22,23, have
been used to generate such plasma channels24. Ablative capillaries are commonly made of organic
materials with a low melting point (~130°C), such as polyethylene (CH2)n and polyacrylate. Their structure
is simple and easily obtained by mechanical processing. However, the lifetime of these capillaries is greatly affected by the erosion of their inner wall material during the discharge process, leading to low stability and low repeatability. Compared with the ablative capillary with a simple structure, the gas-filled discharge capillary is more complex as gas is injected inside. However, gas-filled capillary waveguides have significant advantages, such as good discharge stability, adjustability of the plasma density, and long device lifetime. In addition, for hydrogen-filled capillaries, the gas can be fully ionized to minimize the spectral or temporal distortion of the guided laser pulse.
Owing to these advantages, gas-filled capillaries have been widely used in LWFA experiments. In these experiments2,5,7, in order to avoid ablation to a certain extent, high melting point materials, such as
sapphire and diamond, are used to manufacture gas-filled capillaries. The melting point of these materials are ~2000–3500°C; thus, they are much harder to be ablated compared with organic materials. In addition, the high thermal conductivity and thermal shock resistance of these materials also protect the capillary from the ablation and thermal shock of the high-power laser25. However, compared with an ablative
capillary, the fabrication of a gas-filled capillary is exceedingly complicated. Gas-filled capillaries generally consist of two sapphire or diamond plates, each with a laser-machined half-cylindrical groove on its surface. When the grooves are aligned to form the channel, it is necessary for the two plates to be sealed perfectly to avoid leakage and deformation. This becomes more difficult if a long channel, such as one on the scale of meters, is needed.
of quartz as an alternative. Unlike the capillary comprised of two plates, a high-quality quartz capillary can be fabricated directly like a fiber drawing, and the fabrication of a long quartz capillary is not complicated. The drawback of using quartz is that its melting point (~1200°C) and thermal conductivity are lower than those of sapphire and diamond, which indicates that it can be ablated easier by the same discharge current. In order to mitigate the ablation, obtain a controllable plasma density in the hydrogen-filled capillary, and apply it to LWFA, we analyzed the ablation quantitatively by measuring the ablation plasma (AP) density during the discharge process, and obtained suitable discharge current range and gas pressure ranges. The measurement of the AP density was performed by combining a spectrometer with a calibrated gas transducer5. The total plasma density was measured by the Stark broadening method26-28
using a spectrometer and the injected gas plasma (GP) density can be obtained from the gas transducer by detecting the gas pressure inside the capillary. Then, the AP density can be calculated by subtracting the GP density from the total plasma density when the gas in the capillary is completely ionized and the ablation has occurred.
This paper is organized as follows. In Sec. II, we mainly lay out the experimental setup, including the capillary discharge system, single-point plasma density measurement system and gas pressure calibration system. We also investigate the axial distribution of the plasma density by the single-point plasma density measurement system. In Sec. III, the ablation occurred in quartz capillary is determined and the parameters (discharge current and gas pressure inside the capillary) that influence the ablation are investigated by measuring the AP density. In order to mitigate the ablation in the quartz capillary and obtain a controllable plasma density, the suitable parameters ranges are optimized in this section. Finally, the conclusions are given in Sec. IV.
II. EXPERIMENTAL SETUP
A. Hydrogen-filled capillary discharge system
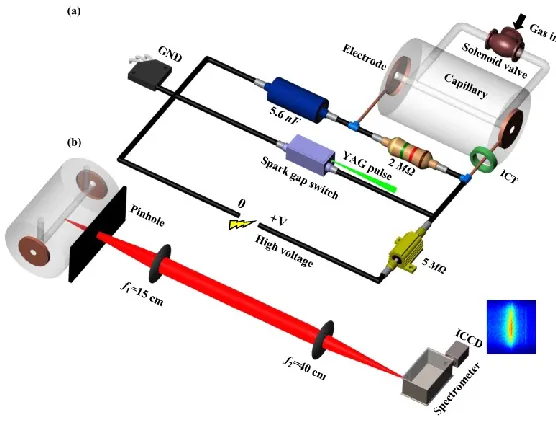
The schematic diagram of the gas-filled capillary discharge system is shown in Fig. 1(a), where a 500-m-diameter and 6-cm-long transparent quartz capillary is used and placed in a vacuum chamber
evacuated below 10−4 Torr in experiments. The capillary was filled with hydrogen gas via two
between 1.9 Torr to 21.0 Torr for a duration of ~120 ms by a valve controller (Parker) and triggered by a digital delay generator (DDG, DG-535). A 5.6-nF capacitor was charged to high voltages up to 25 kV to produce different discharge currents for plasma generation. A spark gap switch driven by a Nd:YAG laser pulse was triggered by the DDG and switched on the discharge circuit. The discharge current was recorded by an integrating current transformer (ICT) and the current profile was acquired by an oscilloscope (Tektronix-MDO3104).
FIG. 1. (Color Online) Overall layout of the experiments. (a) Schematics of the discharge circuit of the gas-filled capillary system and (b) experimental setup for the single-point density evolution measurement system based on a spectroscopic method.
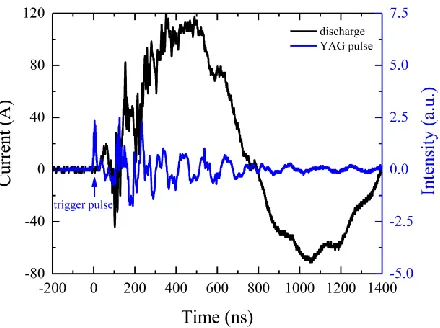
[image:4.612.166.444.200.413.2]FIG. 2. (Color Online) Typical discharge current evolution profile (black curve) and the YAG pulse (blue curve) detected by the phototube.
B. Single-point plasma density measurement
To investigate the plasma density in the hydrogen-filled quartz capillary, we first measured the single-point plasma density by a spectrometer in the cross direction, as shown in Fig. 1(b). The discharge arc light passing through a 1-mm pinhole was collected transversely by two lenses (f1=15 cm and f2=40 cm)
and transferred into the entrance slit (10 m) of the gated spectrometer (grating of 1200 lines/mm) at different gate delays. The spectrometer is equipped with an intensified charge-coupled device (ICCD, Andor iStar 303i), and the width of the gate pulse for data acquisition was 20 ns. The gate delay, varied in the range of 160–1200 ns in our experiments, was the time interval between the trigger pulse and the gate pulse and set by the DDG. The instrumental line broadening26 of the spectrometer was approximately
0.3 nm. The width of the H spectral line of hydrogen at different gate delays and different gas pressures
can be measured, and the plasma density can be further obtained by the formula26,29 𝑛
𝑒[𝑐𝑚−3] = 8.02 ×
1012(10 × ∆𝜆
𝑆𝑡𝑎𝑟𝑘[𝑛𝑚] 𝛼⁄ )3 2⁄ , where is an experimental parameter and can be chosen as27 1.8 × 10⁻² for 1017cm−3 and 2.2 × 10⁻² for 1018cm−3.
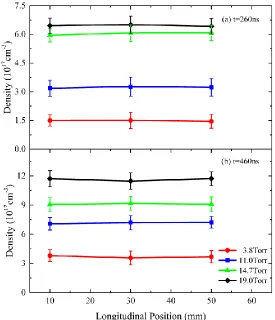
[image:5.612.198.418.44.208.2]capillary is uniform along the axis.
FIG. 3. (Color Online) Plasma density distribution along the on-axis of the capillary as a function of the longitudinal position for different gas pressures at a discharge current of 100 A and gate delay of (a) 260 ns and (b) 460 ns.
C. Calibration with the gas transducer
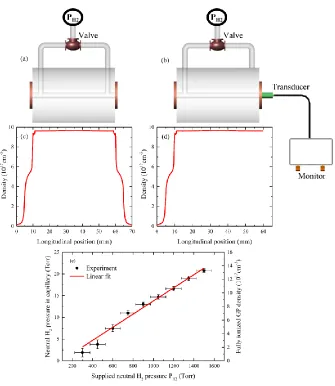
In order to obtain the GP density in the capillary accurately, it is necessary to determine the gas pressure inside the capillary. A continuous-flow controller at pressure PH2was used to supply H2 gas into the
capillary with a duration of ~120 ms. A gas transducer (EPIH, Measurement Specialties) was used to calibrate the gas pressure inside the capillary when the specific pressure PH2was supplied. The layout for
[image:6.612.167.442.88.408.2]dynamics simulations in Figs. 4(c)–(d) indicate that under the same PH2, the gas pressure between the two
slots in Fig. 4(a) is identical to that between the slot and the transducer in Fig. 4(b) when the equilibration state is achieved. In our experiments, the duration of the gas supply is sufficient to achieve equilibrium. Furthermore, Figs. 4(c)–(d) show that the plasma density in Figs. 4(a)–(b) is uniform along the axis inside the capillary, which is in agreement with the experimental results in Fig. 3. The relationship between the supplied gas pressure PH2 and the pressure inside the capillary in equilibrium is nearly linear within a 95%
confidence level, as shown in Fig. 4(e). The GP density, shown in Fig. 4(e), is the fully ionized plasma density of hydrogen and can be determined by the gas pressure inside the capillary.
[image:7.612.140.475.242.628.2]III. EXPERIMENTAL RESULTS AND DISCUSSION
In this section, by measuring the plasma density, we first determined that the ablation occurred in the quartz capillary at different discharge currents and gas pressures. Then the influence of the discharge current and gas pressure on the ablation was also investigated in subsection A. Once the ablation occurred in the quartz capillary, the plasma density distribution would be uncontrollable and the life time of the quartz capillary would also be affected. Therefore, in order to obtain a controllable plasma density distribution, the ablation in the capillary should be avoided or mitigated, which was investigated in subsection B.
A. The influence of the discharge current and gas pressure on the ablation
After obtaining the gas pressure inside the capillary, to determine whether the ablation occurred in the capillary, the ionization degree, 𝐷𝑖𝑜𝑛 = 𝑛𝑡𝑜𝑡𝑎𝑙⁄𝑛𝑓𝑢𝑙𝑙 𝐺𝑃, was introduced; where 𝑛𝑡𝑜𝑡𝑎𝑙 is the total plasma density and 𝑛𝑓𝑢𝑙𝑙 𝐺𝑃 is the fully ionized GP density. The fully ionized GP density 𝑛𝑓𝑢𝑙𝑙 𝐺𝑃 can be determined from the gas pressure measured by the calibrated gas transducer, as shown in Fig. 4(e), and the total plasma density 𝑛𝑡𝑜𝑡𝑎𝑙 can be measured by the spectrometer. Therefore, by using the experimental setup shown in Fig. 2(b) to measure the single-point plasma density, the ionization degree
𝐷𝑖𝑜𝑛 can be obtained from experiments; note that if 𝐷𝑖𝑜𝑛 > 1, the ablation occurred in the capillary. As
the plasma density is always uniform along the capillary, as shown in Fig. 3, in the following experiments, for consistency, we investigated the plasma density only at the center of the capillary.
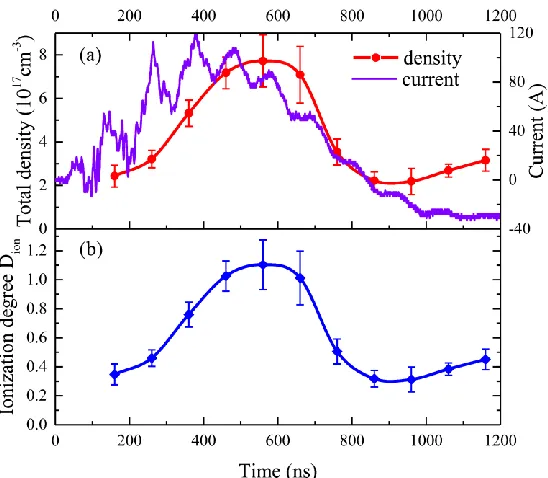
Fig. 5 shows a typical evolution of the plasma density and the corresponding ionization degree under the condition of 11.0 Torr (7.0×1017 cm−3) in the capillary and a peak discharge current of 100 A. The
total plasma density (red curve) evolution is similar to the discharge current evolution profile (violet curve), with its peak delayed by 120 ns compared with that of the discharge current22,30. The ionization degree 𝐷𝑖𝑜𝑛 (blue curve) achieves 1.0 as the discharge current increases to a maximum of 100 A at a time delay of ~440 ns. Following that, the discharge current begins to decrease, while the plasma density and the ionization degree increase further and achieve their maximum (𝐷𝑖𝑜𝑛 = 1.1) at a time delay of 560 ns. Then,
hydrogen-filled quartz capillary in the time delay range of 440–660 ns under the conditions of a 100-A discharge current and 11.0-Torr gas pressure. The extra plasma density is attributed to the erosion of the inner wall of the quartz capillary.
FIG. 5. (Color Online) Measured single-point total plasma density (a) and the corresponding ionization degree evolution (b) at a peak discharge current of 100 A and gas pressure of 11.0 Torr inside the capillary.
To further investigate the ablation in the quartz capillary quantitatively, two parameters, known as ablation rate and ablation intensity, were introduced to measure the ablation in the capillary at different discharge currents and gas pressures. The ablation rate 𝑅𝑎𝑏𝑙𝑎 was defined as 𝑅𝑎𝑏𝑙𝑎 = 𝑛𝐴𝑃⁄𝑛𝑡𝑜𝑡𝑎𝑙 and
the ablation intensity was the intensity of the spectral line of the element silicon (634.7 nm) in the quartz capillary.
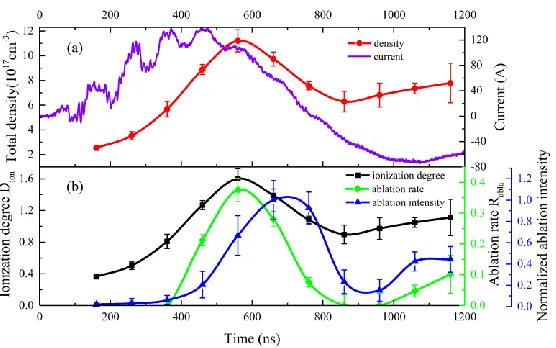
[image:9.612.170.444.128.367.2]quartz capillary intensely affects the plasma density distribution and cannot be neglected at 120 A. Compared with the case of 100 A, shown in Fig. 5, the hydrogen-filled quartz capillary tends to be more strongly ablated in the case of a higher discharge current.
FIG. 6. (Color Online) Measured single-point total plasma density (a) and the corresponding ionization degree (black curve), the ablation rate (green curve) and the normalized ablation intensity (blue curve) evolution (b). The discharge current and gas pressure inside the capillary are 120 A and 11.0 Torr, respectively.
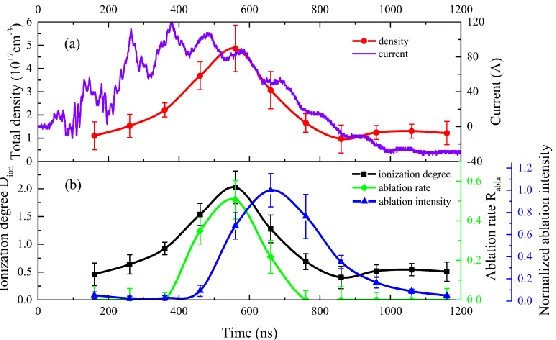
In addition, to investigate whether the ablation is related to the gas pressure in the capillary, we decreased the gas pressure inside the capillary from 11.0 Torr to 3.8 Torr (2.36×1017 cm−3) while
[image:10.612.168.446.130.304.2]FIG. 7. (Color Online) Measured single-point total plasma density (a) and the corresponding ionization degree (black curve), the ablation rate (green curve) and the normalized ablation intensity (blue curve) evolution (b) at a discharge current of 100 A and gas pressure of 3.8 Torr (2.36×1017 cm−3).
Therefore, it can be concluded that the ablation is strongly influenced by the discharge current and gas pressure inside the capillary and it becomes stronger with higher the discharge current and lower the gas pressure. This conclusion, as we suspect, can be explained as follows: the hydrogen inside the capillary under low gas pressure and high discharge current can be ionized completely by taking only a small portion of the discharge energy, but the remaining discharge energy is used to ablate the inner wall of the capillary. Once the ablation occurred, the lifetime of the quartz capillary and the plasma density distribution in it will be affected. Therefore, to obtain a controllable plasma density distribution, it is essential for the ablation to be avoided or mitigated by choosing suitable discharge current and gas pressure conditions inside the capillary.
B. Mitigation of the ablation in quartz capillary discharge waveguide
[image:11.612.169.447.49.219.2]11.0 Torr (7.0×1017 cm−3), 14.7 Torr (9.4×1017 cm−3), and 19.0 Torr (1.2×1018 cm−3)) were measured,
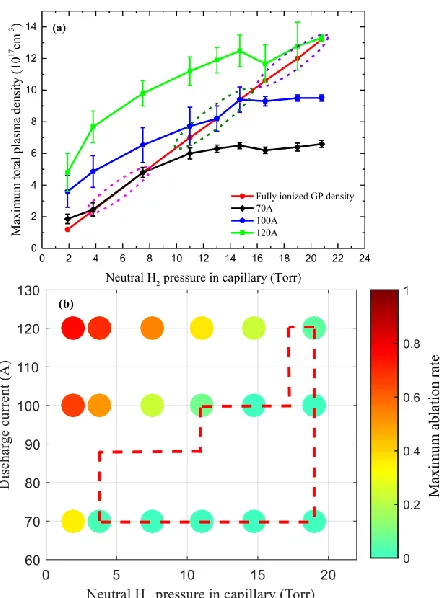
and the results are shown in Fig. 8. Furthermore, in order to make the conclusions more intuitive, we also summarized the maximum total plasma density and maximum ablation rate at these different gas pressures, as shown in Figs. 9(a) and 9(b), respectively.
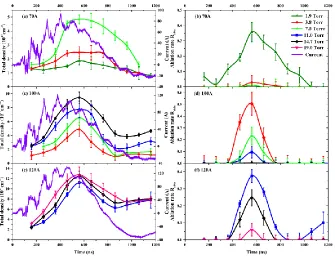
FIG. 8. (Color Online) Single-point plasma density evolution profile for different gas pressures at (a) 70 A, (c)100 A, and (e)120 A, and the corresponding ablation rate profiles (b), (d), and (f).
As shown in Figs. 8(a)–(b), when the discharge current (violet curve) is 70 A, the gas pressures used in experiments are 1.9 Torr (olive curve), 3.8 Torr (red curve), and 7.5 Torr (green curve), respectively. The measured maximum total plasma density is 1.87×1017 cm−3 (1.9 Torr), 2.47×1017 cm−3 (3.8 Torr), and
4.84×1017 cm−3 (7.5 Torr), respectively. The corresponding ablation rates are 0.36, 0.03, and 0.01,
[image:12.612.140.475.153.411.2]total plasma density is equal to the fully ionized GP density (red curve), which means that, in the case of 70 A discharge current, the ablation in the quartz capillary can be neglected in the gas pressure range of ~3.8–8.0 Torr.
When the peak discharge current was increased to 100 A, as shown in Figs. 8(c)–(d), the measured maximum total plasma density in the cases of 3.8 Torr (red curve), 7.5 Torr (green curve), 11.0 Torr (blue curve), and 14.7 Torr (black curve) are 4.86×1017 cm−3, 6.53×1017 cm−3, 7.73×1017 cm−3, and
9.43×1017 cm−3, respectively. The corresponding maximum ablation rates are 0.51, 0.23, 0.09, and 0.00,
respectively. This implies that strong ablation occurs in the capillary in the cases of 3.8 Torr and 7.5 Torr. However, the ablation can be neglected in the cases of 11.0 Torr and 14.7 Torr. Therefore, to obtain controllable plasma density in a quartz capillary at a discharge current of 100 A, the suitable gas pressure values are in the range of 11.0–14.7 Torr. As shown in Fig. 9(a), this suitable gas pressure range in the case of 100 A discharge current can also be obtained by olive dashed ellipse region. It can be found that, in the olive ellipse region, the maximum total plasma density is nearly equal to the fully GP plasma density. Therefore, in the case of 100 A discharge current, the ablation in quartz capillary can be neglected in the gas pressure range of ~11.0–14.7 Torr, and the corresponding maximum plasma density varies in the range of 7.0×10¹⁷–9.4×1017 cm−3.
When the peak discharge current was further increased to 120 A, as shown in Figs. 8(e)–(f), the measured maximum total plasma density in the cases of 11.0 Torr (blue curve), 14.7 Torr (black curve), and 19.0 Torr (pink curve) are 1.12×1018 cm−3, 1.25×1018 cm−3, and 1.27×1018 cm−3, respectively, and
FIG. 9. (Color Online) Summary of the maximum total plasma density (a) and maximum ablation rate (b) occurred in Fig. 8 at different peak discharge currents and different gas pressures inside the capillary. The dashed ellipse in (a) is the suitable gas pressure range inside the capillary at different peak discharge currents (magenta for 70 A, olive for 100 A, and violet for 120 A) for avoiding the ablation. The value of the ablation rate in (b) is indicated by the color bar.
[image:14.612.196.420.44.343.2]“higher” than the peak discharge current, the gas in the capillary is ionized only partially and the total plasma density remains basically unchanged due to the limited discharge energy. Therefore, to obtain a controllable plasma density and maximally avoid ablation in future LWFA experiments based on capillary discharge waveguides, the most suitable peak discharge current and gas pressure ranges are ~70–100 A and ~7.5–14.7 Torr, respectively. With this optimized parameters conditions, the corresponding controllable plasma density is in the range of 5.0×10¹⁷–1.0×1018 cm−3, which is promising for
multi-GeV acceleration.
IV. CONCLUSIONS
We proposed a hydrogen-filled capillary discharge waveguide made of quartz to simplify the fabrication of the gas-filled capillary waveguide used in LWFA experiments. The high-quality quartz capillary is easily available with no strict limit on the length. To avoid the ablation in the quartz capillary during the discharge process, we combined a spectrometer with a calibrated gas transducer to quantitatively measure the ablation plasma density inside the capillary. It was found that the discharge current and gas pressure inside the capillary significantly affect the ablation, which becomes stronger in the quartz capillary with lowering of the gas pressure and increasing the discharge current. In our experiments, the tested suitable peak discharge current range was ~70–100 A and the range of gas pressure inside the capillary was ~7.5–14.7 Torr, corresponding to a controllable plasma density range of 5.0×10¹⁷–1.0×1018 cm−3. These discharge current and gas pressure conditions are promising in future
multi-GeV LWFA experiments based on quartz capillary discharge.
ACKNOWLEDGMENTS
This work was supported by the National Natural Science Foundation of China (Grant Nos. 11425418, 11127901, 61521093, and 11505263) and the Strategic Priority Research Program (B) (Grant No. XDB16), the Shanghai Sailing Program (Grant Nos. 17YF1421100 and 18YF1426000), the Youth Innovation Promotion Association CAS, and the State Key Laboratory Program of Chinese Ministry of Science and Technology.
1 T. Tajima and J. M. Dawson, Phys. Rev. Lett. 43 (4), 267 (1979).
2 W. P. Leemans, B. Nagler, A. J. Gonsalves, Cs Toth, K. Nakamura, C. G. R. Geddes, E. Esarey, C.
B. Schroeder, and S. M. Hooker, Nat. Phys. 2 (10), 696 (2006).
3 J. S. Liu, C. Q. Xia, W. T. Wang, H. Y. Lu, Ch Wang, A. H. Deng, W. T. Li, H. Zhang, X. Y. Liang,
Y. X. Leng, X. M. Lu, C. Wang, J. Z. Wang, K. Nakajima, R. X. Li, and Z. Z. Xu, Phys. Rev. Lett. 107 (3), 035001 (2011).
4 W. T Wang, W. T Li, J. S Liu, Z. J Zhang, R. Qi, C. H Yu, J. Q Liu, M. Fang, Z. Y Qin, C.
Wang, Y. Xu, F. X Wu, Y. X Leng, R. X Li, and Z. Z Xu, Phys. Rev. Lett. 117 (12), 124801 (2016).
5 X. Wang, R. Zgadzaj, N. Fazel, Z. Li, S. A. Yi, X. Zhang, W. Henderson, Y. Y. Chang, R. Korzekwa,
H. E. Tsai, C. H. Pai, H. Quevedo, G. Dyer, E. Gaul, M. Martinez, A. C. Bernstein, T. Borger, M. Spinks, M. Donovan, V. Khudik, G. Shvets, T. Ditmire, and M. C. Downer, Nat. Commun. 4, 1988 (2013).
6 M. S. Kim, D. G. Jang, T. H. Lee, I. H. Nam, I. W. Lee, and H. Suk, Appl. Phys. Lett. 102 (20),
204103 (2013).
7 W. P. Leemans, A. J. Gonsalves, H. S. Mao, K. Nakamura, C. Benedetti, C. B. Schroeder, C. Toth,
J. Daniels, D. E. Mittelberger, S. S. Bulanov, J. L. Vay, C. G. Geddes, and E. Esarey, Phys. Rev. Lett. 113 (24), 245002 (2014).
8 S. Steinke, J. van Tilborg, C. Benedetti, C. G. Geddes, C. B. Schroeder, J. Daniels, K. K. Swanson,
A. J. Gonsalves, K. Nakamura, N. H. Matlis, B. H. Shaw, E. Esarey, and W. P. Leemans, Nature
530 (7589), 190 (2016).
9 T. Tajima, K. Nakajima, and G. Mourou, Riv. Nuo. Cim. 40 (2), 33 (2017).
11 S. Corde, K. Ta Phuoc, G. Lambert, R. Fitour, V. Malka, A. Rousse, A. Beck, and E. Lefebvre,
Rev. Mod. Phys. 85 (1), 1 (2013).
12 Zhirong Huang, Yuantao Ding, and Carl B. Schroeder, Phys. Rev. Lett. 109 (20), 204801 (2012).
13 W. P. Leemans, C. G. R. Geddes, J. Faure, Cs Tóth, J. van Tilborg, C. B. Schroeder, E. Esarey, G.
Fubiani, D. Auerbach, B. Marcelis, M. A. Carnahan, R. A. Kaindl, J. Byrd, and M. C. Martin, Phys. Rev. Lett. 91 (7), 074802 (2003).
14 Silvia Cipiccia, Mohammad R. Islam, Bernhard Ersfeld, Richard P. Shanks, Enrico Brunetti,
Gregory Vieux, Xue Yang, Riju C. Issac, Samuel M. Wiggins, Gregor H. Welsh, Maria-Pia Anania, Dzmitry Maneuski, Rachel Montgomery, Gary Smith, Matthias Hoek, David J. Hamilton, Nuno R. C. Lemos, Dan Symes, Pattathil P. Rajeev, Val O. Shea, Joao M. Dias, and Dino A. Jaroszynski, Nat. Phys. 7 (11), 867 (2011).
15 C. H. Yu, R. Qi, W. T. Wang, J. S. Liu, W. T. Li, C. Wang, Z. J. Zhang, J. Q. Liu, Z. Y. Qin, M.
Fang, K. Feng, Y. Wu, Y. Tian, Y. Xu, F. X. Wu, Y. X. Leng, X. F. Weng, J. H. Wang, F. L. Wei, Y. C. Yi, Z. H. Song, R. X. Li, and Z. Z. Xu, Sci. Rep. 6, 29518 (2016).
16 J. Osterhoff, A. Popp, Zs Major, B. Marx, T. P. Rowlands-Rees, M. Fuchs, M. Geissler, R. Hörlein,
B. Hidding, S. Becker, E. A. Peralta, U. Schramm, F. Grüner, D. Habs, F. Krausz, S. M. Hooker, and S. Karsch, Phys. Rev. Lett. 101 (8), 085002 (2008).
17 Z. J. Zhang, J. S. Liu, W. T. Wang, W. T. Li, C. H. Yu, Y. Tian, R. Qi, C. Wang, Z. Y. Qin, M. Fang,
J. Q. Liu, K. Nakajima, R. X. Li, and Z. Z. Xu, New J. Phys. 17 (10), 103011 (2015).
18 Kazuhisa Nakajima, Haiyang Lu, Xueyan Zhao, Baifei Shen, Ruxin Li, and Zhizhan Xu, Chin.
Opt. Lett. 11 (1), 013501 (2013).
19 C. McGuffey, M. Levin, T. Matsuoka, V. Chvykov, G. Kalintchenko, P. Rousseau, V. Yanovsky, A.
Zigler, A. Maksimchuk, and K. Krushelnick, Physics of Plasmas 16 (11), 113105 (2009).
Zhang, X. M. Lu, Ch. Wang, J. Z. Wang, X. Y. Liang, Y. X. Leng, B. F. Shen, K. Nakajima, R. X. Li, and Z. Z. Xu, Appl. Phys. Lett. 99 (9), 091502 (2011).
21 A. H. Deng, M. W. Liu, J. S. Liu, X. M. Lu, C. Q. Xia, J. C. Xu, C. Wang, B. F. Shen, R. X. Li, Z.
Z. Xu, and K. Nakajima, Plasma Sci. Technol. 13 (3), 362 (2011).
22 N. A. Bobrova, A. A. Esaulov, J. I. Sakai, P. V. Sasorov, D. J. Spence, A. Butler, S. M. Hooker, and
S. V. Bulanov, Phys. Rev. E 65 (1), 016407 (2001).
23 S. Karsch, J. Osterhoff, A. Popp, T. P. Rowlands-Rees, Major Zs, M. Fuchs, B. Marx, R. Hörlein,
K. Schmid, L. Veisz, S. Becker, U. Schramm, B. Hidding, G. Pretzler, D. Habs, F. Grüner, F. Krausz, and S. M. Hooker, New J. Phys. 9 (11), 415 (2007).
24 B. Cros, C. Courtois, G. Matthieussent, A. Di Bernardo, D. Batani, N. Andreev, and S. Kuznetsov,
Phys. Rev. E 65 (2), 026405 (2002).
25 A. J. Gonsalves, F. Liu, N. A. Bobrova, P. V. Sasorov, C. Pieronek, J. Daniels, S. Antipov, J. E.
Butler, S. S. Bulanov, W. L. Waldron, D. E. Mittelberger, and W. P. Leemans, J. Appl. Phys. 119
(3), 033302 (2016).
26 J. Ashkenazy, R. Kipper, and M. Caner, Phys. Rev. A 43 (10), 5568 (1991).
27 S. A. Flih, E. Oks, and Y. Vitel, J. Phys. B: At. Mol. Opt. Phys. 36 (2), 283 (2003).
28 Seong Y. Oh, Han S. Uhm, Hoonsoo Kang, In W. Lee, and Hyyong Suk, J. Appl. Phys. 107 (10),
103309 (2010).
29 Vincent Detalle, René Héon, Mohamad Sabsabi, and Louis St-Onge, Spectrochim. Acta Part B 56 (6), 1011 (2001).
30 J. Daniels, J. van Tilborg, A. J. Gonsalves, C. B. Schroeder, C. Benedetti, E. Esarey, and W. P.