City, University of London Institutional Repository
Citation
:
Mayhew, L. (2018). The Dependency Trap - are we fit enough to face thefuture?. London: Centre for the Study of Financial Innovation (CSFI).
This is the published version of the paper.
This version of the publication may differ from the final published
version.
Permanent repository link:
http://openaccess.city.ac.uk/18973/Link to published version
:
Copyright and reuse:
City Research Online aims to make research
outputs of City, University of London available to a wider audience.
Copyright and Moral Rights remain with the author(s) and/or copyright
holders. URLs from City Research Online may be freely distributed and
linked to.
CSFI
Centre for the Study of
The Dependency Trap –
are we fit enough to face
the future?
Les Mayhew
The Dependency Trap –
are we fit enough to face
the future?
CSFI
The Centre for the Study of Financial Innovation is a non-profit think-tank, established in 1993 to look at future developments in the international financial field – particularly from the point of view of practitioners. Its goals include identifying new areas of business, flagging areas of danger and provoking a debate about key financial issues. The Centre has no ideological brief, beyond a belief in open markets.
Trustees Governing Council
David Lascelles (Chairman) Sir Malcolm Williamson (Chairman) John Hitchins Geoffrey Bell (NY)
Mark Robson Rudi Bogni Carol Sergeant Philip Brown
Sir Malcolm Williamson Mohammed El-Kuwaiz John Heimann (NY)
Staff John Hitchins
Director – Andrew Hilton Rene Karsenti
Co-Director – Jane Fuller Henry Kaufman (NY) Senior Fellow – David Lascelles Walter Kielholz Programme Coordinator – Angus Young Sir Andrew Large
David Lascelles John Plender David Potter Belinda Richards Mark Robson David Rule Carol Sergeant Sir Brian Williamson Peter Wilson-Smith
CSFI publications can be purchased through our website www.csfi.org
or by calling the Centre on +44 (0) 20 7621 1056
Published by Centre for the Study of Financial Innovation (CSFI) Cover Illustration: Joe Cummings
Email: [email protected] Web: www.csfi.org
ISBN: 978-1-9997174-3-8
CSFI
Contents
Foreword ... V Preface ...VI
Executive Summary ...1
Introduction ...3
Chapter 1: Life expectancy free of disability and in good health ...7
Chapter 2: Labour market activity and health ...13
Chapter 3: Earnings and pension adequacy over the life cycle ...19
Chapter 4: The dependency ratio and state pension age ...26
Chapter 5: ‘Active Ageing’ Scenario ...32
Chapter 6: Discussion of main findings ...36
Annex A: Definitions of inactivity and disability under the Equality Act ...40
Annex B: Annuity values based on pension size ...42
Foreword
The provision of an adequate retirement income remains one of the biggest challenges facing developed economies. Ageing populations and a decline in the ratio of workers to retired people means that the pressure on state systems will continue to become ever more acute. The UK government, like others, has moved to increase the state pension age (SPA) in an attempt to balance pension finances, while maintaining the aim of people spending up to one third of their adult life in retirement.
However, as this report makes clear, the impact of health and disability becomes increasingly significant once people pass 50 years of age and participation in the workforce tails off. Consequently, there are limits to how far the SPA can be raised without simply shifting people from a state pension onto disability benefit. In the absence of a boost to incomes from an increase in productivity, something the Office for Budget Responsibility has now officially given up on, the focus must turn to raising participation rates amongst those aged 50 to 70. The report advocates an “active ageing” scenario, which sees this group increase its participation rate, a development that has already begun to happen as more people extend their working lives.
Longer working lives should also help people to increase their savings for retirement, something that we at Schroders and many others continue to advocate. This report adds to that discussion by highlighting the challenges faced by women, who often have interrupted careers as a result of managing caring responsibilities alongside participation in the workforce. More generally, the report draws attention to the complexity of the savings and retirement decision in a world of uncertain health and individual responsibility. In particular, there is a compelling call for more information to be made available to those in DC pension schemes so as to make the best decisions on when and how rapidly to draw on their pension savings.
Clearly, the private sector has a significant role in helping to meet these challenges and Schroders is very happy to be supporting this report in conjunction with the CSFI.
Lesley-Ann Morgan
Global Head of Defined Contribution and Retirement Schroders
Keith Wade
Chief Economist Schroders
CSFI
Preface
A cynic might say that we would be lucky to live long enough to face the problems identified in this report. Maybe, but the problems of financing old age in an era of increasing longevity, less security of employment and the decline/disappearance of the old defined benefit pension plan are enormous. Governments (of whatever hue) are not unaware of the problem, and are making efforts to tackle it – inter alia by auto-enrolment of workers into pension schemes (eg Nest), by removing the burdensome annuitisation requirement, by eliminating the mandatory retirement age, and (most controversial of all) by nudging the State Pension Age up.
But is that enough?
This report – written by Professor Les Mayhew of the Cass Business School, at City University (and a former senior civil servant in the DHSS, DSS, Treasury and ONS) – suggests that it is not. And that even the report produced by John Cridland in March 2017 may have been too optimistic in its recommendations as to what needs to be done to maintain the sustainability of the present pension promise.
Prof Mayhew’s contribution is to focus not simply on longevity, but on what he calls ‘active ageing’. Raising
the SPA will not, by itself, resolve the problem unless it is accompanied by measures to reduce disability (physical or mental), to encourage older workers to remain employed, and (linked to that) to shift the point of peak earnings towards older workers. If, by a combination of education and preventative health care, we can increase the percentage of older workers (whether or not they define themselves as disabled) in work, the government’s goal of providing a state pension that is roughly one-third of average earnings to fund a retirement that is up to one third of a person’s adult life is realistic. Otherwise, the future looks pretty bleak.
This is an important report, using new tools that cast a cold eye on one of the biggest challenges facing any government – a challenge that cannot be wished away. I am very grateful to Prof Mayhew for all his work – and for letting us publish the results. I am also very grateful to Schroders and Cass for their support, and to my colleague, Jane Fuller, whose interest in pensions is well-known and who worked with Les at all stages. Many thanks to all of them.
Andrew Hilton
Executive Summary
The UK population is forecast to grow from 65m in 2015 to 75m in 2040, with the number aged 65-plus set to increase by 50%, from 12m to 18m. The classic “dependency trap” is that an ageing society has fewer workers to support every pensioner, piling pressure on health and social care services, and on the taxpayers that fund them. But the standard ratio of those aged 20-64 to those aged 65-plus is a crude measure of whether an economy can thrive as its population ages.
This report, using new data and analytical tools, focuses on economic activity, which starts to tail off when people reach 50, with ill health or disability as the biggest single cause. This means that raising the state pension age (SPA), while necessary, is not sufficient as a response to increased longevity. Attention needs to focus on improving activity rates in the lengthening run-up to retirement. This would raise lifetime earnings and saving levels, as well as providing the tax revenues needed to fund state benefits.
The main points of the report are:
1. On current demographic trends, there will be a 50% growth in the UK population aged 65-plus by 2040. This means that the dependency ratio – the number of people aged 20-64 compared with those aged 65-plus – would deteriorate from more than three times to just over two times if nothing were done.
2. Just as important as age is economic activity, which deteriorates once individuals reach 50 – and does so rapidly from 55. A major cause of inactivity is ill health, and disabling conditions increase with age. So raising the SPA is not enough to mitigate the adverse impacts of ageing on the economy and people’s capacity to earn and save.
3. The key challenge for policy-makers, shared with the private sector, is to seek ways to improve economic activity rates between the ages of 50 and 70. This includes public policy initiatives to prevent or delay the onset of ill health, employers’ efforts to create more opportunities for workforce participation, and financial services products that mitigate the effects. 4. The good news is that economic activity rates
are growing among those over 60, albeit from a low base. This is in response to the increase in the women’s SPA and the abolition of a default retirement age. But healthy life expectancy, and related activity rates, vary significantly between UK districts, indicating the importance of measures to narrow the gaps in local outcomes.
5. Gender variations in total life-time earnings remain substantial, with men earning – on average – 80% more than women. This reflects the impact of career breaks, part-time jobs and lower-paid work on the
CSFI
The Dependency Trap – are we fit
enough to face the future?
Les Mayhew
CSFI
average total earned by women, with a knock-on effect on pension prospects. This report suggests that working partners should be able to contribute to the pension funds of non-working partners.
6. Overlapping caring responsibilities for children and elderly relatives – the ‘sandwich years’ - are a growing phenomenon, but they can be predicted, which suggests that bespoke insurance, or care annuity, products could be developed.
7. To expand earnings/savings capacity (and the tax take to pay for pensions) at older ages, three things need to happen: earnings should peak later to improve incentives to stay in work; economic activity rates need to rise from age 50; and
productivity should go up. The first two are moving in the right direction, but productivity remains flat. 8. To help people assess whether they are on course to accumulate sufficient pension savings, this report suggests a bespoke calculator that can combine the outcomes from a series of contributions. This would aid decisions about whether to work for longer and save more.
9. The government has stated that people should expect to spend up to a third of adult life in
retirement, namely in receipt of a state pension. This is only sustainable if activity rates rise sufficiently, as modelled in this report.
10. The stakes are high: the state pension accounts for about 12% of public spending, so it is important both to raise activity rates and manage pension costs. Taking into account the impact of disability on dependency, our calculations suggest that the SPA might need to rise even faster than proposed by the Cridland review, which would mean abandoning the one-third target.
11. The dependency trap, representing the economic and fiscal conflict between the working population and pensioners, can be avoided by raising taxes, cutting pension benefits and/or increasing economic activity. Clearly, the last is the least painful.
12. This report advocates an ‘active ageing scenario’. Raising the activity rate of the working age
CSFI
Introduction
The dependency trap usually refers to societies in which the population becomes over-reliant on government handouts. In this research, however, we are using it to describe a society that is sleep-walking into a conflict between the competing needs of an ageing population for a decent pension and a working-age population that is struggling to save for retirement, with the issues compounded by inequalities in health and income. Welfare systems built to protect against these eventualities are under increasing strain, and a balance has to be struck between raising taxes to pay for protection and limiting the financial burden on working families. An ageing population increases these dependencies because the number of older people requiring financial and other support grows relative to the working-age population’s ability to provide it. This has the potential to lead to a slowdown in economic growth, in the absence of off-setting rises in productivity.1
The ageing process is associated with reduced levels of economic activity, increasing frailty and diminishing cognitive ability. However, a theme in this research is that reduced economic activity does not begin with retirement. For example, a well-educated population is more likely to be healthier and economically successful than one that is not, regardless of whether it is ageing (and better educated people are less likely to work in jobs that are susceptible to physical infirmity). According to Sasson2, the poorest in society are more likely to fall
victim to the cumulative effects of decades of unhealthy lifestyle and income inequality. He argues that the wealthier tend to adopt healthy behaviour, and hence are better placed to avoid or defer problems.
Staying healthy enables us to postpone the day when we are too frail to work or too ill to live independently. As a population ages, average health levels decline and so our success as a country in improving longevity paradoxically stores up problems. We eventually become victims of our own success because growth is harder to sustain. Unless that ageing population is supported by increased output per worker, potential economic problems include labour shortfalls that may fuel immigration, reduced pensioner benefits and so on, all of which need to be managed and planned for.
It is commonly observed that since productivity declines with age, the antidote will need to come from elsewhere, such as new technology. However, there is another argument, namely that if more people become economically active and in better health, they would be enabled to work – and save – for longer. Although this appears obvious, there are obstacles, including maintaining a healthy lifestyle and having self-belief. There are also competing obligations such as caring for sick children, elderly relatives or people with disabilities – all essential activities, but hard to plan for and costly in terms of time and money.
Lessening some of these obstacles would enable a greater percentage of the population to be economically active. People would be able to work for longer, have more financial choices in the latter part of their lives and be less dependent on others. Employers would value older workers more than they do now for their skills and experience. However, as this report will argue, progress towards this better state is far too slow. The looming dependency trap is, therefore, a wake-up call to policy makers and all those with an interest in ageing.
CSFI
The report points out that rises in longevity are not much use without accompanying improvements in healthy life expectancy. If the gap expands, more taxes will be diverted to pay for health and social care, upward pressure on the state pension age (SPA) will increase and the proportion of adult life spent in retirement will shrink. Meanwhile, taxes will rise and average income fall. The result would be to widen the inequality gap between rich and poor, and the healthy and unhealthy. Although becoming unhealthy at a relatively early age does not have to mean that life is foreshortened, it negatively affects a person’s ability to build up a pension and could hasten dependency. Most of these arguments are well known, but they tend to operate in silos such that the inter-connectivity between an improvement in health, higher activity rates and better pensions is obscured. One manifestation of
this is that, as a society, we put relatively few resources into prevention because we never measure its value. This report tries to rectify this by bringing together analytical tools and new data to answer questions such as: how can the economy expand with an ageing population? And, by how much would activity rates need to increase to reduce dependency?
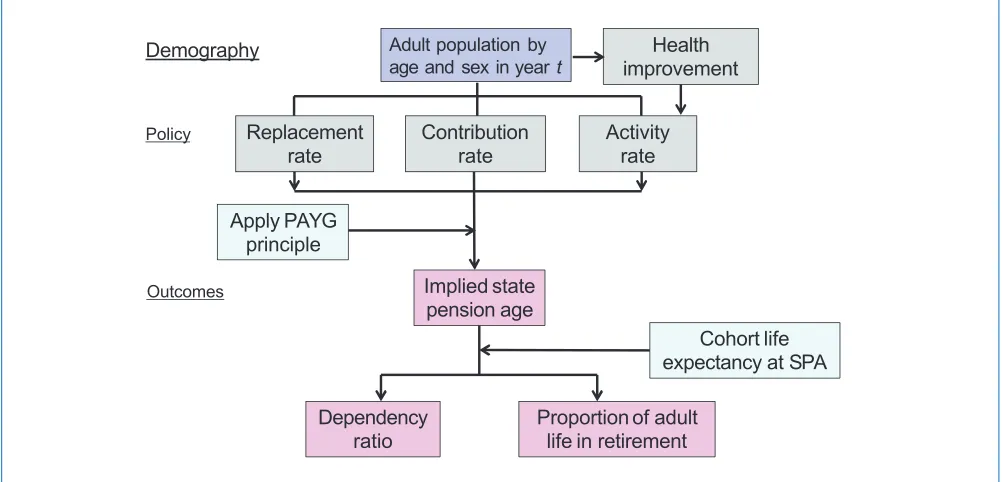
[image:10.612.58.557.368.685.2]Figure 1 sets out these important relationships. The top level is human capital, whether healthy or unhealthy. A healthier population is more productive and flexible than an unhealthy one, and so staying fitter for longer should become a strategic goal. The population is divisible into economically active and inactive, and the data show that disabled people are more likely to be economically inactive or unemployed. This tendency increases with age, especially from age 50.
Figure 1: Relationship between economic activity, productivity, pensions and taxes – a demographic perspective
Population
Healthy Unhealthy/disabled
Economically
active Economically inactive
Income &
tax credits Taxes State pension & other benefits
Net income
Human capital
Productivity
Re-distribution
Consumption Savings & investments
CSFI
The length of a working life is conventionally measured from age 20 to the SPA, but these boundaries are largely false as some people have much longer/shorter working lives than others. This is reflected in earnings (a proxy for productivity), which on average peak in a person’s 40s before declining. But what causes earnings to peak, and is decline inevitable? Is the peak changing over time in response to population ageing? And how has ageing affected average earnings at older ages compared with that of younger people?
Since women are more likely to experience interrupted careers, through bringing up children or looking after elderly or sick relatives, their lifetime pattern of earnings and economic activity is a barometer of different pressures in society, such as how to balance caring roles with careers. Questions include whether more women are now working at every age; how career breaks affect their lifetime earnings and ability to save for a pension; and whether there is a squeezed generation who are balancing work with caring for children and elderly parents. These issues are strategically important not just because of intergenerational fairness and sufficiency of income at an individual level, but also because of affordability and economic management in a society that is simultaneously growing in size and ageing. The UK population is forecast to grow from 65m in 2015 to 71m in 2030 and 75m in 2040. In between, the number of people aged 65-plus will increase from 12m in 2015 to 18m in 2040, while the number aged 20-64 will level out at about 40m.
The dependency ratio
The dependency ratio measures the pressure that a growing number of pensioners places on the tax-paying working population. It is customary to align the lower age with labour force entry and the upper age with the point when state retirement benefits kick in. The
standard ratio has divided those aged 20-64 by those aged 65-plus, it was 3.7 in 20073. But since then, with
baby boomers starting to retire, it has turned down sharply and would fall to 2.2 by 2040 without increases in the SPA. The dramatic fall in the ratio has become a major strategic concern.
The deterioration in the ratio after 2007 would have been worse without an influx of migrants from Europe and elsewhere – around three million since 2000. The UK government aims to reduce future immigration from about 250,000 a year to the ‘tens of thousands’, after Britain leaves the European Union. The effect will not be felt immediately, unless existing migrants return home, but it has the potential to put further pressure on the dependency ratio.
These changes are taking place against a background of rising life expectancy. Although increases have slowed in the last few years, the changes of the past 40 years have been hugely significant. For example, in 1975 a person entering the labour force at 20 had a life expectancy of 54.3 years compared with 61.4 today. In addition, the longevity gap between men and women has been closing.4 Underlying this trend are significant changes in
male lifestyles and occupations, which have seen a fall in tobacco-related deaths and heart disease, and fewer men working in hazardous occupations.
Higher up the age scale, increasing longevity has also dramatically affected the age at which people die. For men the modal age (at which the most deaths occur) rose from 72 to 84 between 1975 and 2015 and, for women, from 80 to 89. Changes on this scale are to be celebrated as testimony to how far society has advanced in just 40 years. But they mask another, more troubling, trend: the persistent and growing inequality in life-span between the richest and poorest areas of the country. Inequalities on the scale described in this research are a drag on the economy because they dis-enable people from reaching their potential.5
3. Sometimes the dependency ratio is expressed as the number of pensioners per worker i.e. the inverse. Although school-leaving age is 16, the use of the age range 20-64 is more meaningful because of the impact of further education, training and other factors on the 16-19 cohort.
4. Mayhew L. D., Smith,, D. (2014), 'Gender Convergence in Human Survival and the Postponement of Death', North American Actuarial Journal, 18(1), p.194-216
CSFI
Report structure
The report begins by analysing the health of the
population using three different measures: the prevalence of disability, disability-free life expectancy and healthy life expectancy. As well as the national data, we also highlight variations at a local level. This shows that reducing health variations is a major imperative as far as managing the dependency trap is concerned. Chapter 2 analyses labour market activity by age and finds that there are large falls in activity rates over the age of 50 and that poor health is partly to blame. This means that raising the SPA has its limits as a means to expand the workforce.
Age-related earnings crucially affect the ability to save for a pension over a working life. Chapter 3 looks at the impact of part-time work and career breaks on women’s private pension pots. Currently, the SPA is transitioning from 65 to 66 by 2018 (for women from 60 to 66) and is due to rise to 67 by 2028 and 68 by 2037-39. Chapter 4 explores the affordability of the principle, stated by the UK government, that people should
expect to spend up to one third of their adult life in retirement. With no default retirement age, this has effectively come to mean in receipt of the state pension. The chapter also covers the value of pension benefits relative to earnings and the impact on the dependency ratio of raising the SPA.
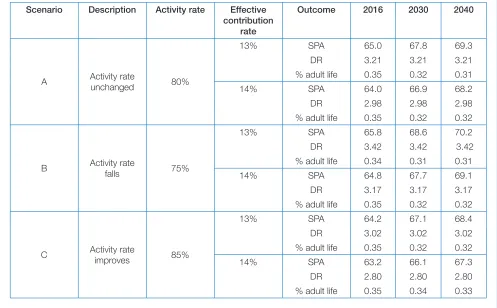
Chapter 5 looks ahead to 2040 using different scenarios. It considers whether the SPA can be kept in line with the one-third principle without significant improvements in economic activity rates and, by implication, the health of working-age adults. The concluding section advocates the strategic necessity of a more proactive approach to enabling people to work for longer.
CSFI
Chapter 1:
Life expectancy free of disability
and in good health
Life expectancy and, within that, state-of-health expectancy are important high-level measures for population wellbeing. Period life expectancy at a given age, for any area, is the average number of years a person would live if he or she experienced that area’s age-specific mortality rates. Cohort life expectancy, by contrast, is based on the mortality experience of the specified cohort for a given birth year. This research is concerned with both.
In contrast, state-of-health expectancies provide estimates of how long a person can expect to live in very good health, good health or disability-free. The two definitions used today are healthy life expectancy (HLE) and disability-free life expectancy (DFLE). Data to determine HLE and DFLE are based on self-assessment and are collected in the Annual Population Survey (APS), which is a large rolling survey based on some 320,000 households. It covers ages 16 to 95; the health status of those outside this age range is estimated using a combination of census data and imputation.
Box 1 provides details of the questions asked of respondents. HLE, which is the simpler of the two, establishes whether a person’s health is simply good, fair, bad or very bad. DFLE tests whether health or disability problems affect one’s ability to carry out normal daily activities. These include household chores, such as washing and dressing, shopping and so on. It also draws a distinction between conditions that affect one’s ability to carry out activities of daily living either ‘a lot’ or ‘a little’.
The methodology and data collection methods have undergone various changes to improve their accuracy and to harmonise definitions with those used elsewhere. Most notably, these include changes that occurred after April 2013 to bring the definition of disability into line with the legal definition under the 2010 Equality Act. The general framework is consistent with international practice, as set out, for example, in the International Classification of Functioning, Disability and Health (ICF), adopted by the World Health Organisation.
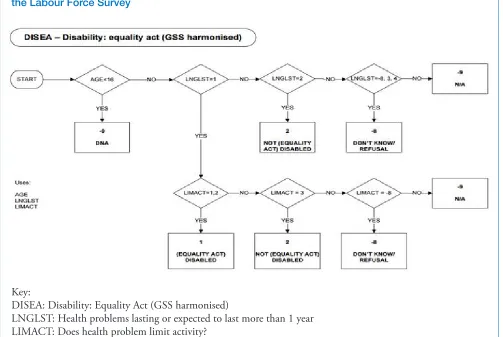
This research concentrates on the most recent period, using data from 2013-15 to measure the prevalence of disability by single year of age, and DFLE expectancy at birth and ages 20, 50 and 65. It also compares adult health expectancies with life expectancy by gender and down to district level, in order to provide a window on the ability to work at older ages – particularly the range of variation between areas of the UK. For actual activity rates, we turn to the Labour Force Survey (LFS), which has been brought into line with the APS in terms of disability.
CSFI
Of the two definitions, the DFLE is better at discerning the capacity to work because it directly addresses functional capability, whereas the HLE simply deals with illness and general health. In particular, the LFS distinguishes people who report a health issue, but are not classified as having a long-term health problem or disability under the core definition of the Equality Act. We use this important legal definition to separate people who are economically active and disabled from those who are economically inactive and disabled.
The correlation between disability and rates of economic activity can be used to estimate how improvements in health might potentially translate into higher levels of economic activity, while the significant variation in LE, HLE and DFLE by local area shows the gap that needs to be bridged by way of improvement. Since the reasons for economic inactivity can include caring commitments, an improvement in general health, or reduction in disability, will tend to lessen the demands on carers. In other words, there is a double economic benefit depending on whether caring commitments are full or part-time.
Box 1: Defining health and disability-free life expectancy
Healthy life expectancy is defined as the number of remaining years that an individual can expect to live in very good or good general health. The APS asks:
How is your health in general; would you say it was…
Very good?
Good?
Fair?
Bad?
Very bad?
Disability-free life expectancy is defined as the number of remaining years that an individual can expect to live without a limiting long-standing illness. The APS asks:
Do you have any physical or mental health
conditions or illnesses lasting or expected to last 12 months or more?
If yes, does your condition or illness/do any of your conditions or illnesses reduce your ability to carry-out day-to-day activities?
Yes, a lot
Yes, a little
No
The respondent is also asked to take account of what their situation would be like without medication or treatment or any devices such as a hearing aid.
Notes
Guidance is provided on what is meant by activities of daily living. These include washing and dressing, household cleaning, cooking, shopping for essentials, using public or private transport, walking a defined distance, climbing stairs, remembering to pay bills and a variety of moderate manual tasks.
CSFI
Prevalence of disability and
ill-health
Ideally, we would like to use data linking census or survey records to deaths, as this would enable a direct relationship to be identified between mortality and health status. The ONS does not currently offer this facility to statistics users. However, the question is important, especially if it shows that people who become ill or disabled at younger ages live for more years than those who become ill or disabled at later ages. If true, it means that policies that seek to delay the onset of disability or ill health through health improvement programmes at home, school or in the workplace can be better evaluated.
Working with the ONS, we commissioned tables that combine data on the prevalence of people in good health with standard life tables. Tables by single year of age were produced from birth to 95 for each gender (health data for ages 95-plus are less reliable for sampling reasons). As the following will show, this way of presenting the data is extremely useful in uncovering the impact of poor health on labour market participation, and especially the potential to work at older ages.
The results have obvious ramifications for economic output, as well as welfare implications. They emphasise that policies to prevent people from becoming unhealthy and to promote better health are likely to be cheaper than, say, prolonged economic inactivity. Box 2 demonstrates this point. Chart (a) shows two curves based on a standard population of 100,000. The blue curve is the number of people who are expected to
survive using a standard UK life table; the red curve is the number at each age that are disability-free based on the APS.
The area encapsulated by the two curves represents the number of life-years exposed to disability. Dividing this quantity by 100,000 gives the difference between DFLE and LE from birth (which is how the gap between life expectancy and disability-free life expectancy is generally expressed). The higher the gap, the greater the number of years and proportion of life spent in disability and vice-versa. In an ideal world, this should be as small as possible. The ratio between PQ and PS in chart (a) represents the prevalence of disability at each age. The horizontal line QA, by contrast, represents the approximate number of years from becoming disabled to death. It is a crude representation because, as noted, it is not possible to link the lives in each curve directly. In essence, we assume that people die in order of becoming long-term sick or disabled. (This breaks down in the case of death by accident – hence the approximation.)
CSFI
Box 2: Longevity and the prevalence of disability
(a) Chart showing the population still alive with and without disabilities (Base = 100,000)
Definitions: Prevalence of disability = PQ/PS Years spent in disability or long term illness = QA
(b) Prevalence of disability in the population based on the APS showing the ‘lot/little’ boundary
(c) Life expectancy and DFLE at given ages
Age Life expectancy DFLE Health gap
(years) % of remaining life in good health
0 81.3 62.8 18.5 77.2
20 61.8 45.1 16.7 73.0
50 32.8 20.2 12.6 61.6
65 19.9 10.5 9.4 52.8
Source: ONS 0 10000 20000 30000 40000 50000 60000 70000 80000 90000 100000
0 10 20 30 40 50 60 70 80 90
N um be r o f p eo pl e Age
Number of survivors Disability-free Estimated 0.00 0.10 0.20 0.30 0.40 0.50 0.60 0.70 0.80
0 10 20 30 40 50 60 70 80 90
Pr ev al en ce o f d is ab ili ty Age All disability Less severe disability Estimated
P
Q
S
A
0 10000 20000 30000 40000 50000 60000 70000 80000 90000 1000000 10 20 30 40 50 60 70 80 90
N um be r o f p eo pl e Age
Number of survivors Disability-free Estimated 0.00 0.10 0.20 0.30 0.40 0.50 0.60 0.70 0.80
0 10 20 30 40 50 60 70 80 90
Pr ev al en ce o f d is ab ili ty Age All disability Less severe disability Estimated
P
Q
S
CSFI
Table (c) of Box 2 shows LE and DFLE at birth, and at ages 20, 50 and 65. Although this shows the expected pattern, it conceals the wide variation between the time individuals actually spend in ill health and the averages for different cohorts. Also, the severity of any disability will vary from person to person and this will affect the ability to work.In Chapter 2, we investigate further the relationship between disability and economic activity and how it varies with age.
Another important finding is that the number of years from the age of onset of a disability to death reduces on average by six to seven months each year. This suggests that a person who contracts a long-term limiting illness at age 20 can expect, on average, another 43 years of life; at 50 it is 26.3 years and at 65, 17.7 years. This reinforces the point that delaying the onset of a limiting illness significantly reduces the proportion of remaining adult life spent in ill health. Not only is this beneficial to individuals but also to society as a whole because it reduces life-time healthcare costs.
One reason that age 50 is worth a closer look is that this is when economic activity rates peak, with a decline setting in well before the SPA. A disability-free man of 50 can expect about another 20 years free of disability, but this hides a lot of variation. The data show that at age 50, 19% of men have some form of disability (9% ‘a lot’), and 25% of women (11% ‘a lot’). By 65, a third of men and 35% of women have some form of disability. The 50% threshold occurs at 78 for men and 76 for women. Average levels of disability in the whole adult population are 23%, and in the working age population (20 to 64) 19%.
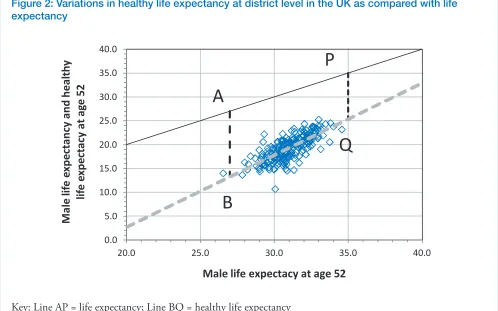
These insights apply at national level, but disaggregated data at a district level show significant variations in life expectancy and even more variation in disability-free and healthy life expectancy. Since disability is a key determinant of economic inactivity, we compared the HLE of men and women living in different areas in order to assess differences in the potential capacity to work. If HLE is relatively high, we assume the capacity is greater than if it is low. When it is low, more people are dis-enabled since the prevalence of disability is higher. ONS aggregates the results into age bands so, for practical reasons, we chose a midpoint age of 52, rather
than 50, for this part of the analysis. In Figure 2, HLE is plotted against life expectancy by district, with each data point representing a different district and the dotted, best-fit, line representing the average trend. The vertical lines (AB and PQ) show the gap between HLE and LE at either end of the life expectancy range. The larger the gap, the greater the number of remaining years spent in ill health or disability, and hence a greater level of dependency than for a person in good health. The extremities of the distribution range from male HLE at age 52 of 10.7 years in Tower Hamlets to 25.3 years in Wokingham, Surrey. Now, assume a hypothetical SPA of 70: a man aged 52 would require at least 18 years of healthy life to be sure of being fit for work up to that age, although this would depend on the type of occupation. Based on district level data, the figure of 18 years would currently only be achievable in 68% of districts across the UK. For women at 52, HLE reaches 28.6 years in the Orkney Islands, and the equivalent ranges are AB = 12.5 years and PQ = 15.2 years. Hence, the size of gap is greater, but the range of variation is less. There is a well-established positive correlation between poor health and deprivation and low income and educational attainment. An implication of our findings is that back-to-work policies for people aged 50-plus will be less effective in deprived, low-skilled areas where poor health is endemic. Policies that maintain and prolong good health are more likely to bear fruit by increasing the long-term capacity to work in a wider range of occupations where any form of disability is a barrier. The key point is that the causes of disability are amenable to change if policies can be targeted at preventable conditions causing the most harm.
CSFI
Figure 2: Variations in healthy life expectancy at district level in the UK as compared with life expectancy
Key: Line AP = life expectancy; Line BQ = healthy life expectancy
Source: ONS
0.0 5.0 10.0 15.0 20.0 25.0 30.0 35.0 40.0
20.0 25.0 30.0 35.0 40.0
M
al
e
lif
e
ex
pe
ct
an
cy
a
nd
h
ea
lth
y
lif
e
ex
pe
ct
ac
y
at
a
ge
5
2
Male life expectacy at age 52
A
B
P
Q
Implications: income replacement
The 2013 Sergeant Review of Simple Financial Products commissioned by the UK Government recommended that, as a high priority, the industry (led by the Association of British Insurers) should work on an income replacement product. This would address directly the risk of becoming disabled and losing earning capacity. The increased fragmentation of employment and growing ranks of self-employed – to nearly 5 million – suggest that demand ought to be growing for this type of product.
CSFI
Chapter 2:
Labour market activity and health
Poor health, whatever its causes, can be seen as a strategic issue in an ageing society, especially where it becomes a constraint on economic growth and leads, for example, to higher taxes. In this chapter, we analyse the relationship between work and health in greater depth. We consider the relationship between economic activity and age, and how it is affected by health. To understand the transitional processes over the life cycle, it is necessary to analyse the data at a finer level of detail than is typically the case.
The Labour Force Survey (LFS) defines adults as either economically active or inactive, but it also subdivides them according to whether they are disability-free, or not. In theory, a person can be in one of four states: economically inactive and disability-free; economically active and disabled; economically active and disabled; and economically active and disability-free. Note that an unemployed person is one who is seeking work, and is therefore deemed to be economically active from a labour market perspective.
As annex A explains, the LFS distinguishes people who report a health problem, but are not classified as having a long-term health problem or disability under the Equality Act (2010). Importantly, the harmonised definition of disability is now the lead statistic for the labour market status of disabled people in Britain (the Act does not apply to Northern Ireland). As was seen
in Box 1, this includes anyone who says they have a long-term physical or mental health condition or illness, regardless of the impact this may have on their ability to work or carry out day-to-day activities.
However, there are some caveats to this. Since the current definition of health has only recently become available, we are unable to report changes over time in levels of economic activity by age, using a consistent definition. The data also rely on people acknowledging they have a health problem, which not all do. Because the LFS mainly samples people of working age, information about workers aged 65-plus tends to be less reliable and based on small samples, so we have used the Annual Population Survey (APS), with which the LFS is harmonised, to help fill the gaps.
CSFI
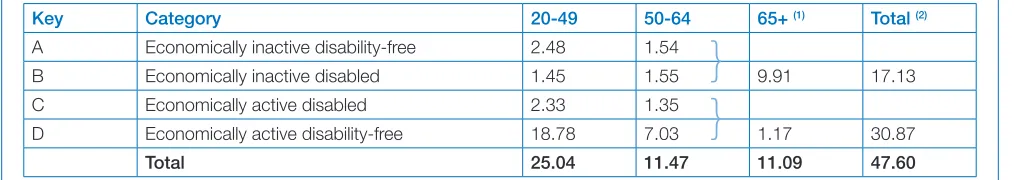
Since the APS and LFS surveys are conducted for statistical purposes, they are unrelated to other purposes such as determining a person’s eligibility for disability benefits, which entails a completely different process. A straightforward claimant count would lead to different totals, partly because some are entitled to more than one benefit, and also due to definitional differences. When this is taken into account, the DWP puts the number of inactive working-age claimants of disability benefits at 2.9m, which comes close to the 3m figure in category B (1.45m + 1.55m = 3m).6
Further insights are obtained when these figures are re-presented by single year of age. Box 3 gives a proportional split of the population, from 16 onwards, into the four categories. The general picture is that the economically active population starts to level out after age 23 as
graduates move into employment, and this continues until
55, after which the rate of economic inactivity rises steeply. The LFS gives the main reason for economic inactivity as sickness and disability, but other important categories are looking after a home or caring (especially among women), early retirement or being a student – although their relative importance varies over the life cycle.
The next significant change occurs at around 70. By this age, the percentage of people who are economically active has fallen to less than 12% of the population. The rest consists of 36% who are inactive disabled and 52% who are inactive and disability-free. At older ages, the proportion that is inactive and disability-free falls steeply, with 70 marking a turning point. The significance of this is that rises in the SPA beyond 70 cannot be relied upon to produce people available to work because the number that are not disabled (i.e. without a long-term limiting illness) dwindles rapidly.
[image:20.612.56.563.163.253.2]6. Although the totals correspond, it does not mean that there is a perfect match between people claiming benefits and these responding to the surveys and vice versa. Some may not claim benefits for which they may be entitled and others claim benefits to which they are not entitled.
Table 1: The number of people in different age groups by economic activity and health status (October 2015 to September 2016; millions)
Key Category 20-49 50-64 65+ (1) Total (2)
A Economically inactive disability-free 2.48 1.54
B Economically inactive disabled 1.45 1.55 9.91 17.13
C Economically active disabled 2.33 1.35
D Economically active disability-free 18.78 7.03 1.17 30.87
Total 25.04 11.47 11.09 47.60
Notes: (1) & (2) Totals include people who did not state their health
CSFI
Box 3: Economic activity by age in 2015
Source: ONS, Labour Force Survey October 2015 to September 2016
Chart showing the proportion of the population aged 15-80 in one of four given states: A: Economically inactive disability-free;
B: Economically inactive disabled; C: Economically active disabled; and D: Economically active disability-free
Notes: (i) The proportion of the population that is economically active starts to level out from age 23; (ii) the rate of economic inactivity rises sharply after age 55; (iii) the availability of economically inactive disability-free (i.e. potential workers) falls sharply beyond age 70.
Box 3: Economic activity by age in 2015
Source: ONS, Labour Force Survey October 2015 to September 2016
Chart showing the proportion of the population aged 15-80 in one of four given states:
(A) Economically inactive disability-free; (B) Economically inactive disabled; (C) Economically active disabled; and (D) Economically active disability-free
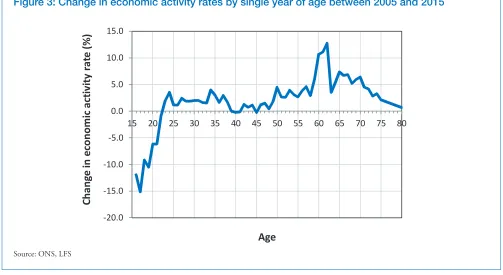
Figure 3: Change in economic activity rates by single year of age between 2005 and 2015
Source: ONS, LFS
CSFI
Gender variations in
economic activity and
working to older ages
Levels of economic activity vary between men and women, especially in the age range 23 to 55 when levels of female economic activity are 10 to 15 percentage points less than men’s at similar ages. The child-raising years create a gap in women’s income and also affect future income-earning potential.
The most important long-term change has been the increase in female activity rates relative to men. In 1970 about 55% of women aged 16-64 were economically active and 95% of men. Since then, male rates have fallen to 84% and women’s have increased to 74%. The growth in the proportion of women in the labour force is strongly related to the rising number of mothers re-entering the labour force and remaining in employment for longer. This strategic shift in patterns of work reflect changes in the labour market,
in particular a transition from manufacturing to service industries and much greater interchangability between traditionally male and female jobs.
In the 10 years to 2015, the number of economically active people rose from 30.4m to 32.2m,7 reflecting the
growth in the UK population coupled with a buoyant and flexible jobs market. However, change can also be seen in the age structure (see Figure 3), with falls in the percentage of economically active people below 23 (for educational reasons) and higher activity rates at older ages.
Especially interesting is the growth in economic activity from age 60, although from a much lower base. This is a reaction not only to the increase in the women’s SPA, as well as squeezed household incomes, but also to the abolition of the default retirement age of 65. From a policy standpoint, the increase in activity rates at older ages is a welcome sign that people are responding to the stimuli of higher pension ages and the removal of barriers to working for longer.
-20.0 -15.0 -10.0 -5.0 0.0 5.0 10.0 15.0
15 20 25 30 35 40 45 50 55 60 65 70 75 80
Ch
an
ge
in
e
co
no
m
ic
a
ct
iv
ity
ra
te
(%
)
Age
CSFI
Life cycle factors affecting mainly
women in the labour market
The transition to higher female participation in the labour force has run in parallel with significant changes in household structures and living arrangements. Most households are childless, fewer people are getting married and those who do are more likely to end up divorcing. These trends have been accompanied by an increase in the average age at which first marriages occur, and by rising levels of cohabitation as a replacement for, or pre-cursor to, marriage. More women enter university today and the delay in child-bearing is linked to their educational level. Access to further education has been the most important driver of changes in female labour market behaviour. Although women have overtaken young men in terms of average educational attainment, men and women still engage in different fields of study. While a large proportion of females graduate with degrees in humanities, female participation in science and engineering remains relatively low, affecting future earning prospects. Many women choose careers such as teaching or nursing that pay less but are more flexible, in which career breaks and a return to work are easier to manage.
These factors also account for a much larger share of female than male employment being part-time. Despite an improvement in the labour market situation for women, gaps persist in employment outcomes. These are reflected in differences in responsibility levels, with fewer women in managerial positions, leading to lower life-time earnings and poorer pension prospects. This means they find it harder to be financially independent of their partners, and poorer still if they are a lone parent trying to juggle raising children with work.
In general, couple households give rise to more resilient living arrangements, especially those in which there are two incomes and access to affordable childcare. Family breakdown is expensive from a personal and welfare payment standpoint, and so it is to the state’s advantage to pursue policies that respond to people’s needs at different points in the life cycle. Labour market policies
tend to be of the ‘single issue’ variety, such as equal pay, the minimum wage, maternity or paternity leave. Pension arrangements, in contrast, tend to be centred on the individual rather than the household or family. Caring for ageing relatives or a sick partner is a good example of how unexpected events can affect employment prospects in unpredictable ways. Data on the Carers Allowance, a UK benefit for people with caring
responsibilities, show that women are the main carers, with their numbers peaking between ages 35 and 59. Some care durations last 10 years or more – although the average is much less. The same data show that male carers are much fewer, but gradually increase in number with age – presumably looking after a sick parent or partner.
An increasingly common phenomenon is overlapping caring responsibilities towards children and elderly parents, which are demographic in origin. The affected cohort has been dubbed the ‘sandwich’ or ‘pivot’ generation, but how predictable is this eventuality and what can be done? Using newly available data on health, it should be possible to model with greater clarity the prospective timing and duration of sandwich years. This would enable the development of bespoke insurance policies and financial products, such as care annuities, to tide people over the loss of income8.
Although a full analysis is beyond the scope of this research, a simple rule of thumb is proposed for determining the potential number of sandwich years, based on the birthdays of the youngest child and oldest grandparent.9
Consider three generations with the middle one caring for the generation on either side. If the age at which children attain independence is and the age at which elderly care starts is , then the condition for sandwich years to occur is , where is the youngest child’s year of birth and is the oldest grandparent’s year of birth, with the number of sandwich years given by . For example, assume the child was born in 1993 and the grandparent in 1920; let equate to adulthood, i.e. age 18, and the age of infirmity be 85. The formula predicts up to six sandwich years in this example – depending on when the grandparent dies. Clearly, this would not have arisen had the youngest child been born six years earlier.
8. Mayhew, L.D., D. Smith and B. Rickayzen (2017) Flexible and affordable methods of paying for long-term care insurance (forthcoming, North American Actuarial Journal)
CSFI
Implications: the employment gap
The cost of working-age disability-related benefits is a longstanding issue. Numerous government attempts over many years have not reduced the problem by nearly enough. There is controversy, for example, over the issue of whether older long-term unemployed people are simply ‘parked’ on disability benefits until they qualify for the state pension.
A government report published in November 2017, ‘Improving Lives: the future of work, health and disability’, set out how the aim of seeing one million more people in employment, over the next decade, might be achieved. It proposes a target of halving what it calls the disability employment gap – the difference between the employment rates of disabled and non-disabled people. Action recommended for employers ranges from recruitment and retention of disabled workers to managing employee ill health.
While the long-term aim must be to improve the capacity for people to work for longer through health improvement, in the short term there is a transitional gap caused by rises in the SPA, affecting women in particular, and the large cohort of disabled people of older working age.
Some have criticised the legal framework allowing people to access pension savings from 55, saying that it depletes the pot too early. But there are two
important reasons for allowing access 10 years before the SPA (and as that rises, this may become even more important).
The first is as a bridge to the state pension, covering a decline in earnings from about the age when, as this report shows, it becomes more likely. The second is that the lump sum can be used to pay off debt, including mortgage debt, so reducing outgoings at a time when earnings go into decline or become less certain.
The ‘Independent Review of the State Pension Age’, led by John Cridland (presented to Parliament in March 2017), suggests a ‘Mid-Life MOT’ to provide holistic financial advice with a 30-year time horizon. It is envisaged that employers would be the facilitators. Since most employers have no experience of this, the most effective provider of advice and guidance is the financial services industry, which is more used to dealing with individual financial circumstances.
CSFI
Chapter 3:
Earnings and pension adequacy
over the life cycle
The traditional career path of staying in one job throughout one’s working life is no longer the norm; instead people are more likely to have one profession but multiple jobs with several employers. This is why a good education and professional qualifications are an important form of income protection – a so-called ‘meal ticket’ for life. The bottom line is that the ability to save, start a family, buy a house and pay off loans is related to income over the life cycle, where the main form is remuneration from work.
For those who have paid down debt and accumulated wealth, income streams will tend to diversify, and having a job becomes less important. For others, work remains the main source of income – but, as we have seen, the ability to work is also dependent on health. In the UK, there are 2.9 million working-age people claiming disability benefits10 worth £36bn a year (the actual number who are
economically inactive and disabled is closer to 3m, based on the LFS, but not everyone claims or is eligible). DWP data show that of the total number of disability benefit claimants, around 48% also claim housing benefit, adding another estimated £7bn to the cost.
The question addressed in this chapter concerns the ability of men and women to build up a private, or defined-contribution (DC), pension during careers that may be interrupted by spells of inactivity and job change, or shortened by ill health, disability or other circumstances. The results are presented in tabular
form along the lines of: ‘If I worked for x years and my income was the typical average for my age, what size of pension pot could I accumulate?’
Clearly, it is not possible to know for certain what investment returns will be, how much income you will have, whether you will become sick or disabled, or the ultimate size of your pension pot(s). However, the issue is strategically important for three reasons. The first is the demise of defined-benefit (DB) pension schemes based on length of service and final salary. These arrangements are costly to employers and do not fit neatly with modern flexible career paths. Second, the gap left by falling DB provision needs to be filled by other schemes – typically DC, in which the individual bears the risk in terms of how much to save, investment performance and when – and how – to cash in a pension. Third, the higher SPA will force people to consider how to cover any income gap without necessarily having to work for longer.
We choose as our example a person, man or woman, who earns the average for his or her age over the life cycle. Bearing in mind variations in the pattern of pension contributions, we assume that a person can start or terminate contributions at any time, depending on their situation and the job they are in. In general, the sooner a person starts to save for a pension, the longer funds will be invested and the greater the eventual returns. For interrupted careers, contributions may cease for a period before resuming, and so the eventual pension pot will be smaller.
CSFI
Average annual earnings by
age and gender
Men and women’s gross annual average earnings by year of age are shown in Box 4. Based on ONS data from the Annual Survey of Hours and Earnings (ASHE), the chart combines full and part-time work to derive a fair representation of the earnings potential of individuals, regardless of the hours worked. Although the data are sparse for people above the SPA or below 20, and do not include other income sources, we find that age-related male annual earnings closely follow a parabolic shape, peaking at age 47. The roots of the parabola cross the axis at 15 and 79 when notional average gross income is zero, suggesting a theoretical work span of 64 years! The picture for women is distorted due to the greater incidence of part-time working and interrupted careers, the combined effect of which is to depress the gross average. For this reason, the figures are not representative of their earnings potential. However, if we were to compare men and women in full-time work, we would still find that annual earnings for women are lower, at £28,000 compared with £37,000, based on ASHE data. It is also apparent that the same parabolic pattern does not apply to women, reflecting the greater complexity of their working patterns. For the purpose of building a pension, it is life-time earnings that are relevant, so we need to weight the averages by economic activity rates at each age.
Taking all this into account, the life-time average earnings of men are around 80% greater than for women, assuming that the relationship between income, age and economic activity holds true over time. Chart (b) in Box 4 shows average earnings weighted by age-related rates of economic activity. Since activity rates are always less than 100%, the chart shows average earnings to be considerably lower because it includes those
working and not working. The gap between weighted and unweighted earnings expands with age, as inactivity increases.
If the pattern in Box 4 in 2015 is compared with that of 2005, we find that nominal earnings were more at every age in 2015. However, after uprating earnings data from 2005, using changes in the Consumer Prices Index, we find that male gross annual earnings, in real terms, are lower in 2015 between ages 17 and 55 and higher after 55. The peak year for earnings in 2005 was 44, compared with 47 in 2015. In an ageing population, it is reasonable to expect the age at which earnings peak to increase over time and rates of economic activity to improve. Indeed, this is strategically important for the economy.
The evidence suggests that the purchasing power of incomes has fallen at younger ages compared with 2005, but increased later in life. The Bank of England has drawn attention to the fact that productivity levels and real wages, which are closely linked, are still not back to 2008 levels, although the total number of hours worked has increased (see Bank of England Inflation Report, August 2017). Poor productivity, compared with competitors in global markets, is seen as a major weakness of the UK economy, which could get worse as the population ages.
Prospects for income in retirement are bound to be uncertain, but for them to improve three conditions must be satisfied. First, the age at which gross average earnings peaks needs to rise to improve work incentives; second, economic activity rates need to improve, especially at older ages, to boost income and tax
CSFI
Box 4: Average earnings over the life cycle in 2015 (Source: ONS ASHE)
(a) Male and female gross average annual earnings 2015
(b) Weighted and unweighted male gross average annual earnings
Key: Weighted = Adjusted for economic inactivity
Source: ONS, ASHE
0 5,000 10,000 15,000 20,000 25,000 30,000 35,000 40,000 45,000 50,000
15 20 25 30 35 40 45 50 55 60 65 70 75 80
G ro ss a nn ua l a ve ra ge e ar ni ng s Age Men Women 0 5,000 10,000 15,000 20,000 25,000 30,000 35,000 40,000 45,000 50,000
15 20 25 30 35 40 45 50 55 60 65 70 75 80
G ro ss a nn ua l a ve ra ge e ar ni ng s Age Unweighted Weighted 0 5,000 10,000 15,000 20,000 25,000 30,000 35,000 40,000 45,000 50,000
15 20 25 30 35 40 45 50 55 60 65 70 75 80
G ro ss a nn ua l a ve ra ge e ar ni ng s Age Men Women 0 5,000 10,000 15,000 20,000 25,000 30,000 35,000 40,000 45,000 50,000
15 20 25 30 35 40 45 50 55 60 65 70 75 80
CSFI
Impact of working patterns on
defined contribution pensions
Notwithstanding pension arrangements in the public sector, the closure of DB schemes to new members in the private sector and the rise of DC have switched the onus of responsibility for pension saving from the enterprise to the individual. Money paid into a private pension scheme by the individual, plus the tax rebate, and by the employer is invested by the pension provider.
The amount people will ultimately receive depends on how much was paid in, how well the investments have done and how they decide to take the money out. They can leave it invested and draw down regular, or irregular, payments; take out a lump sum (a quarter of accumulated funds can be withdrawn tax free); or use all or part to buy an annuity (See the ‘Implications’ panel at the end of this chapter). Individuals may have more than one workplace scheme. For example, the government estimates that people will have an average of 11 jobs during their careers, which could mean 11 different pension pots.11 They may also have a
personal pension – self invested or with an asset manager. The number of people with DC schemes has been boosted by the introduction of auto-enrolment (AE) in workplaces. The employer must automatically enrol employees and make mandatory contributions, unless the individual opts out. In December, the Department for Work and Pensions (DWP) published: “Automatic Enrolment Review 2017: Maintaining the Momentum”. This proposes lowering the age of entry to 18, from 22. While the level of earnings that triggers AE would be kept at £10,000, once that is reached the proposal is that contributions should be made on every pound earned (compared with the current start point of £5,876.).
A key issue remains contribution levels. Even when the regime is fully implemented in 2019-20 (and not until the mid-2020s for younger workers), the amount being saved will only be 8% of earnings, with half coming from the employee and the rest from the employer (3%) and the tax rebate (1%).
There are some obvious differences between DC schemes and entitlement to the state pension. The value of the latter depends on the number of years of national
insurance contributions, and can include care credits. The equivalent of 35 years is needed to qualify for the full ‘new’ state pension of £159.55 a week, or £8,297 a year, in 2017-18. The amount that will be received is known with some certainty in advance of reaching the SPA.
With private or workplace schemes, there is no income guarantee. The outcome is the amount accumulated before the individual decides to access it, which they can do from 55. Career breaks for caring do not count. This disadvantages women, who have lower average annual earnings and are more likely to have interrupted careers. The breaks make job switches more common, and that can lead to a proliferation of pension pots. If they work part-time, perhaps in more than one job, they may not earn enough in any one place to reach the threshold for auto-enrolment. For both men and women who have contributed to a series of pension schemes, it is difficult to see all their pots in one place or to get information about how much they will eventually accumulate. A ‘pensions dashboard’ is due to be launched in 2019, following work by an ABI-led project group and with the DWP leading on the government side. While this may help people to plan for retirement, it does not produce predictable pension income for elements other than the state pension. This report recommends the provision of more realistic guides, or bespoke calculators, which combine contribution periods with various start and end ages, and different crystallisation points. This would not replace arrangements enjoyed by higher earners, who make lump sum contributions from time to time, but it would assist those on more modest earnings, who are considering whether to add to their pension savings.
Box 5 illustrates this for men and women by single year of age. It is assumed that the benefits are taken at 65. Contribution levels are based on a percentage of average annual gross earnings, and the durations are based on 10-year segments to keep the size of the tables manageable. The illustrative contribution rate is 10% of salary per annum and the real rate of investment return is 2.5%. Table entries represent the amount that would be accumulated at age 65. To find the outcomes forpot values, it is necessary to pick a start and end age during which contributions are made. If a person has more than one contribution spell because of a career interruption or is in more than one scheme, the pot values of both spells can be added together.
CSFI
Box 5: Pension pots based on gross annual average earnings by age (£000s)
(a) Men
End age
Start age 20 25 30 35 40 45 50 55 60 65
20 0 28 68 118 175 236 297 358 413 458
25 0 47 97 154 215 276 337 392 454
30 0 59 116 177 239 299 354 400
35 0 68 129 190 251 306 352
40 0 73 134 195 250 295
45 0 74 134 189 235
50 0 73 127 173
55 0 67 112
60 0 56
65 0
A man earning the gross national average salary for his age and contributing 10% towards a pension each year, compounded annually, would accumulate a pension pot in the ranges given, assuming a real investment return of 2.5% pa. It is also assumed that the benefits would be taken at 65 and so would accrue to that age. For example, a man saving for a pension from age 30 to 55 would accumulate a pot worth £299,000.
(b) Women
End age
Start age 20 25 30 35 40 45 50 55 60 65
20 0 22 54 89 126 162 196 230 260 285
25 0 37 73 110 145 180 213 244 257
30 0 42 79 115 150 183 214 238
35 0 44 80 115 148 179 203
40 0 43 78 111 142 166
45 0 42 75 106 130
50 0 40 71 95
55 0 37 62
60 0 30
65 0