Characterisation of food product innovation with reference to bioactive functional food product development : an Asia Pacific study : a thesis presented in partial fulfilment of the requirements for the degree of Doctor of Philosophy at Institute of Food,
229
0
0
Full text
(2) Characterisation of food product innovation with reference to bioactive functional food product development: an Asia-Pacific study. A thesis presented in partial fulfilment of the requirements for the degree of Doctor of Philosophy at. Institute of Food, Nutrition and Human Health Massey University, New Zealand. by. Rao Sanaullah Khan. July 2014. I.
(3) DECLARATION The thesis entitled, “Characterisation of food product innovation with reference to bioactive functional food product development: an Asia-Pacific study” is submitted to Massey University for the degree of Doctor of Philosophy. I, Rao Sanaullah Khan, declare that this thesis is the outcome of my research work. The material used from other sources is acknowledged. I also certify that the work contained in the thesis, or any part thereof, has not been previously submitted for a degree, diploma or other qualifications.. Signed………………..…. Student ID: 07222191 Full Name: Rao Sanaullah Khan. II.
(4) Acknowledgement All praise be to Allah/God, the Lord of the worlds! I would like to express my sincere gratitude to Dr. John Grigor, Dr. Mike Boland, Mr Alan Win and Prof. Dr. Ray Winger for their continuous encouragement, tremendous assistance and guidance in completing this research. As advisors and supervisors, they have provided me with constructive critiques to refine the contents. The completion of this research work would not be possible without their valuable support and guidelines. Their extensive knowledge, strong analytical skills and commitment to the excellence of research and teaching have truly benefited this thesis. A special thanks to Dr. Jones Beatrix and one of his PhD student (Insha ullah) for guiding me in doing the statistical analysis. I would also like to acknowledge Massey University for providing excellent research and student facilities. All the participants of this research (Food Manufacturing companies in New Zealand and Singapore) have provided me with their time and valuable inputs to complete this research project. I extend my sincere gratitude to all of them and wish them best of luck in their future endeavours. This research has been completed with the financial support of Higher Education Commission of Pakistan and Riddet Institute New Zealand as part of the Riddet CoRE (Centre of Research Excellence) Platform 4.3 Future Foods programme. Other collaborating partners in conducting this research in Singapore were Spring Singapore and Food Innovation Resource Centre, Singapore. Their services cannot be ignored in succeeding this research project to its completion. Last, but not least, many thanks to all my family members, friends and colleagues for their unconditional love and support throughout my PhD studies.. III.
(5) Publications 1. Khan, R. S., Grigor, J., Winger, R. J., & Win, A. (2013). Functional food product development-opportunities and challenges for food manufacturers. Trends in Food Science & Technology(30), 27-37. This article was cited in few days of its publication in numerous places such as; http://www.nutraingredients.com/Research/New-innovation-models-are-needed-to-boostthe-functional-food-NPD-processes http://eurobiz.jp/2013/03/proof-positive/. 2. Khan, R. S., Grigor, J., Win, A., & Boland, M. (2013). Differentiating aspects of product innovation processes in the food industry: an exploratory study on New Zealand. British Food Journal (accepted for publication). Conference New Zealand Institute of Food Science Technology (NZIFST) conference 2011. Firm orientation and NPD approaches towards functional food development: A census of New Zealand food manufacturers (Poster Presentation). IV.
(6) Abbreviations NPD= New Product Development FFPD= Functional food product development FF= Functional foods. MNE= multinational enterprise MO= Market oriented PDO= Product oriented PRO= Process oriented ORO= Organisational oriented IRGS= To increase range of goods/services IMS= To increase market share ENMO= To exploit new market opportunities. IRC= To increase responsiveness to consumers RC= To reduce cost IKSC= To increase knowledge sharing with consumers. V.
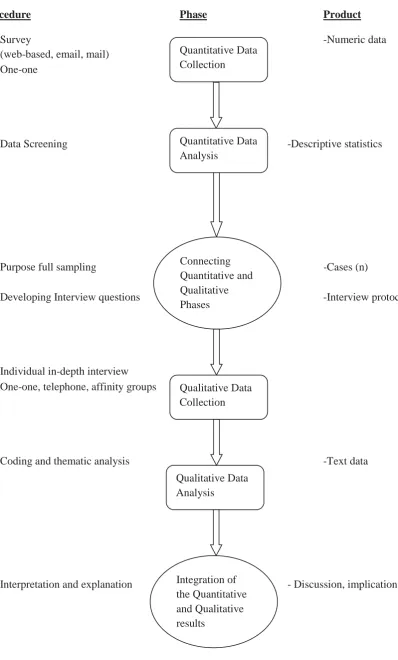
(7) Table of contents DECLARATION .................................................................................................................... II ABSTRACT .............................................................................................................................. 1 1.. INTRODUCTION ............................................................................................................ 3 1.1. BACKGROUND .................................................................................................................. 3 1.2. RESEARCH PROBLEM .................................................................................................... 3 1.3. RESEARCH QUESTIONS ................................................................................................. 4 1.4. AIMS, OBJECTIVES AND HYPOTHESIS ........................................................................... 5. 2.. REVIEW OF LITERATURE ......................................................................................... 7 2.1. INTRODUCTION ............................................................................................................. 7 2.2. DEFINITION AND HISTORY OF FUNCTIONAL FOODS ....................................................... 7 2.3. FUNCTIONAL FOODS MARKET ..................................................................................... 11 2.3.1. Global Market .................................................................................................... 11 2.3.2. USA market ........................................................................................................ 13 2.3.3. UK, Australia and New Zealand market ............................................................ 14 2.3.4. The need for functional foods development in New Zealand ............................. 15 2.4. FUNCTIONAL FOOD PRODUCT DEVELOPMENT CONTEXT ............................................. 16 2.4.1. A case of Pharmaceutical NPD approach for FFPD ........................................ 17 2.5. COMPARISON BETWEEN TRADITIONAL FOOD NPD AND FFPD ................................... 20 2.6.1. Orientation towards NPD/innovation ................................................................ 22 2.6.2. Knowledge generation in FFPD ........................................................................ 23 2.6.3. Collaborative networks and arrangements ........................................................ 25 2.6.4. Commercialization of functional foods .............................................................. 33 2.7. MANAGING COLLABORATIONS ................................................................................... 36 2.8. CONCLUSIONS AND IMPLICATIONS FOR FUTURE RESEARCH ........................................ 37. 3. METHODOLOGY ......................................................................................................... 40 3.1. INTRODUCTION ........................................................................................................... 40. A. REVIEW OF METHODOLOGIES AVAILABLE .................................................... 40 3.2 RESEARCH APPROACH ............................................................................................... 40 3.3 THEORETICAL FRAMEWORK OF RESEARCH & HYPOTHESIS ......................................... 40 3.3.1 Hypothesis development ........................................................................................ 43 3.4 RESEARCH DESIGN ..................................................................................................... 46 3.4.1 Principles of mixed-method design........................................................................ 46 3.4.2 Sequential Explanatory Design (SED) .................................................................. 47 3.5 DATA COLLECTION ..................................................................................................... 47 3.5.1 Instruments for data collection .............................................................................. 47 3.5.2 Data analysis techniques ....................................................................................... 52 B. METHODOLOGIES USED IN THE THESIS ........................................................... 52 3.6. THESIS METHODOLOGY .............................................................................................. 52 VI.
(8) 3.7 DATA COLLECTION AND ANALYSIS TECHNIQUES ........................................................ 55 3.8 QUANTITATIVE STUDY (NEW ZEALAND) .................................................................... 55 3.8.1 Design of the quantitative questionnaire ............................................................... 55 3.8.2 Ethics approval ...................................................................................................... 56 3.8.3 Overall data collection plan .................................................................................. 56 3.8.4 Target population .................................................................................................. 57 3.8.5 Sampling Frame .................................................................................................... 57 3.8.6 Sampling technique................................................................................................ 57 3.8.7 Data collection ...................................................................................................... 57 3.9 QUANTITATIVE STUDY (SINGAPORE) .......................................................................... 58 3.9.1 Design of the quantitative questionnaire ............................................................... 58 3.9.2 Ethics approval ...................................................................................................... 58 3.9.3 Data Collection Plan ............................................................................................. 58 3.9.4 Sampling Frame .................................................................................................... 59 3.9.5 Data collection ...................................................................................................... 59 3.10 QUANTITATIVE DATA ANALYSIS ................................................................................. 59 3.10.1 Reliability and validity of data ........................................................................... 59 3.10.2 Descriptive statistics .......................................................................................... 59 3.10.3 Comparative analysis......................................................................................... 59 3.11 QUALITATIVE STUDY ................................................................................................. 60 3.11.1 Data collection plan ........................................................................................... 60 3.11.2 Sampling frame .................................................................................................. 60 3.11.3 Sampling technique ............................................................................................ 60 3.11.4 Data collection tools .......................................................................................... 60 3.11.5 Qualitative questionnaire design ....................................................................... 60 3.12 QUALITATIVE DATA ANALYSIS ................................................................................... 61 4.. CHARACTERISATION OF INNOVATION PROCESS .......................................... 62 4.1. INTRODUCTION ........................................................................................................... 62 4.2. METHODS ................................................................................................................... 62 4.3. RESULTS..................................................................................................................... 62 DESCRIPTIVE STATISTICS....................................................................................................... 62 4.3.1. Demographics of food manufacturing companies ............................................. 62 4.3.2. Distribution of respondent companies ............................................................... 63 4.3.3. Demographics of interviewees ........................................................................... 64 4.4. ORIENTATION TOWARDS NEW PRODUCT DEVELOPMENT (NPD) ................................. 66 4.4.1. Innovation characteristics of food companies ................................................... 66 4.4.2. Major aims of NPD ............................................................................................ 67 4.4.3. Mode of product development ............................................................................ 68 4.4.4. Sources of idea generation for NPD .................................................................. 69 4.5. COLLABORATIVE ARRANGEMENTS ............................................................................. 69 4.5.1. Cooperative links ............................................................................................... 69 4.5.2. Dominant external partners ............................................................................... 70 4.5.3. Purpose of external collaborations .................................................................... 70 VII.
(9) 4.6. COMMERCIALIZATION TECHNIQUES ........................................................................... 71 4.6.1. Protection of innovations ................................................................................... 71 4.6.2. Main marketing tools ......................................................................................... 73 4.6.3. Major barriers to commercialization................................................................. 76 4.7. RELIABILITY AND VALIDITY OF INSTRUMENT ............................................................ 76 4.8. DISCUSSION ................................................................................................................ 80 4.8.1. Dominant features of NPD/Innovation process ................................................. 80 4.9. CONCLUSION .............................................................................................................. 83 5.. FUNCTIONAL FOOD DEVELOPMENT MOTIVATIONS AND CHALLENGES 84. 5.1 INTRODUCTION ........................................................................................................... 84 5.2 METHODOLOGY ......................................................................................................... 85 5.3 RESULTS..................................................................................................................... 85 5.3.1 Descriptive statistics .............................................................................................. 85 5.3.2 Comparative analysis of innovation process ......................................................... 92 5.3.3 Orientation towards NPD/innovations .................................................................. 93 5.3.4 Cooperative network.............................................................................................. 96 5.3.5 Commercialization techniques .............................................................................. 97 5.4 DISCUSSION .............................................................................................................. 100 5.4.1 Functional foods development trends and challenges ......................................... 100 5.4.2 Drivers of functional foods development ............................................................. 101 5.4.3 Barriers to functional foods development ........................................................... 101 5.4.4 Comparative analysis of the innovation process ................................................. 102 5.5 CONCLUSION ............................................................................................................ 105 6. QUALITATIVE EXPLORATION OF NPD/INNOVATION FEATURES............... 107 6.1. INTRODUCTION ......................................................................................................... 107 6.2. RESULTS................................................................................................................... 107 6.2.1. Salient features of participants and companies ............................................... 107 6.3. MAIN THEMES OF QUALITATIVE DATA ...................................................................... 108 6.3.1. Themes related to new product development process (NPD) .......................... 109 6.3.2. Themes related to external cooperative arrangements for NPD ..................... 111 6.3.3. Themes related to commercialization tools/techniques ................................... 115 6.3.4. Themes related to challenges to functional foods development....................... 118 6.3.5. Themes related to drivers of functional foods development ............................ 120 6.4. DISCUSSION .............................................................................................................. 121 6.4.1. NPD process .................................................................................................... 121 6.4.2. External collaborations and commercialisation strategies ............................. 122 6.4.3. Barriers and drivers to functional food development ...................................... 123 6.5. CONCLUSIONS .......................................................................................................... 123 7. COMPARISON OF THE FOOD INNOVATION PROCESS BETWEEN SINGAPORE & NEW ZEALAND .................................................................................... 125. VIII.
(10) 7.1. INTRODUCTION ......................................................................................................... 125 7.2. METHODOLOGY ....................................................................................................... 127 7.3. RESULTS................................................................................................................... 127 DESCRIPTIVE STATISTICS .................................................................................................... 127 7.3.1. Salient features of the respondent companies and participants ...................... 127 ORIENTATION TOWARDS NEW PRODUCT DEVELOPMENT (NPD) .......................................... 128 7.3.2. Innovation characteristics of food companies ................................................. 128 7.3.3. Major aims of NPD .......................................................................................... 129 7.3.4. Mode of product development .......................................................................... 130 7.3.5. Sources of idea generation for NPD ................................................................ 130 COLLABORATIVE ARRANGEMENTS ...................................................................................... 132 7.3.6. Dominant external partners ............................................................................. 132 7.3.7. Purpose of external collaborations .................................................................. 133 COMMERCIALIZATION TECHNIQUES .................................................................................... 134 7.3.8. Protection of innovations ................................................................................. 134 7.3.9. Main marketing tools ....................................................................................... 135 7.3.10. Major barriers to commercialization............................................................... 137 FUNCTIONAL FOODS DEVELOPMENT (FFD) TRENDS ............................................................ 138 7.3.11. Major food categories ...................................................................................... 138 7.3.12. Target functions/benefits .................................................................................. 138 7.3.13. Drivers of Functional Food Product Development (FFPD) ........................... 139 7.3.14. Barriers to Functional Foods Product Development (FFPD) ........................ 141 7.3.15. Desired characteristics of a successful bioactive ingredient ........................... 143 COMPARATIVE ANALYSIS .................................................................................................... 145 7.3.16. Within Singapore food manufacturing ............................................................. 145 7.3.17. Comparative demographics of food companies and participants ................... 145 Orientation towards NPD/innovations ........................................................................... 146 7.3.18. Major aims of NPD .......................................................................................... 146 7.3.19. Mode of NPD activities .................................................................................... 147 7.3.20. NPD/innovation characteristics....................................................................... 147 Cooperative network....................................................................................................... 149 7.3.21. Types of external partners ............................................................................... 149 Commercialization techniques ....................................................................................... 149 7.3.22. Protection of innovation/NPD ......................................................................... 149 7.3.23. Commercialization tools for NPD ................................................................... 149 7.3.24. Barriers to commercialization of NPD ............................................................ 150 7.4. COMPARATIVE ANALYSIS OF NEW ZEALAND AND SINGAPORE FOOD MANUFACTURERS 152 Innovation-related characteristics ................................................................................. 152 7.4.1. Major aims of NPD .......................................................................................... 152 7.4.2. Mode of NPD activities .................................................................................... 152 7.4.3. External links for NPD activities ..................................................................... 152 7.5. DISCUSSION .............................................................................................................. 154 Orientation towards NPD ............................................................................................... 154 IX.
(11) Collaborative external links for NPD ............................................................................. 154 Commercialization of NPD ............................................................................................ 155 Drivers of and barriers to functional food development ................................................ 155 Functional foods development trends and challenges .................................................... 156 Comparative analysis ..................................................................................................... 156 7.6. CONCLUSION ............................................................................................................ 157 8.. OVERALL DISCUSSION AND CONCLUSIONS ................................................... 158 8.1. 8.2.. INTRODUCTION ......................................................................................................... 158 PRACTICES THAT WOULD IMPROVE THE DEVELOPMENT OF SUCCESSFUL FUNCTIONAL FOODS ................................................................................................................................. 158 To investigate the new product development practices, major aims of NPD, mode of NPD and organizational orientation towards NPD. ...................................................... 159 8.2.1. Perceived desired characteristics of a new bioactive food ingredient ............ 163 8.3. INTER AND INTRA INDUSTRY COMPARISON .............................................................. 163 8.4. CONCLUSIONS AND IMPLICATIONS FOR RESEARCH AND PRACTICE ........................... 164 8.5. LIMITATIONS AND FUTURE RESEARCH ...................................................................... 166 REFERENCES..................................................................................................................... 167 APPENDIX I: EXAMPLES OF FUNCTIONAL FOOD PRODUCTS .......................... 181 APPENDIX II – INVITATION LETTER TO PARTICIPATE IN SURVEY (NEW ZEALAND)........................................................................................................................... 182 APPENDIX III- INITIAL RESPONSE FORM ................................................................ 183 APPENDIX IV- QUANTITATIVE QUESTIONNAIRE FOR NEW ZEALAND ........ 184 ............................................................................................................................................ 187 APPENDIX V- LETTER TO NON-RESPONDING COMPANIES .............................. 197 APPENDIX VI- REASONS FOR NON-RESPONSE ...................................................... 198 APPENDIX VII- INVITATION FOR PARTICIPATING IN QUALITATIVE STUDY 199 APPENDIX VIII- AVAILABILITY FORM FOR QUALITATIVE STUDY ............... 200 APPENDIX IX- QUESTIONNAIRE FOR QUALITATIVE INTERVIEWS ............... 201 APPENDIX X- INVITATION EMAIL MESSAGE TO FOOD COMPANIES (SINGAPORE) ..................................................................................................................... 203 APPENDIX XI- QUESTIONNAIRE FOR ONLINE QUANTITATIVE SURVEY (SINGAPORE) ..................................................................................................................... 204. X.
(12) List of Figures FIGURE 2. 2. GLOBAL RETAIL SALE VALUE OF FUNCTIONAL FOODS ((EUROMONITOR, 2010A, 2010C) ............................................................................................................................... 12 FIGURE 2. 3. COMPARATIVE MARKET SIZE OF VARIOUS ASIAN COUNTRIES OVER THE LAST FIVE YEARS (EUROMONITOR, 2013A) ........................................................................................ 12 FIGURE 2. 4. FORECAST GROWTH OF FUNCTIONAL FOOD MARKET IN ASIA (EUROMONITOR, 2013A)............................................................................................................................... 12 FIGURE 2. 5. FUNCTIONAL FOOD MARKET IN THE USA (EUROMONITOR, 2013A) ...................... 13 FIGURE 2. 6. HEALTH &WELLNESS AS % OF TOTAL MARKET IN USA (EUROMONITOR, 2013A)13 FIGURE 2. 7. COMPARATIVE PROJECTED FORECAST OF THE VALUE OF THE FUNCTIONAL FOOD MARKET IN CHINA AND USA (EUROMONITOR, 2013A) ..................................................... 14 FIGURE 2. 8. COMPARATIVE FUNCTIONAL FOOD MARKET IN UK, AUSTRALIA AND NEW ZEALAND (EUROMONITOR, 2009A, 2010B, 2013A) ........................................................... 14 FIGURE 2. 9. COMPARATIVE FORECASTED RETAIL VALUE OF FUNCTIONAL FOOD MARKET (EUROMONITOR, 2013A).................................................................................................... 15 FIGURE 2. 1. CONCEPTUAL PRESENTATION OF FUNCTIONAL FOODS DEVELOPMENT (FREWER ET AL., 2003) .......................................................................................................................... 18 FIGURE 2. 10. GENERAL PATTERN OF NEW FUNCTIONAL FOOD DEVELOPMENT (JONES & JEW, 2007). ................................................................................................................................ 24 FIGURE 2. 11. FOOD INGREDIENT SUPPLIERS AND FULL-SERVICE PROVIDERS (SADLER, 2005). . 26 FIGURE 2. 12. POTENTIAL NEW COLLABORATORS/COMPETITORS IN FUNCTIONAL FOOD INDUSTRY (RAY, 2004; SARKAR & COSTA, 2008) ............................................................. 29 FIGURE 2. 13. KEY FACTORS OF PROCESSED FOODS MARKET MATURITY ................................... 34 FIGURE 3. 1. CORNERSTONES OF SUCCESSFUL NEW FUNCTIONAL FOOD PRODUCT DEVELOPMENT PROGRAM........................................................................................................................... 42 FIGURE 3. 2. THEORETICAL FRAMEWORK OF RESEARCH ........................................................... 43 FIGURE 3. 3. APPROACHES TO MIXED-METHOD RESEARCH DESIGN (GREENE ET AL., 1989). ..... 47 FIGURE 3. 4. OVERVIEW OF THE DATA COLLECTION PLAN FOR QUANTITATIVE SURVEY ............ 57 FIGURE 4.1. PARTICIPANTS EXPERIENCE (YEARS) IN FUNCTIONAL FOOD PRODUCT DEVELOPMENT ................................................................................................................... 65 FIGURE 4. 2. EXPERIENCE IN NEW PRODUCT DEVELOPMENT BASED UPON NUMBER OF NPS DEVELOPED. ...................................................................................................................... 65 FIGURE 4. 3. VARIOUS SOURCES OF IDEA OF GENERATION IN NEW FUNCTIONAL FOODS DEVELOPMENT ................................................................................................................... 69 FIGURE 4. 4. PROPORTION OF COOPERATIVE LINKS FOR NPD ................................................... 70 FIGURE 4. 5. TYPES OF EXTERNAL PARTNERS IN THE FOOD MANUFACTURING INDUSTRY .......... 70 FIGURE 4. 6. PURPOSES OF COOPERATIVE ARRANGEMENTS AMONG THE FOOD MANUFACTURING COMPANIES ........................................................................................................................ 71 FIGURE 4. 7. COMMERCIALIZATION TOOLS FOR PROTECTING THE INNOVATIONS ...................... 72 FIGURE 4. 8. MAJOR MARKETING TOOL FOR NPD/INNOVATIONS .............................................. 73. XI.
(13) FIGURE 5. 1. FUTURE FFNPD INTEREST OF FOOD MANUFACTURING COMPANIES IN VARIOUS FOOD CATEGORIES ............................................................................................................. 85 FIGURE 5. 2. FUTURE NPD INTEREST OF FOOD COMPANIES IN TARGET FUNCTION OF HUMAN PHYSIOLOGY ...................................................................................................................... 86 FIGURE 6. 1. THE MAIN THEMES OF NPD PROCESS DESCRIPTION ............................................ 109 FIGURE 6. 2. MAIN THEMES OF COLLABORATIONS FOR NPD................................................... 112 FIGURE 6. 3. MAIN THEMES RELATED TO COMMERCIALIZATION TECHNIQUES......................... 115 FIGURE 7. 1. PROPORTION OF COOPERATIVE LINKS FOR NPD ................................................. 132 FIGURE 7. 2. FUTURE NPD INTEREST OF FOOD MANUFACTURING COMPANIES IN VARIOUS FOOD CATEGORIES .................................................................................................................... 138 FIGURE 7. 3. FUTURE NPD INTEREST OF FOOD COMPANIES IN TARGET FUNCTION OF HUMAN PHYSIOLOGY .................................................................................................................... 138. XII.
(14) List of Tables TABLE 2. 1. DEFINITION OF FUNCTIONAL FOODS AS DEFINED BY VARIOUS GOVERNING BODIES IN JAPAN, USA AND EUROPE (H. H. BUTCHKO ET AL., 2005) .................................................. 9 TABLE 2. 2. A SUMMARIZED COMPARISON OF MAJOR FACTORS INFLUENCING TRADITIONAL FOOD NPD AND FFPD IN THE LIGHT OF CURRENT LITERATURE ......................................... 21 TABLE 2. 3. REORIENTATION OF PORTFOLIO TOWARDS LONG-TERM H&W COMMITMENT (EUROMONITOR, 2009B) .................................................................................................... 23 TABLE 2. 4. EMERGING TRENDS IN COLLABORATIVE NPD ARRANGEMENTS IN THE FOOD INDUSTRY .......................................................................................................................... 27 TABLE 2. 5. COMMERCIALIZATION TRENDS IN NEW FUNCTIONAL FOOD PRODUCTS (SADLER, 2005; SARKAR& COSTA, 2008) ......................................................................................... 35 TABLE 3. 1. TYPES OF QUESTIONNAIRE AND THEIR SALIENT FEATURES (BERI, 2008)................ 48 TABLE 3. 2. COMPARISON OF ONLINE DATA COLLECTION TOOLS (GORDON & MCNEW, 2008). 49 TABLE 3. 3. A PRESENTATION OF SEQUENTIAL MIXED METHOD DESIGN (IVANKOVA ET AL., 2006) ................................................................................................................................. 54 TABLE 3. 4. SUMMARY OF DATA COLLECTION TECHNIQUES AND ANALYSIS .............................. 55 TABLE 4. 1. REGION-WIDE DISTRIBUTION OF FOOD COMPANIES ACROSS NEW ZEALAND .......... 63 TABLE 4. 2. DISTRIBUTION OF RESPONDENT COMPANIES ACROSS POPULATION BASED UPON EMPLOYEE SIZE .................................................................................................................. 64 TABLE 4. 3. SALIENT FEATURES OF SAMPLED COMPANIES AND RESPECTIVE PARTICIPANTS ..... 66 TABLE 4. 4. FREQUENCY SCORE OF RANKING ORDER FOR ORIENTATION TOWARDS NPD/INNOVATION ............................................................................................................. 67 TABLE 4. 5. MAIN AIMS OF NPD (2008-11) .............................................................................. 67 TABLE 4. 6 OVERALL MODE OF NPD (2008-11)........................................................................ 68 TABLE 4. 7. FREQUENCY SCORE OF RANKING ORDER FOR “PROTECTION OF INNOVATIONS”. .... 73 TABLE 4. 8. FREQUENCY SCORE OF RANKING ORDER FOR “MAIN MARKETING TOOLS”. ............ 75 TABLE 4. 9. FREQUENCY SCORE OF RANKING ORDER FOR “MAJOR BARRIERS TO COMMERCIALIZATION”. ..................................................................................................... 76 TABLE 4. 10. MEASURES OF THE INSTRUMENT AND THEIR CRONBACH’S ALPHA VALUES ......... 77 TABLE 4. 11. FACTOR ANALYSIS FOR CONSTRUCT MEASURES ................................................... 79 TABLE 4. 12. COMPARATIVE SIZE DISTRIBUTION OF FOOD AND BEVERAGE MANUFACTURING ENTERPRISES (2007) .......................................................................................................... 80 TABLE 5. 1. FREQUENCY SCORE OF RANKING ORDER FOR “MAJOR DRIVERS OF FFPD”. ........... 87 TABLE 5. 2. FREQUENCY SCORE OF RANKING ORDER FOR “MAJOR BARRIERS TO FFPD”. ......... 89 TABLE 5. 3. FREQUENCY SCORE OF RANKING ORDER FOR “DESIRED CHARACTERISTICS OF A NEW BIOACTIVE FOOD INGREDIENT”. ......................................................................................... 91 TABLE 5. 4. SALIENT FEATURES OF SAMPLED COMPANIES AND RESPECTIVE PARTICIPANTS ...... 93 TABLE 5. 5. FIRM ORIENTATION TOWARDS INNOVATION/NPD.................................................. 95 TABLE 5. 6. COMPARATIVE COLLABORATIVE NPD EXTERNAL PARTNERS FOR VARIOUS RELATED ACTIVITIES ......................................................................................................................... 97 TABLE 5. 7. COMPARATIVE COMMERCIALIZATION TECHNIQUES OF FOOD COMPANIES .............. 99 TABLE 6. 1. SALIENT FEATURES PARTICIPANTS AND COMPANIES ............................................ 108 TABLE 6. 2. SUMMARY OF MAIN THEMES/CODES..................................................................... 109 TABLE 7. 1. COMPARISON OF SINGAPORE AND NEW ZEALAND ............................................... 126 XIII.
(15) TABLE 7. 2. SALIENT FEATURES OF SAMPLED COMPANIES AND RESPECTIVE PARTICIPANTS ... 128 TABLE 7. 3. FREQUENCY SCORE OF RANKING ORDER FOR ORIENTATION TOWARDS NPD/INNOVATION ........................................................................................................... 129 TABLE 7. 4. MAIN AIMS OF NPD (2009-12) ............................................................................ 129 TABLE 7. 5. OVERALL MODE OF NPD (2009-12)..................................................................... 130 TABLE 7. 6. FREQUENCY SCORE OF RANKING ORDER FOR INGREDIENT SUPPLIERS”, AS SOURCES OF NEW IDEAS .................................................................................................................. 131 TABLE 7. 7. FREQUENCY SCORE OF RANKING ORDER FOR “EXTERNAL COOPERATIVE LINKS FOR CONDUCTING NPD” ......................................................................................................... 133 TABLE 7. 8. FREQUENCY SCORE OF RANKING ORDER FOR “PURSPOE OF EXTERNAL COOPERATIVE LINKS”. ............................................................................................................................ 134 TABLE 7. 9. FREQUENCY SCORE OF RANKING ORDER FOR “PROTECTION OF INNOVATIONS”. .. 135 TABLE 7. 10. FREQUENCY SCORE OF RANKING ORDER FOR “MAIN MARKETING TOOLS”. ........ 136 TABLE 7. 11. FREQUENCY SCORE OF RANKING ORDER FOR “MAJOR BARRIERS TO COMMERCIALIZATION”. ................................................................................................... 137 TABLE 7. 12. FREQUENCY SCORE OF RANKING ORDER FOR “MAJOR DRIVERS OF FFPD”. ....... 140 TABLE 7. 13. FREQUENCY SCORE OF RANKING ORDER FOR “MAJOR BARRIERS TO FFPD”. ..... 142 TABLE 7. 14. FREQUENCY SCORE OF RANKING ORDER FOR “DESIRED CHARACTERISTICS OF A NEW BIOACTIVE FOOD INGREDIENT”. ............................................................................... 144 TABLE 7. 15. SALIENT FEATURES OF SAMPLED COMPANIES AND RESPECTIVE PARTICIPANTS .. 146 TABLE 7. 16. FIRM ORIENTATION TOWARDS INNOVATION/NPD.............................................. 148 TABLE 7. 17. COMPARATIVE COLLABORATIVE NPD EXTERNAL PARTNERS FOR VARIOUS RELATED ACTIVITIES ........................................................................................................ 149 TABLE 7. 18. COMPARATIVE COMMERCIALIZATION TECHNIQUES OF FOOD COMPANIES .......... 151 TABLE 7. 19. COMPARISON OF INNOVATION PROCESS CHARACTERISTICS OF NEW ZEALAND AND SINGAPORE ...................................................................................................................... 153. XIV.
(16) Abstract Functional foods, being one of the major food categories of the global health and wellness market, are becoming a major focus of new product development (NPD) in the food industry. These food products are associated with a higher return on investment by securing competitive advantage. The development of functional foods is more complex than traditional food New Product Development (NPD), calling for a concerted effort from researchers and NPD experts to explore and understand the functional food product development (FFPD) process in more detail. The current review in this field has reported that there is a need to evolve from a traditional NPD approach, towards an integrative and innovative approach involving cooperative networks and techniques of commercialization. However there is little practical evidence on how much progress has been made to date. Therefore this research was designed to investigate the food product innovation process of food manufacturing in the Asia-Pacific region (New Zealand and Singapore) with reference to functional foods development by applying a mixed-method approach i.e., quantitative and qualitative techniques. Results showed (22% response in New Zealand) that overall a market oriented NPD approach dominated most of the factors of the innovation process in the food manufacturing sector. Major aims and mode of product development indicated a closed NPD approach (>80% NPD done alone) where increasing the range of goods and service to increase the responsiveness to customers and consumers was ranked the highest. Similarly cooperative networks seem to be dominated by ingredient suppliers and customers. These kinds of approaches are again an indication of a traditional NPD approach which was also evident in the commercialization strategies of NPD where a lower preference for protecting intellectual property rights existed. Attaining competitive edge and creating market opportunity are major drivers for FFPD. This is reflective of the business challenges in domestic markets as well as international markets where most food manufacturers fall short of attaining and maintaining competitive edge due to fierce competition in rapidly changing food markets. A comparative account of NPD practices between registered New Zealand food companies that are doing some sort of functional foods development (Group 1) and those that are not (Group 2) showed a significant difference (P<0.05) in the aims and mode of NPD between Group 1 and Group 2. Further it was observed that food companies in Group 1 have significantly (P<0.05) more diverse external collaborations with broader aims to collaborate, 1.
(17) in comparison with food companies in Group 2. This is a positive step toward developing an external resource base, which is essential in developing functional foods. This attitude should be encouraged in future innovation polices as being critical to value-added food product innovations in New Zealand. Apart from these differences, food companies are still pursuing a traditional NPD approach (independent and closed NPD); with loose Intellectual Property (IP) protection practices irrespective of type of innovation activity. Similar comparative analysis showed that there was no difference in the innovation process of food companies in Singapore. Hence it can be inferred that in New Zealand and Singapore the food manufacturing sector needs to identify the factors of sustained competitive advantage. According to a resource-based view (RBV) of attaining competitive advantage, heterogeneity in resources and capabilities is essential at a national level of innovation system to create competitive behaviour among stakeholders. The prevalent scenario of homogeneous resources and capabilities can be changed by facilitating the development of technological collaborations among the stakeholders at a national level. In relation to this change, there is a need to create awareness among the stakeholders about the factors needed for developing unique and inimitable resources, and dynamic capabilities in food manufacturing. Overall it can be concluded that the current closed NPD model is suited to incremental innovations and is exposed to exploitation by the powerful retailers (customers). Further the emerging health wellness market segment requires a change in NPD attitude where futuristic needs and demands of consumers are met through understanding consumer attitudes towards foods and their life-style. Therefore a change in NPD approach from a closed and linear model to an open and interactive NPD model is suggested to perform better in future. Research-oriented collaborations need to be strengthened in their scope and content to develop the innovative capabilities and capacities of Small & Medium Enterprises SME’s with future value-added food production. However, this is a challenging task for food companies who are small enough to employ NPD professionals to develop that interactive NPD model where internal capabilities are leveraged with external resources to enhance the novelty of product innovations. Government may have to work in close collaboration with manufacturers of functional foods to evolve a regulatory framework that is compatible with domestic and international market regulations.. 2.
(18) 1. Introduction 1.1. Background Functional foods can be defined as having “beneficial effects on target functions in the body beyond nutritional effects in a way that is relevant to health and well-being and/or the reduction of disease” (Diplock et al., 1999). These food products have shown a compound global annual growth rate of 8.6% in the 10 years to 2012 (Euromonitor, 2010d). With this type of growth, more and more food manufacturing companies are including functional food development as part of their NPD portfolio (Matthyssens, Vandenbempt, & Berghman, 2008). Other drivers rating highly on the agenda for developing these specialized healthoriented food products include attaining a competitive edge (Mark-Herbert, 2002) and securing a higher return on NPD investment (Lagorce, 2009).. 1.2.. Research problem. The orthodox NPD processes, which characterise most of the food industry’s approach to NPD, can be considered seriously flawed in developing these innovative health-oriented food products. The food industry displays higher failure rates of new products than any other manufacturing industry, with some reports estimating a new product launch failure rate of more than 90% (Hardy, 2010; Ziggers, 2005). One of the main reasons for such a high failure rate is the wide-spread reliance on ‘me too’ products. These products rarely last more than two years in the market. Conversely, truly innovative food products, which constitute less than 2% of all NPD launches, have been estimated to have a success rate of around 25% (Hardy, 2010). Therefore, the importance of re-evaluating NPD processes, with the potential for improving return on investment and maintaining a competitive edge cannot be overemphasised.. In addition food businesses need to consider customising their NPD. practices to take into consideration the changing market environment where increasing health awareness and concern among consumers is raising a number of challenges which product developers need to face (Bech-Larsen, Poulsen, & Grunert, 1999; Euromonitor, 2010a; Frewer, Scholderer, & Lambert, 2003). Successful functional food product development processes have been suggested to evolve from reorientation of NPD practices from a dominantly market-oriented to a product-oriented NPD approach (Gehlhar, Regmi, Stefanou, & Zoumas, 2009). Enhanced collaboration with external partners (Broring, Cloutier, & Leker, 2006) and building strong market brands (commercialization) (Mark-Herbert, 2004) are also considered important factors. Radical or. 3.
(19) novel functional food NPD can be expected to create a number of possibly insurmountable problems if a traditional food NPD process is adopted (Mark-Herbert, 2004; Matthyssens et al., 2008).. Besides having technical complexities, there are quite stringent regulatory. requirements to be met before the added health benefits of functional food products can be claimed in the market (B. B. Butchko & Petersen, 2006; H. H. Butchko, Petersen, & Benjamin, 2005; EU, 2000). Furthermore, food product development usually focuses on meeting consumers’ needs in the short term, with little investment in R&D activities (Broring, 2008; Broring et al., 2006; Costa & Jongen, 2006; Gehlhar et al., 2009; MarkHerbert, 2004; Matthyssens et al., 2008).. In contrast, functional food NPD demands. extended and extensive R&D activities with a comparatively longer time to development (Heasman & Mellentin, 2001; Hoban, 1998; Traill & Mueulenberg, 2002). In this scenario a collaborative NPD program with research-oriented institutions has been suggested to provide an effective means to cope with the challenges of these technological intricacies and complexities. The focus of these collaborations may be on understanding technological developments, and/or on processes related to proof of efficacy and/or meeting food labelling regulations (Barbara & Francesco, 2012). This may induce a change in the knowledge generation approach of traditional food NPD from acquiring synthetic knowledge to developing analytical knowledge (particularly in nutrition and human physiology) (Jones & Jew, 2007). Thus a new approach is likely to be needed, to supplement current NPD activities, for example adopting collaborative NPD activities to reduce the risk and cost of developing such innovative food products (Beckeman & Skjoldebrand, 2007; Ritter & Gemunden, 2003). Effective launch of functional food products and extended access to consumers for developing trust in buying these products is beyond the individual capacities and capabilities of most food companies. A network across industries (involving collaborating partners in commercialization as well) may be exploited to enhance consumer awareness and acceptance of new functional food products (Traill & Mueulenberg, 2002). However, collaborative NPD and commercialization may bring its own management challenges in terms of ownership. This requires sophisticated and comprehensive IP policies among the collaborating partners of NPD (Mark-Herbert, 2004; Sadler, 2005) to secure premium return on investment.. 1.3.. Research questions. The current literature lacks any published guidelines or standard procedures and processes for developing successful functional food products. However, a few studies have tried to 4.
(20) understand and suggest better ways of developing functional foods (Gehlhar et al., 2009; Mark-Herbert, 2004; Matthyssens et al., 2008; Traill & Mueulenberg, 2002). Therefore it is essential to empirically investigate the perceptions of drivers of and barriers to functional food product development with respect to the overall innovation process of food manufacturing companies. In this regard, a national level comparison of functional food development practices between countries may give a better understanding of innovation approaches adopted by the food companies. These practices can be benchmarked against relevant literature and recommended practices for developing functional foods. Hence an empirical study into the current NPD practices of food manufacturers in Asia-Pacific region, i.e. New Zealand and Singapore, was conducted to investigate the critical aspects of value innovation such as orientation towards innovation/NPD (Gehlhar et al., 2009; Traill & Mueulenberg, 2002), cooperative network (Chiaroni, Chiesa, & Federico., 2011; Dahlander & Gann, 2010) and commercialization techniques (Menrad, 2003; Sarkar & Costa, 2008).. 1.4.. Aims, Objectives and Hypothesis. The aims and objectives of this study were as follows: Aims: To provide insight into practices that would improve the development of functional foods. Through: x. understanding the innovation processes and practices currently used by the food manufacturing industry (in New Zealand and Singapore) and,. x. understanding the current perceptions of personnel managing functional food development.. Objectives: I.. To investigate the new product development practices, major aims of NPD, mode of NPD and organizational orientation towards NPD.. II.. To investigate the cooperative network of food companies i.e., who are the major external partners and what kind of activities are done in partnership with them.. III.. To investigate the commercialization tools of NPD such as protection of innovation (intellectual property rights), marketing tools and major challenges.. IV.. To investigate the perception of food manufacturing firms towards various drivers of FFPD 5.
(21) V.. To investigate the perception of food manufacturing firms towards various barriers of FFPD. There were number of hypothesis tested later in the thesis (a detailed description of underpinning theory is given in section 3.3.1. These hypotheses are: H1: There is a difference in NPD orientation between companies manufacturing functional foods and other food companies. H2: There is a difference in external collaborative links between companies manufacturing functional foods and other food companies. H3: there is a difference in commercialization techniques between companies manufacturing functional foods and other food companies.. 6.
(22) 2. Review of Literature 2.1.Introduction This review focuses on the need and extent that food businesses need to evolve from current traditional NPD practices to engage in successful FFPD. A brief literature-based comparison between traditional food NPD and FFPD is presented, followed by a stepwise discussion on proposed distinguishing FFPD features. This sets the context of functional food product development in the food industry; and connected to this a change is required in knowledge generation activities for functional foods development (from synthetic knowledge to analytical knowledge) and involvement of external partners/stakeholders. The subsequent section is dedicated to highlighting the importance of establishing diverse collaborative networks and arrangements for enhancing the innovation capability of the firm, with examples from current models being adopted by some leading multinational companies. Various entry strategies for new functional food products are described with examples from leading food companies in the section: commercialization of functional foods - an argument for collaborations. Some concluding propositions are given for managing these collaborations more effectively under the section; managing collaborations. Finally, overall conclusions are drawn from current literature and practices.. 2.2.Definition and history of functional foods Generally “functional foods are those foods which are aimed at improving health related conditions or preventing such conditions”(Frewer et al., 2003). Moreover, these foods have been described as nutraceuticals, nutritional foods, pharma-foods, medical foods, super foods, designer foods and functional foods (Playne, Bennett, & Smithers, 2003) providing identified health benefits. There are a number of definitions (Table 2.1). Among these definitions, the most robust and specific definition is provided by International Life Science Institute (North America and Europe). This definition stresses the importance of scientific substantiation of the effects functional foods have on human physiology beyond adequate nutrition. The major markets such as Japan, USA and Europe have different regulations and legislative frameworks to define these foods. Hence, after more than 30 years of functional food inception, there is no single universally acknowledged definition of these foods (Krystallis, Maglaras, & Mamalis, 2008). Functional food legislation has had a disjointed development through the different approaches of regulatory bodies in different countries. Historically, the surge for better 7.
(23) nutrition started early in 1950’s when researchers started to examine the relationship between nutrition and degenerative diseases such as heart problems linked to fat consumption. With ongoing research and development in healthy nutrition, a new concept emerged in the food industry, namely the concept of functional food products (Heasman & Mellentin, 2001). A more systematic and comprehensive approach adopted by the Japanese Government in 1986 led to the development of a new category of foods defined as FOSHU (Food for special Dietary Use). By 1991, under the Nutrition Improvement Law the Ministry of Health and Welfare (MHW) in Japan (1991) presented a working definition of FOSHU -“processed foods containing ingredients that aid specific bodily functions in addition to being nutritious” (Menrad, 2003; Ministry of Health, 2013; Siro, Kaplona, Kaplona, & Lugasi, 2008). These newly defined foods had the following differentiating criteria; 1. Exert health or physiological effect 2. In the form of ordinary food, not pill or capsule. 3. Part of normal routine diet. After this revolutionary start initiated by the Japanese government, USA and Europe responded with various institutions trying to define this new category of foods whilst regulatory bodies tackled the issues around how these foods fitted under current food or medicine law. In USA, Food and Drug Administration is the body which guides for making nutrient claim, structure/function claim (e.g. Calcium is good for bones) and health claim. Only health claims are required to have a pre-approval from FDA based upon publically available scientific evidence (Baker, Brady, & Mary., 2012). In Europe, General Food Law Regulation; EC178/2002, deals with all foods including functional foods or any other food. There are numerous rules under this regulation which deals with different kind of foods such as dietetic foods, supplements, novel foods etc. European Food Safety Authority (EFSA) is responsible for overseeing these rules and regulations for its implementation. For novel foods EC 258/97 is used which classify these foods/ingredients into various classes depending upon their history of use in foods (Baker et al., 2012). In Canada these kinds of food products are regulated as a sub-category of drugs. The relevant regulation for them is called Natural Health Product Regulation which defines and classifies these products and set criteria for attaining efficacy, quality and safety (Baker et al., 2012).. 8.
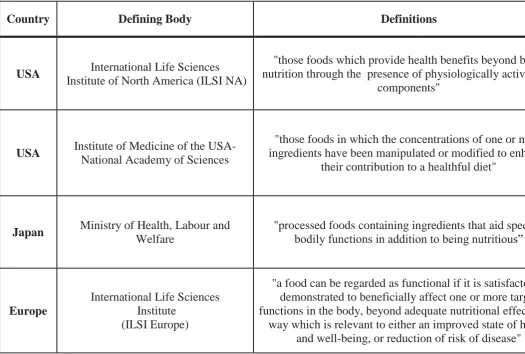
(24) Table 2. 1. Definition of functional foods as defined by various governing bodies in Japan, USA and Europe. Country. Defining Body. Definitions. USA. International Life Sciences Institute of North America (ILSI NA). "those foods which provide health benefits beyond ba nutrition through the presence of physiologically active components". USA. Institute of Medicine of the USANational Academy of Sciences. "those foods in which the concentrations of one or m ingredients have been manipulated or modified to enh their contribution to a healthful diet". Japan. Ministry of Health, Labour and Welfare. "processed foods containing ingredients that aid spec bodily functions in addition to being nutritious”. Europe. International Life Sciences Institute (ILSI Europe). "a food can be regarded as functional if it is satisfacto demonstrated to beneficially affect one or more targ functions in the body, beyond adequate nutritional effect way which is relevant to either an improved state of he and well-being, or reduction of risk of disease". 9.
(25) As the functional food market increased dramatically in value, governmental bodies in developed markets have had to tackle the issues around functional food legislation more closely. At the national level, the framework for health regulations, type of health claim and nutritional information required on the label varies significantly between nations. However, efforts are being made in EU, Australia and New Zealand to bring some sort of regional harmony to regulating these functional food products (FSANZ, 2013; "Regulation (EC) No. 1924/2006 of the European Parliament and of the Council of 20 December 2006 on nutrition and health claims made on foods," 2007). In this regard, an effort was made to bring consistency among the health regulations for these functional foods across the EU in 2006 (H. H. Butchko & Petersen, 2005; Coppens, Fernandes da Silva, & Pettman, 2006). It has resulted in laying down the basic principles of legislations for these claims. The European Food Safety Authority (EFSA) thus has issued the list of approved health claims with scientific evidence which can be used for these foods (Verhagen, Vos, Francl, Heinonen, & van Loveren, 2010). In addition the EFSA has also published a list of claims which cannot be used due to lack of scientific evidence (Coppens et al., 2006; EU, 2000). Manufacturing companies now have to be very specific in making their health claim and careful in manufacturing products to ensure efficacy (Bech-Larsen & Scholderer, 2007; Verhagen et al., 2010). Food Standards Australia New Zealand has recently published its new food standard to regulate nutrition content claims and health claims on food labels (FSANZ, 2013). This new food standard will guide the food manufacturers to make accurate claims pertaining to nutrition content and health, such as “low in fat”, and these claims need to meet the criteria set out in the standard e.g., a claim stating ‘good source of calcium’ will need to have calcium in that food more than the amount of calcium specified in the Standard. Two types of health claim have been defined in this standard i.e. a general level health claim and a high level health claim. A general level health claim refers to a nutrient or substance effect on a health function which is not a serious disease or a biomarker of a serious disease e.g. ‘calcium is good for bones and teeth’. Whereas a high level health level claim refers to a nutrient or substance in a food with its effect on serious disease or a biomarker of a serious disease e.g. ‘high calcium diets may reduce the risk of osteoporosis’ or ‘phytosterol may reduce blood cholesterol’. Functional foods from a legislative perspective could be defined as foods with substantiated health claims presented on food labels. However, for this thesis a definition adopted based on. 10.
(26) legislation is problematic. This is primarily due to the differences in legislation between countries (as described in this section) which may also be changed during the course of the study. Therefore in this research definition of functional food is as “food products that contain compounds from natural sources that have added health benefits for the human body. Examples are bioactive peptides from milk (or whey), herbal extracts (such as ginseng), omega-3 fatty acids (from fish) and lycopene (from tomatoes).”Further examples of functional food products with their functionality are presented in appendix I.. 2.3.Functional foods market 2.3.1.. Global Market. The main consumer motive for purchasing functional foods is the growing desire to use foods either to help prevent chronic illnesses such as cardiovascular disease, Alzheimer’s disease and osteoporosis, or to optimize health, for example by increasing energy, boosting the immune system or generation of wellbeing (Regmi & Gehlhar, 2005; Sadler, 2005).This need has led to one of the fastest growing food sectors, with a compound annual growth rate of 8.6% in the 10 years to 2012 (Euromonitor, 2010b). The emergence of a new market segment called ‘Health and Wellness’ reached a global value of more than US$ 700 billion in 2012 and is expected to hit US$ 1 trillion by 2017. This segment incorporates fortified/functional foods, but. also includes organic foods, “better for you” food and beverages (BFY),. “naturally healthy” (NH) foods, products catering to food intolerance, vitamins and dietary supplements, traditional herbal products, slimming products and sports nutrition. Of this market, the functional foods part alone was valued at US$168 billion in a global market that is 2.5 times the size that of vitamins and dietary supplements (Euromonitor, 2010a) 180000 160000. 140000 US$ million. 120000 100000 Global FF Market. 80000 60000 40000 20000 0 2008. 2009. 2010. 2011. 11. 2012.
(27) Figure 2. 1. Global retail sale value of functional foods ((Euromonitor, 2010a, 2010c) Functional food market retail value 30000 25000 US$ million. China 20000. India Indonesia. 15000. Japan. 10000. Malaysia Singapore. 5000 0 2008. 2009. 2010. 2011. 2012. Figure 2. 2. Comparative market size of various Asian countries over the last five years (Euromonitor, 2013a) Data for year-on-year growth shows that China, India and Indonesia are constantly growing in this segment of the functional food market (Figure 2.4). The future forecast shows that by 2017, the functional food market in China will reach more than US$ 47 billion from the current value of US$ 25 billion i.e., a 100% increase in the next five years . Other big markets in Asia are Japan and Indonesia.. FF market forecasted growth 50000. 45000. US$ million. 40000 35000. China. 30000. India. 25000. Indonesia. 20000. Japan. 15000. Malaysia. 10000. Singapore. 5000 0 2012. 2013. 2014. 2015. 2016. 2017. Figure 2. 3. Forecast growth of functional food market in Asia (Euromonitor, 2013a). 12.
(28) 2.3.2. USA market. The USA over the last five years has experienced some ups and downs mainly because of the economic recession which first hit in 2008-09 and then again in 2011. The previous five years’ data (2008-2012) indicate that the USA functional food market is maintaining a constant value of around US$ ~32 billion with health and wellness being 5.5 % of the total sales of packaged food (Euromonitor, 2013a).. FF market retail value 33500 33000. US$ million. 32500 32000. 31500. USA. 31000 30500 30000 29500 2008. 2009. 2010. 2011. 2012. Figure 2. 4. Functional food market in the USA (Euromonitor, 2013a) 5.65 5.6. % of total sale. 5.55 5.5 USA. 5.45 5.4 5.35 5.3 2008. 2009. 2010. 2011. 2012. Figure 2. 5. Health &Wellness as % of total market in USA (Euromonitor, 2013a). 13.
(29) Comparative data on projected forecasts of the functional food market growth suggest that China will overtake the USA by 2014. This is based upon current prices and fixed exchange rates (Euromonitor, 2013a). At the end of 2017, China will have a lead of approximately US$ 12,773.8 million over the USA market.. 50000 45000 40000 US$ million. 35000. 30000 25000. China. 20000. USA. 15000 10000 5000 0 2012. 2013. 2014. 2015. 2016. 2017. Figure 2. 6. Comparative projected forecast of the value of the functional food market in China and USA (Euromonitor, 2013a) 2.3.3. UK, Australia and New Zealand market. The UK, being a mature market in processed foods, is another big yet steady market for functional foods. Australia and New Zealand are comparatively new in functional foods and the market is still developing significantly. FF market retail value 6000. US$ million. 5000 4000 Australia 3000. New Zealand. 2000. UK. 1000 0 2008. 2009. 2010. 2011. 2012. Figure 2. 7. Comparative functional food market in UK, Australia and New Zealand (Euromonitor, 2009a, 2010b, 2013a). 14.
(30) Based upon current prices and previous growth patterns, it has been forecasted that New Zealand and Australia may experience steady growth in functional foods while the UK may maintain its present value (Euromonitor, 2013a) .. Based on retail value 6000. US$ million. 5000 4000 UK 3000. Australia New Zealand. 2000 1000 0 2012. 2013. 2014. 2015. 2016. 2017. Figure 2. 8. Comparative forecasted retail value of functional food market (Euromonitor, 2013a) 2.3.4. The need for functional foods development in New Zealand New Zealand is a significant food producer, producing about five times the amount of food needed to feed its population and exporting the surplus. Its food and beverage export count for 2.5% of global trade in foods and beverages (Kevin., Graeme., Russell., & Johns, 2012). The food and beverage sector in New Zealand contributes more than 50% of the export earnings from merchandise trade. This sector employs every fifth individual of the New Zealand population directly or indirectly (Mallard, 2007). Recently the New Zealand government has committed itself to lift New Zealand’s export economy from 30% to 40% of its GDP by 2025 which means a doubling of its exports (Government, 2012). This will mean lifting the export value of the food and beverage sector from 23billion NZ$ to 53billion NZ$. Adding value to food production is critically important to achieving the stated goals. In this regard the government has already started working to transform its food manufacturing enterprises from a volume and price mind-set to creating value (Government, 2012) and securing intellectual property rights (Marshall. et al., 2012); an essential factor in producing value added food products (Mark-Herbert, 2002; Matthyssens, Vandenbempt, & Berghman, 2008).. 15.
(31) The prices of manufacturing output increased to 4% while the volume for meat and dairy products fell to 10.1%. The huge drop in volume of meat and dairy with a comparatively lower drop in sales value indicates the rise in price of commodities. It was seen that dairy products prices rose to 29.6% while the other food manufacturing commodities fell to 8.4% (Ashley-Jones, 2010). This situation suggests that fluctuation in demand for dairy products in the international market dictates the fate of trade for New Zealand manufacturing industries at large. Moreover, dairy products are one of major contributors of export earnings for New Zealand in the international market. Therefore, it is critically important for the food industry of New Zealand to be versatile in manufacturing value added food products. Firstly this will reduce the sole reliance on dairy and meat produce in the international market. Secondly it will increase the return on investment and enable the food manufacturers to attain competitive edge in the global food market (Kevin. et al., 2012). The New Zealand food industry is an appropriate model for the global food industry, to develop an understanding of NPD processes for functional foods (Government, 2012; Kevin. et al., 2012). New Zealand is considered an appropriate model because: the export food industry makes products similar to those in other markets, competing successfully in international markets; the economy is that of a developed country with the typical infrastructure and legislative environment of a developed country (OECD, 2007) and the food industry size is sufficiently small to allow coverage of the whole industry. Further, New Zealand has a substantial immigrant population from all around the world and hence it can serve as a suitable place for understanding a wide range of consumer attitudes towards functional food. It is noted that New Zealand has often been used as a test market by pharmaceutical companies for similar reasons.. 2.4. Functional food product development context Over the last two decades different food, pharmaceutical and retail businesses alike have been motivated to enter this lucrative market, with the potential to gain higher returns and to generate a competitive edge (Kleef, Trijp, Luning, & Jongen, 2002; Lagorce, 2009). However, the high failure rate of conventional new food products launched into this market does not make easy reading for people managing the NPD process (Hardy, 2010; Hoban, 1998).. The product development process for new functional food products has been. described as complex, expensive and risky (Kleef et al., 2002; Siro et al., 2008).. 16.
(32) 2.4.1. Radical/discontinuous product innovation approach for FFPD. Functional food product development may be carried out on the principals of radical/discontinuous product innovation process which differ from conventional NPD approach. Because discontinuous innovations have a higher degree of technological uncertainty and longer development time with a sequence of innovations (Garcia & Calantone, 2002; Veryzer, 1998). Other factors such as lack of customer familiarity and uncertainty of suitable applications also affect the NPD method for these products. Market assessment and financial analysis prior to beginning of these products rarely possible since the customers and consumers cannot comprehend these products fully (Veryzer, 1998). Rather a prototype is developed to explore and formulate the application technology and assess the technical aspect of the product. Functional food product development can be argued to manage from the perspective of discontinuous product innovation as it involves uncertainty in technology and market. It cannot be driven by the customers as is the case for traditional food NPD because customers are usually not fully aware of proprietary new technologies and thus unable to appreciate these products (Veryzer, 1998). Therefore early involvement with customers is not favorable to test product ideas or collect data until a product application is formulated and developed. Hence conventional NPD approach of managing these product innovations may not suitable. 2.4.2. A case of Pharmaceutical NPD approach for FFPD. The literature suggests that the category of functional food products is a fusion between food technology and clinical nutrition (Heasman & Mellentin, 2001) (Figure 2.9). The basic NPD driver in pharmaceutical companies is to develop new drugs that can meet the unmet medical needs of population (Gupta, Pawar, & Smart, 2007). An increased competitive business environment has even forced the traditional linear NPD model in pharmaceutical companies to give away discovery, development and commercialization of NPD to specialist organisations. However these companies already have well established mechanism to ensure intellectual property rights and hence a higher return on investment can be expected if the product meets the unmet needs of population (Gupta et al., 2007). On similar ground the case of functional food product development in food industry may resemble closely to new pharmaceutical NPD trends where external collaborations in a well secured manner are sought to develop truly new products that can truly meet the unmet needs of consumers. The issues of health regulations and drug regulations pertaining to the development of these products need to be carefully managed by regulatory bodies to ensure protection of the. 17.
(33) consumer whilst also avoiding undue barriers to NPD innovative practices in the food area. Thus successful development can only be ensured if regulations for these products are brought into some sort of harmony to effectively guide the manufacturers (Frewer et al., 2003; FSANZ, 2013; Ray, 2004; "Regulation (EC) No. 1924/2006 of the European Parliament and of the Council of 20 December 2006 on nutrition and health claims made on foods," 2007).. Foods Food Laws. Functional Foods. Medicine Medicine Act. Health Regulations. Figure 2. 9. Conceptual presentation of functional foods development (Frewer et al., 2003) A study by Mark-Herbert in 2004 suggested “Industrial marriage” as the way forward for developing new functional food products. This implies collaborative product development by pharmaceutical and food manufacturers, with sharing of resources and skills for effective functional food development. One such example was the introduction of a probiotic product in the USA market by the joint efforts of CAG functional foods and Swedish biotech business. However, this venture suffered serious difficulties among the partners due to intellectual property rights and brand ownership issues (Mark-Herbert, 2003). The grey area where food and health markets merge (Broring et al., 2006) has generated a need for new competencies for personnel and enterprises working in functional food product development (FFPD) (Mark-Herbert, 2002). A number of important factors have been offered in the literature for successful FFPD. These include inter-industry relationships (Beckeman & Skjoldebrand, 2007; Bhaskaran, 2006; Marsh, 2003; Salavou, Baltas, & Lioukes, 2004; Siedlok, Smart, & Gupta, 2010) and research-oriented collaborative networks (Beckeman & Skjoldebrand, 2007; Broring et al., 2006; Siedlok et al., 2010).. 18.
Figure


+7


Related documents
For blended courses, regular attendance is defined as attending face-to-face instruction and academically engaging with online course material once a week at a minimum
Abstract: This study examines the unique experience of participants who during their reintegration back into the community, following a conviction for sexual offending, re-
Common Project specific Management Documents (i.e. Project Execution Plan, Project Quality Plan, Project HSSE Plan, Project Engineering Plan, Project Construction Plan, …) are
The Colour Sampler tool in the Eye Dropper tool group (tenth row of the toolbar) can be used to place multiple permanent sample points on an image to help while adjusting the
Distribution: England, Ireland, Isle of Man Notes: added by Buhl and O'Connor (2008). Platygaster (Platygaster) sterope
The ALS3 promoter also contains putative sites for several transcription factors that are known to contribute to the acti- vation of hyphal development: Efg1, Cph1, Cph2, and
In multicast communication, the scenario of handover is particularly challenging and several issues emerge with most solutions due to the handover impacts. When a multicast receiver
It is only after such developments, bank credit came into existence.Under the credit card scheme, an individual can get a credit card from a bank with a specified credit limit
