M E T H O D O L O G Y
Open Access
Optimization of flow cytometric detection and
cell sorting of transgenic
Plasmodium
parasites
using interchangeable optical filters
Ivan A Vorobjev
1,2†, Kathrin Buchholz
3†, Prashant Prabhat
4, Kenneth Ketman
1, Elizabeth S Egan
3, Matthias Marti
3,
Manoj T Duraisingh
3and Natasha S Barteneva
1*Abstract
Background:Malaria remains a major cause of morbidity and mortality worldwide. Flow cytometry-based assays that take advantage of fluorescent protein (FP)-expressing malaria parasites have proven to be valuable tools for quantification and sorting of specific subpopulations of parasite-infected red blood cells. However, identification of rare subpopulations of parasites using green fluorescent protein (GFP) labelling is complicated by autofluorescence (AF) of red blood cells and low signal from transgenic parasites. It has been suggested that cell sorting yield could be improved by using filters that precisely match the emission spectrum of GFP.
Methods:Detection of transgenicPlasmodium falciparumparasites expressing either tdTomato or GFP was performed using a flow cytometer with interchangeable optical filters. Parasitaemia was evaluated using different optical filters and, after optimization of optics, the GFP-expressing parasites were sorted and analysed by
microscopy after cytospin preparation and by imaging cytometry.
Results:A new approach to evaluate filter performance in flow cytometry using two-dimensional dot blot was developed. By selecting optical filters with narrow bandpass (BP) and maximum position of filter emission close to GFP maximum emission in the FL1 channel (510/20, 512/20 and 517/20; dichroics 502LP and 466LP), AF was markedly decreased and signal-background improve dramatically. Sorting of GFP-expressing parasite populations in infected red blood cells at 90 or 95% purity with these filters resulted in 50-150% increased yield when compared to the standard filter set-up. The purity of the sorted population was confirmed using imaging cytometry and microscopy of cytospin preparations of sorted red blood cells infected with transgenic malaria parasites. Discussion:Filter optimization is particularly important for applications where the FP signal and percentage of positive events are relatively low, such as analysis of parasite-infected samples with in the intention of gene-expression profiling and analysis. The approach outlined here results in substantially improved yield of GFP-expressing parasites, and requires decreased sorting time in comparison to standard methods. It is anticipated that this protocol will be useful for a wide range of applications involving rare events.
Keywords:Malaria,Plasmodium, Optical filter, Fluorescent proteins, Cell sorting, Rare cells
* Correspondence:[email protected]
†Equal contributors
1Immune Disease Institute and Program in Cellular and Molecular Medicine,
Children’s Hospital, D-239, 200 Longwood Avenue, 02115, Boston, MA, USA Full list of author information is available at the end of the article
Background
Plasmodium falciparumremains one of the world’s most devastating infections with official estimates of mortality from malaria ranging from 800,000 deaths to 1.2 million deaths per year [1,2]. The development of transgenic Plasmodium lines expressing green or red fluorescent proteins has enhanced the study of the parasite’s differ-ent life cycle stages through cell biological and, more recently, flow cytometry-based methods [3-6]. Fur-thermore, such transgenic lines represent excellent tools for growth-inhibition assays and parasite characterization [7-9]. However, red blood cells (RBC) exhibit strong auto-fluorescence (AF) at 620 nm due to the presence of inter-mediate products of haem metabolism (protoporphyrin) [10], and in the range of 500–540 nm, which overlaps the excitation/emission spectrum of GFP. Therefore, the major aim of this study was to optimize filter sets in order to im-prove the detection of GFP-expressing transgenic parasites. In addition, another hurdle must be overcome when sort-ing rare populations, which is essential for examination of the malaria life cyclein vivo: how to obtain sufficient cell numbers while ensuring high purity of the sorted cell population. Here, data are presented demonstrating that both of these issues can be overcome easily and cost-effectively. Based on recent advances in flow cytometer optical filter interchangeability, stages of the Plasmodium falciparum transmission cycle expressing GFP or tdTo-mato, respectively, were effectively detected and isolated. Optimization of optical filters allowed for the detection of 50-150% more GFP-expressing parasites as compared to use of filters supplied with the flow cytometer, and sorted populations were >90% pure. This can advance Plasmodium gametocyte research, since the challenge in isolating these parasite stages often lies in either low over-all number of gametocytes in certain parasite lines or in contamination of rare desired events (e.g. very young gametocytes or mature gametocytes out of a mixed popu-lation) with unwanted parasite stages (e.g. asexual stages). Based on the approaches described here, investigators will be able to rapidly evaluate optical filter efficiency using cell number and desired purity for a given level of statis-tical significance.
Methods
In vitroculture ofPlasmodium falciparumparasites and preparation of cells prior to flow cytometry analysis
ThreeP. falciparumlines were mainly used in this study: a non-fluorescent gametocyte-producing clone termed P2G12 derived from the reference strain 3D7 (P2G12 WT, [9]); and two transgenic lines derived from this clone which express GFP (164/GFP, [9]), and tandem dimer tomato fluorescent protein (164/tdT, [11]), re-spectively, from the gametocyte-specific promoter of the gene PF10_0164. Furthermore, to confirm findings with
other GFP-expressing parasite lines, this study used the P. falciparum3D7/pMAL13P1.130-GFP line, harbouring a plasmid that encodes GFP under the control of a schizont-stage promoter (schizont/GFP, gift from T. Gilberger) [12], and a P. falciparum line that constitu-tively expresses GFP from an integrated construct [13]. All parasites were cultured in vitro as described else-where [14]. Briefly, parasites were maintained in fresh type 0+ human erythrocytes (Research Blood Components, Boston, MA, USA) in complete medium containing 1% AlbuMAX II (Life Technologies, Grand Island, NY, USA), 0.5 ml of gentamycin, 5.94 g HEPES, 2.01 g of sodium bi-carbonate, 0.05 g hypoxanthine, and 10.44 g Roswell Park Memorial Institute-1640 per litre (pH 6.74). The Harvard University Ethics Committee approved use of erythrocytes from human donors. Parasite cultures were kept at 37°C in gassed chambers at 5% CO2and 1% O2. Parasite prep-aration prior to flow cytometry analysis varied for the dif-ferent lines. P2G12 WT, 164/GFP and 164/tdT were cultured in T75 flasks without a specific gametocyte-induction protocol to obtain baseline gametocyte produc-tion in asexually replicating cultures. Prior to flow cytome-try analysis, all cultures were subjected to Percoll gradient enrichment to obtain asexual late blood-stage parasites and mature gametocytes. Enriched parasites were resus-pended in RPMI-1640 medium (no phenol red) and 20% human serum. For direct comparison of the effect of fix-ation on flow cytometric detection, all three parasite lines were cultured alongside one another and split after purifi-cation, after which parasites were left unfixed or partially fixed using 0.1% paraformaldehyde (PFA) in PBS/0.1% BSA. The schizont/GFP transgenic parasites were cultured in human red blood cells. These parasites were synchro-nized using standard protocols; the resulting mature schizont stages were fixed as described above and subse-quently used for flow cytometry analysis. Parasites that constitutively express GFP were sorbitol synchronized to obtain ring stage parasites and were also fixed as described above.
Flow cytometry sorting and analysis
bandpass (BP) filters were compared: 514/30, 510/21, a set of two different 530/30 filters purchased together with the cytometers, and 510/20, 512/20, 517/20, 529/24 filters provided by from Semrock Inc (Rochester, NY, USA). To acquire the tdTomato signal, two BP filters were compared: a 576/26 optical filter purchased with the instruments and a 585/29 filter provided by Semrock Inc (spectral information on the filters is summarized in Additional file 1). As a dichroic filter a 502 longpass filter (502LP) was used (results of some experiments comparing 502LP vs 466LP fil-ter (LM01-466Di02 from Semrock Inc, which at 11 degree angle of incidence has its edge at 502 nm are summarized in Additional file 2).
The autofluorescent (AF) intensity ratio was calcu-lated using FL1/FL2 channels for the acquisition of negative ER (non-expressing FP). The FL1 channel (used for GFP acquisition) approximately corre-sponds to the peak of fluorescence of oxidized fla-vins (520–540 nm) [15,16].
Filter transmission measurement
All the filter spectra were measured using a custom-built spectrophotometer at Semrock, Inc. Additional details on the instrumentation and the measurement methods are provided in a separate white paper [17]. This instrument utilizes a double monochromator with a cooled, UV-enhanced CMOS camera in order to perform sensitive spectral measurements such as transmission through op-tical filters with very steep edges and high blocking.
Imagestream 100 analysis of sorted infected erythrocytes
After FACS sorting, sorted parasites were transferred into 50 μl tubes and subjected to imaging cytometry analysis with the Imagestream 100 (Amnis Inc, Seattle, USA). Imagery and cytometric analysis was performed using IDEAS software from Amnis Inc.
Microscopy of cytospin preparation
[image:3.595.57.539.354.696.2]Cytospin slide centrifugation was used to concentrate 100 μl of sorted parasite sample for Giemsa staining.
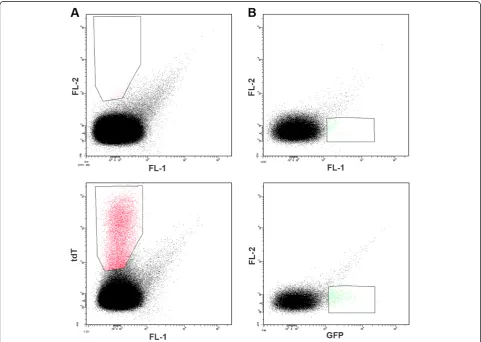
Figure 1Representative dot blots of red blood cells infected with either non-fluorescentP. falciparum(P2G12-WT) (A and B) or with
Each sample was pipetted into a plastic chamber, placed in a cytospin slide centrifuge (Cytospin 2, Shandon Southern Instruments, Inc, Sewickley, PA, USA) and centrifuged for 5 min at a set speed of 100 RPM. Para-sites were deposited in a 7 mm-circular area on the slide, air dried and then Giemsa-stained for 15 min. Cytospin smears were subsequently investigated under a light microscope (Axiostar plus, Zeiss Inc, Thornwood, NY, USA) and photomicrographs were taken.
Statistical analysis
Files of 105-106events were acquired by flow cytometer. The data were analysed by Diva 6.1 (BD Biosciences, San Jose, CA, USA) and FlowJo software (Treestar, Ashland, OR, USA). Student’s t-test was used to compare data from cytometry experiments. The level of significance was set at P < 0.05. All data are representative of three independent experiments.
Results
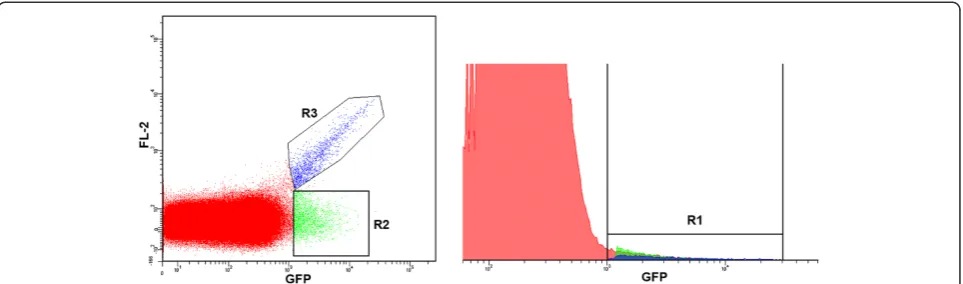
When attempting to detect rare events two relatively straightforward approaches can be taken to increase sensitivity: increasing the positive signal or reduction of AF. As a first step to achieve improved sensitivity when detecting malaria parasites in infected red blood cells by flow cytometry, an attempt to reduce AF was undertaken. When sexual parasites harboring a vector expressing tdTomato (emission max = 581 nm) [18] were compared to non-fluorescent wild-type parasites, good separation of tdTomato+ and tdTomato- events was obtained (FL2 channel; emission filter 576/26) (Figure 1A). The same results were obtained using a 585/29 emission filter (data not shown). However, when the standard emission filter supplied with the instrument (FL1 channel; emission filter 530/30) was used for a similar analysis of sexual parasites harbour-ing a vector expressharbour-ing GFP, the separation between positive and negative events was compromised due to high levels of AF in the FL1 channel (Figure 1B). This background signal appears to be critical impedi-ment for successful sorting of the GFP+ parasite population. The same results were found when using GFP-expressing ring- and schizont-stage parasites (data not shown). As shown in Figure 2, when events from the GFP expressing sample are presented in two-dimensional dot blot and histogram formats and compared, it is clear that the histogram format is not useful for proper gating of GFP+-events. On the histogram “diagonal” AF (R3 on Figure 2, left) will merge with R2 (on Figure 2, left) to form part of what will be treated as the GFP+-subpopulation (R1 on Figure 2, right).
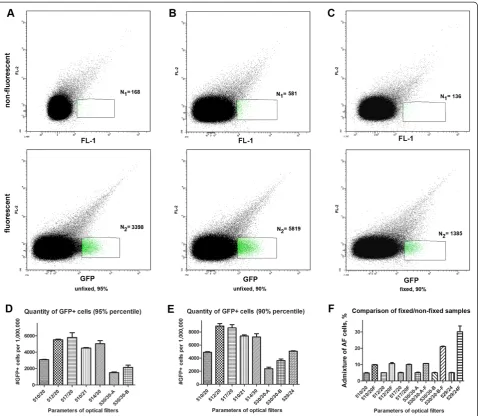
To estimate the FL1 region for the detection of positive events, signals obtained from unfixed GFP-expressing para-sites and from non-fluorescent parasite-infected RBC were
analysed using a two-dimensional dot plot (GFP (FL1) channel vs FL2 channel). The yield of positive events that could be obtained for GFP+ specimens was calculated as follows: on the dot plot of the fluorescent parasite sample the region containing the major part of the positive popula-tion was taken and placed in a way to include a minimal amount of events in the control (non-fluorescent) specimen (Figure 3A). First, the number of events that could be detected with purity of not less than 95% was calculated. To achieve this, the region was moved until the ratio between the number of events detected in the region on the non-fluorescent cell plot versus the region on the fluor-escent cell plot reached 1:20. A representative example of this gating is shown in Figure 3A. Next, events in this defined gate were counted using the different optical filters (Figure 3D). These included the standard 530/30 FL1 filters supplied with two different cytometers (designated 530/ 30-A and 530/30-B, respectively), and five other bandpass (BP) filters designated as 510/20, 512/20, 517/20, 510/21, and 514/30. The transmission spectra of the filters tested are given in Additional file 1A. The emission spectrum of GFP [19] with the overlay of the spectra of several filters (512/20; 517/20; 530/30-A and 530/30-B) can be found in Additional file 1B.
Using the 512/20 and 517/20 optical filters yielded >2-fold more events in the defined gate than the stand-ard 530/30 filters purchased with the computers (Figure 3D). Since the overall yield of GFP+ cells was quite low at >95% purity (<1%), regions were changed for all filters to achieve 90% purity of the selected subpo-pulation in order to enhance yield (Figure 3B, E). Once again, use of the 512/20 and 517/20 filters resulted in the best yield of GFP+ cells. Finally, to determine the effect of fixation on sorting purity and yield, non-fluorescent and GFP-expressing parasites (3D7/ pMAL13P1.130-GFP) were fixed and sorted with gating to 90% purity using a FACSAria II SORP and optimized GFP-filter. The fixation led to a 2–2.5-fold increase in the admixture of autofluorescent cells with the optimal filters (Figure 3F). However, an even bigger admixture of autofluorescent cells was observed for non-optimal fil-ters (530/3-A, 530/30B and 529/24), ranging from 4.1 to 5-fold increase (Figure 3F). Thus to achieve 90% purity of a fixed cell population, sorting yield will be decreased even using the best filters.
with a centre of emission bandwidth slightly shifted (2–3 nm) to the right of the GFP emission peak have to be used for maximum yield of GFP-expressing parasite-infected cells. However, BP-filter 510/20 provided the best yield when used with optimized dichroics filter 466LP (Additional file 2).
Although erythrocytes are fragile cells, successful FACS sorting of iRBCs can be achieved by lowering pressure and using additional precautions [7,18,20]. The purity and yield of the sorted populations of iRBCs infected with GFP-expressing parasites was further ana-lysed under the microscope after cytospin enrichment and Giemsa staining (Figure 4A) and by Imagestream 100 (Figure 4B-D, Additional file 3). Imaging cytometry analysis verified that the GFP+gametocytes represent ap-proximately 93-95% of the sorted population (Figure 4D). The percentage of GFP+ events of the unsorted iRBCs mixture shown on the imaging cytometry histogram (Figure 4C) is higher than the yield: this can be explained by the inclusion of some autofluorescent events. The yield of sorted GFP+ gametocytes differed between samples sorted with a 530/30 filter and a 512/20 filter differs by 2.5 to 3 fold as shown in Figure 3. Sorting with the 512/20 BP filter allowed for the collection of 150-200% more GFP+ gametocytes after additional optimization of the dichroic filter was performed (466LP > 502LP-Additional file 2). Furthermore, the improved filter set for GFP+event detection gave consist-ent results in several independconsist-ent biological replicates (Table 1) with purity in the high 90%.
Discussion
One of the major obstacles in antimalarial drug develop-ment is that the parasites develop resistance faster than drug development can follow. As gametocytes mediate the transition from human to insect host, they are an at-tractive target of chemotherapeutic intervention. How-ever, gametocyte biology remains poorly understood.
This is due, in part, to the lack of tools for gametocyte purification and separation. Gametocytes are rare in the infected mammalian host compared to the high asexual stage parasite numbers and can also only be generated in limited numbers in vitro, especially when isolation of a specific and synchronous gametocyte stages is desired. Another technical limitation in P. falciparum gametocyte research is the nearly inevitable contamin-ation of gametocyte cultures with asexual parasites, which impedes purification of parasites at highly syn-chronous, young transmission stages of development (before Stage II).
One major problem in the quantification and sorting of parasites samples using a single fluorescent marker with low signal is that the level of AF can produce low signal to noise ratio. From the point of view of minimiz-ing AF, the use of red proteins is preferable, since AF diminishes dramatically with increased excitation wave-length. However, GFP is superior for microscopic obser-vations and single-cell studies compared to many red proteins because of its relatively high brightness and photostability [21,22]. Thus, GFP is most often used for cell sorting due to the convenience of further observa-tions despite rather high AF of cells in this part of emis-sion spectrum. Here, using transgenic P. falciparum lines expressing GFP, an optimized protocol for the de-tection and isolation of parasites at high yield and purity was established.
[image:5.595.58.540.89.231.2][15,16,28], and the AF in the red spectrum is due to por-phyrins [29]. Red blood cells also have significant AF after 620 nm [10], which complicates the detection of the far-red fluorescent proteins like mCherry. As shown in Figure 1, good results with transgenic para-sites expressing tdT, which has an emission peak in a region where AF from red blood cells is low, were obtained.
However, because of the relatively low photostability of tdT, GFP is much more commonly used in transgenic
[image:6.595.60.539.88.504.2]However, standard filters supplied with instruments for the FL1 channel on the majority of cytometers (530/30) continue to be used for sorting and analysis of other GFP-expressing cells and bacteria [30], even for quantitative analysis of low numbers of GFP+-cells (concentrations <0.1%, i.e. rare cell subpopulations) [31-33]. In the case of the FACSCalibur instrument, there is no other choice of filters for FL1 detection, and the investigator ends up sacrificing detection yield by using the built-in optical path. Modern cytometers, in the other hand, have interchangeable filters (Additional file 5), allowing users to optimize detection of events in individual channels. For example, optimization of the BP
filter for FL1 to detect GFP signal is essential, as its emission spectrum is significantly different from the FITC spectrum.
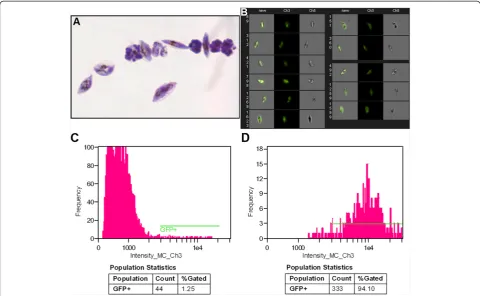
[image:7.595.57.538.89.385.2]To improve GFP detection and sorting yield for P. falciparum research, a strategy was employed to increase the ratio between specific GFP signal and AF signal by using a narrow BP filter that permits the maximum inten-sity of GFP emission. Since the emission peak of GFP is rather close to the wavelength of a blue laser (509 nm vs 488 nm), only filters with a relatively high steepness of transmission curve could be used. Filters with optical density (OD) at 488 nm of more than six OD units com-bined with dichroic mirror with >50% transmission at Figure 4A, B, C, D Image analysis of sorted red blood cells infected with GFP-expressing transgenic parasites from line 164/GFP. A.
Microscopic image of sorted red blood cells infected with GFP-expressing transgenic parasites from line 164/GFP (cytospin, Giemsa staining, Objective ×100/1.3 Oil).B.Gallery of images of sorted red blood cells infected with GFP-expressing parasites (line 164/GFP) acquired with Imagestream 100 imaging cytometer. Left channel: bright field, middle channel: fluorescent channel 3 (GFP-channel), right channel: merged bright field and green channels.C.Histogram of unsorted red blood cells infected with GFP-expressing transgenic parasites from line 164/GFP.
D.Histogram of sorted red blood cells infected with GFP-expressing transgenic parasites (164/GFP).
Table 1 Cytometric analysis ofPlasmodium falciparumGFP+gametocytes (line 164/GFP) before and after sorting
Cell population % GFP+cells-Exp1 % GFP+cells-Exp2 % GFP+cells-Exp3
Before sorting 0.05% 0.06% 0.03%
After sorting 95.1% 94.7% 93.1%
Gametocytes were collected in an equal volume of PBS supplemented with 1% BSA, HEPES and L-glutamine, subsequently subjected to imaging cytometer analysis and quantified events were reported. Data are percentage of GFP+
[image:7.595.55.540.666.706.2]wavelengths longer than 502 nm were selected. Using nar-row BP filters only slightly affects the mean fluorescence intensity (MFI) [34], but it significantly reduces the AF background. An important factor in rare cell sorting is the difference between the MFIs of positive and negative sub-populations (i.e., between the background and the true signal) as the presence of highly autofluorescent cells complicates discrimination of positive events from the autofluorescent background [35]. Besides, in order to sep-arate highly autofluorescent cells from the GFP popula-tion, one-dimensional analysis by histogram analysis is insufficient. Instead, GFP vs. AF must be plotted on a two-dimensional dot plot using a different channel from the same laser for the y axis (i.e. FL2 channel-Figure 1).
Through use of the above approach it was found that careful choice of BP filters for acquisition of red blood cells infected with GFP-expressing parasites is critical and made it possible to increase yield by 50 to 150% thereby still maintaining 95% purity, and markedly cut sorting time. Optimization of sorting conditions resulted in an insignificant difference between the yield of tdT-expressing, where AF is only a minor issue, and GFP-expressing cells.
The optimized sorting protocol was used with the gametocyte-producing transgenic parasite line (164/ GFP), as well as sorting the schizont-stage and the ring-stage of transgenic malaria parasites. The data described here were generated using transgenic parasite lines in which the GFP constructs were maintained episomally. As mentioned above, GFP has become the marker of choice for transgenic studies, since it is readily detected with high specificity and sensitivity by flow cytometry and microscopy. However, there are certain limitations in using GFP as a marker when analysis is performed on fixed specimens: GFP signal may fade over time after fixation, as well as during permeabilization [36,37]. In addition, AF is increased after aldehyde fix-ation [38] making the MFI difference between positive and negative subpopulations very low. GFP fluorescence is also dependent on the conformation of the protein [39,40]. Thus, modifications of the fixation and permeabilization protocol may be necessary to ensure good GFP signal [41].
FACS sorting of GFP-transfected malaria parasites can be clearly described as“rare cell population”sorting, since transfection efficiencies for parasites are low (0.1-1.0%) [8]. Rare-event cell sorting makes it necessary to sort mil-lions of cells in order to obtain the desired amount of selected cells. Its efficiency depends mainly on the follow-ing factors: 1) the signal-to-noise ratio of the population of interest compared to negative population; 2) the ex-pression (%) of the population of interest; and 3) the ratio between cells and debris particles [42,43]. The frequency of false-positive events (noise or impurity) defines the
lower limit for detection that is calculated as the upper 99th percentile of negative control.
In conclusion, although there are several limitations associated with the use of GFP in the study of malaria parasite biology, the methodology described in this manuscript overcomes several of these hurdles, and should be immediately applicable for laboratories that have developed GFP-expressing transgenic parasite lines. Maximizing the performance of optical filters has tre-mendous potential for life science research and cell sort-ing, in particular rare cell sortsort-ing, and allows sorting yield to be markedly increased at a relatively trivial cost compared to the price of the cytometer itself.
Additional files
Additional file 1:Spectral characteristics of the optical filters used in the study (A) and the transmission spectra of three different optical filters used for the detection of GFP-positive events superimposing the GFP emission spectrum (B).
Additional file 2:Relative yield (%) of GFP+gametocytes (line 164/ GFP) collected with a FACSAria cytometer, equipped with dichroic filter 466LP vs a FACSAria cytometer equipped with 502LP dichroic and different bandpass filters.
Additional file 3:Representative image gallery of sorted red blood cells infected with GFP-expressing parasites (line 164/GFP).The parasites were sorted using a 517/20 filter (dichroic 502LP) and images were acquired with Imagestream 100 imaging cytometer. Left channel: bright field, middle channel: fluorescent channel 3 (GFP-channel), right channel: merged bright field and green channel.
Additional file 4:Cytometer and optical filter information available from publications on malaria research.
Additional file 5:List of optical filters interchangeability in some cytometers.
Abbreviations
AF: Autofluorescence; BP: Bandpass; BrdU: Bromodeoxyuridine; BSA: Bovine serum albumine; GFP: Green fluorescent protein; FL: Fluorescent channel; FP: Fluorescent protein; MFI: Mean fluorescence intensity; NAD: Nicotinamide adenine dinucleotide; OD: Optical density; PBS: Phosphate buffered solution; PCR: Polymerase-chain reaction; PFA: Paraformaldehyde;
PMT: Photomultiplier; RBC: Red blood cell; tdT: Tandem dimer Tomato fluorescent protein; WT: Wild type.
Competing interests
PP is employed by Semrock Inc. Other authors do not have any competing interests.
Authors’contributions
The work was carried out in collaboration between all authors. IAV and KB designed experiments, carried out the laboratory experiments, analysed the data, interpreted the results and wrote the draft. KK, PP and EE co-designed and performed experiments and contributed in data interpretation and report writing. MM and MD supervised KB and EE, coordinated the research, and commented on the manuscript. NSB designed and coordinated research, analysed the data, wrote the manuscript, and provided funding. All authors have contributed to, seen, and approved the final manuscript.
Acknowledgements
and Luke Jasenosky for invaluable help in editing of the manuscript. We also thank Aleksandra Gorelova and Julia Hillabrant for help with the preparation of the manuscript.
Author details
1
Immune Disease Institute and Program in Cellular and Molecular Medicine, Children’s Hospital, D-239, 200 Longwood Avenue, 02115, Boston, MA, USA.
2
A.N. Belozersky Institute for Physico-Chemical Biology and Department of Biology, M.V. Lomonosov Moscow State University, Moscow, Russia.
3
Department of Immunology and Infectious Diseases, Harvard School of Public Health, Boston, MA, USA.4Semrock Inc, RochesterNY, USA.
Received: 13 April 2012 Accepted: 29 August 2012 Published: 5 September 2012
References
1. Kappe SHI, Vaughan AM, Boddey JA, Cowman AF:That was then but this is now: malaria research in the time of an eradication agenda.Science 2010,328:862–866.
2. Murray CJ, Rosenfeld LC, Lim SS, Andrews KG, Foreman KJ, Haring D, Fullman N, Naghavi M, Lozano R, Lopez AD:Global malaria mortality between 1980 and 2010: a systematic analysis.Lancet2012, 379:413–431.
3. Waller RF, Reed MB, Cowman AF, McFadden GI:Protein trafficking to the plastid ofPlasmodium falciparumis via the secretory pathway.EMBO J 2000,19:1794–1802.
4. Mota MM, Thathy V, Nussenzweig RS, Nussenzweig V:Gene targeting in the rodent malaria parasitePlasmodium yoelii.Mol Biochem Parasitol2011, 113:271–278.
5. Miambo G, Kumar N:Transgenic rodentPlasmodium bergheiparasites as tools for assessment of functional immunogenicity and optimization of human malaria vaccines.Eukaryot Cell2008,7:1875–1879.
6. Graewe S, Retzlaff S, Struck N, Janse CJ, Heussler VT:Going live: a comparative analysis of suitability of the RFP derivatives Red Star, mCherry and tdTomato for intravital and in vitro live imaging of
Plasmodiumparasites.Biotechnol J2009,4:895–902.
7. Janse CJ, Franke-Fayard B, Waters AP:Selection by flow-sorting of genetically transformed, GFP-expressing blood stages of the rodent malaria parasite,Plasmodium berghei.Nat Protoc2006,1:620–623. 8. Wilson DW, Crabb BS, Beeson JG:Development of fluorescent
Plasmodium falciparumfor in vitro growth inhibition assays. Malar J2010,9:152.
9. Buchholz K, Burke TA, Williamson KC, Wiegand RC, Wirth DF, Marti M: A high-throughput screen targeting malaria transmission stages opens new avenues for drug development.J Infect Dis2011, 203:1445–1453.
10. De Goes Rocha FG, Chaves KC, Gomes CZ, Campanharo CB, Courrol LC, Schor N, Bellini MH:Erythrocyte protoporphyrin fluorescence as a biomarker for monitoring antiangiogenic cancer therapy.J Fluoresc2010, 20:1225–1231.
11. Hu G, Cabrera A, Kono M, Mok S, Chaal BK, Haase S, Engelberg K, Cheemadan S, Spielmann T, Preiser PR, Gilberger TW, Bozdech Z: Transcriptional profiling of growth perturbations of the human malaria parasitePlasmodium falciparum.Nat Biotechnol2010,28:91–98.
12. Kadekoppala M, Kline K, Akompong T, Haldar K:Stable expression of a new chimeric fluorescent reporter in the human malaria parasitePlasmodium falciparum.Infect Immun2000,68:2328–2332.
13. Aingaran M, Zhang R, Law SK, Peng Z, Undisz A, Meyer E, Diez-Silva M, Burke TA, Spielmann T, Lim CT, Suresh S, Dao M, Marti M:Host cell deformability is linked to transmission in the human malaria parasite
Plasmodium falciparum.Cell Microbiol2012,14:983–993.
14. Trager W, Jensen JB:Human malaria parasites in continuous culture. Science1976,193:673–675.
15. Benson RC, Meyer RA, Zaruba ME, McKhann GM:Cellular autofluorescence-is it due to flavins?J Histochem Cytochem1979,27:44–48.
16. Kunz D, Luley C, Winkler K, Lins H, Kunz WS:Flow cytometric detection of mitochondrial dysfunction in subpopulations of human mononuclear cells.Analyt Biochem1997,246:218–224.
17. Prabhat P, Erdogan T:Measurement of optical filter spectra.2010, www.semrock.com.
18. Khan SM, Franke-Fayard B, Mair GR, Lasonder E, Janse CJ, Mann M, Waters AP: Proteome analysis of separated male and female gametocytes reveals novel sex-specificPlasmodiumbiology.Cell2005,121:675–687. 19. Spectra of various fluorescent proteins.[www.tsienlab.ucsd.edu] 20. Miao J, Li X, Cui L:Cloning ofPlasmodium falciparumby cell sorting.
Exp Parasitology2010,126:198–202.
21. Shaner NC, Campbell RE, Steinbach PA, Giepmans BN, Palmer AE, Tsien RY: Improved monomeric red, orange and yellow fluorescent proteins derived from Discosoma sp. red fluorescent protein.Nature Biotechnol 2004,22:1567–1572.
22. Jung G, Zumbusch A:Improving autofluorescent proteins: comparative studies of the effective brightness of green fluorescent protein (GFP) mutants.Microsc Res Tech2006,69:175–185.
23. Chudakov DM, Matz MV, Lukyanov S, Lukyanov KA:Fluorescent proteins and their applications in imaging living cells and tissues.Physiol Rev2010, 90:1103–1163.
24. Nokubo M, Ohta M, Kitani K, Nagi I:Identification of protein-bound riboflavin in rat hepatocyte plasma membrane as a source of autofluorescence.Biochim Biophys Acta1989,981:303–308. 25. Ramanujan N:Fluorescence spectroscopy of neoplastic and
non-neoplastic tissues.Neoplasia2000,2:89–117.
26. Bondza-Kibangou P, Millot C, Dufer J, Millot JM:Microspectrofluorimetry of autofluorescence emission from human leukemic living cells under oxidative stress.Biol Cell2001,93:273–280.
27. Schantz SP, Savage HE, Sacks P, Alfano RR:Native cellular fluorescence and its applications to cancer prevention.Environ Health Perspect1997, 105:941–944.
28. Monici M:Cell and tissue autofluorescence research and diagnostic application.Biotechnol Annu Rev2005,11:227–256.
29. Aubin JE:Auto fluorescence of viable cultured mammalian cells. J Histochem Cytochem1979,27:36–43.
30. Pearse AG:Histochemistry: theoretical and applied, Volume 2. 3rd edition. NY: Williams & Wilkins Publishers; 1972.
31. Ferrari BC, Oregaard G, Soerensen SJ:Recovery of GFP-labeled bacteria for culturing and molecular analysis after cell sorting using a benchtop flow cytometer.Microb Ecol2004,48:239–245.
32. Meyer K, Irminger JC, Moss LG, De Moitoso Vargas L, Oberholzer J, Bosco D, Morel P, Halban PA:Sorting humanβ-cells consequent to targeted expression of green fluorescent protein.Diabetes1998, 47:1974–1977.
33. Golan A, Kerem Z, Tun OM, Luzzatto T, Lipsky A, Yedidia I:Combining flow cytometry and gfp reporter gene for quantitative evaluation of
Pectbacterium cartovorumssp. cartovorum inOrnithogalum dubium
plantlets.J Appl Microbiol2007,108:1136–1144.
34. Fong SMB, Lee MK, Adusumilli PS, Kelly KJ:Fluorescence-expessing viruses allow rapid identification and separation of rare tumor cells in spiked cells of human whole blood.Surgery2009,146:498–505.
35. Braun RK, Rudnicki MA, Sekaly RP, Filion LG:Filter selection for five color flow cytometric analysis with a single laser.Int J Lab Hematol2007, 29:369–376.
36. Jin D, Piper JA, Leif RC, Yang S, Ferrari BC, Yuan J, Wang G, Vallarino LM, Williams JW:Time-gated flow cytometry: an ultra-high selectivity method to recover ultra-rare-event mu-targets in high-background biosamples. J Biomed Opt2009,14:024023.
37. Niswender KD, Blackman SM, Rohde L, Magnuson MA, Piston DW: Quantitative imaging of green fluorescent protein in cultured cells: comparison of microscopic techniques, use in fusion proteins and detection limits.J Microsc1995,180:109–116.
38. Kusser KL, Randall TD:Simultaneous detection of EGFP and cell surface markers by fluorescence microscopy in lymphoid tissues.J Histochem Cytochem2003,51:5–14.
39. Csaba G, Kovacs P, Pallinger E:Effects of different fixatives on demonstrating epinephrine and ACTH hormones in tetrahymena. Biotech Histochem2009,84:261–265.
40. Brejc K, Sixma TK, Kitts PA, Kain SR, Tsien RY, Ormo M, Remington SJ: Structural Basis for dual excitation and photoisomerization of the
Aequorea victoriagreen fluorescent protein.Proc Natl Acad Sci USA1997, 94:2306–2311.
41. Li X, Zhang G, Ngo N, Zhao X, Kain SR, Huang CC:Deletions of the
42. Luby-Phelps K, Ning G, Fogerty J, Besharse JC:Visualization of identified GFP-expressing cells by light and electron microscopy.J Histochem Cytochem2003,51:271–274.
43. Zimmerlin L, Donnenberg VS, Donnenberg AD:Rare event detection and analysis in flow cytometry: bone marrow mesenchymal stem cells, breast cancer stem/progenitor cells in malignant effusions, and pericytes in disaggregated adipose tissue.Methods Mol Biol2011, 699:251–273.
doi:10.1186/1475-2875-11-312
Cite this article as:Vorobjevet al.:Optimization of flow cytometric
detection and cell sorting of transgenicPlasmodiumparasites using interchangeable optical filters.Malaria Journal201211:312.
Submit your next manuscript to BioMed Central and take full advantage of:
• Convenient online submission
• Thorough peer review
• No space constraints or color figure charges
• Immediate publication on acceptance
• Inclusion in PubMed, CAS, Scopus and Google Scholar
• Research which is freely available for redistribution