ADVISORY NOTE
To:
Director of Basic Education Division, Ghana Education
Service
From:
Advisory Unit on Decentralised Education Management,
BED, GES
Document number:
AN003-2011
Date:
10 May 2011
Re: Result of Document Review on ADEOP and ADPR
Result of Document Review on Annual District
Education Operation Plan and Annual District
Performance Report
Advisory Unit on Decentralised Education Management
Ghana Education Service
1
[Main points of this report]
1. Overview of the document review
The Advisory Unit on Decentralised Education Management (AUDEM) in the Ghana Education Service (GES) has gone through Annual District Education Operation Plans (ADEOPs) and Annual District Performance Reports (ADPRs) to make a detailed diagnosis on these key management documents at the district level. The documents of around 65% of the districts have been examined in this study and key findings and recommendations are reported as below.
2. Key findings
• Around 80% of the districts used the ADEOP standard form but others used different forms for their ADEOPs.
• Target setting of around 30% of the districts were not relevant.
• There is an impression that activities listed in the ADEOPs were not clearly linked with outcome level targets.
• As much as 36% of the districts did not show relevant annual budgets.
• Most of the districts had big gaps between their budgets and actual expenditures. • There was obvious disconnection between planning and review process in almost all of
the districts. There was no district that reflected results of annual performance review on planning of the ADEOP. Most of the ADPRs did not show any recommendations to the next ADEOPs.
• Around 30% of the districts did not show information related to DP supported activities in ADEOPs and ADPRs.
• More than 90% of the districts used the standard structure of ADPRs.
• Almost all of the districts reported different figures from those in the EMIS report. • Around 30% of the districts did not make any analysis on results of indicators in their
ADPRs.
• Only 13% of the districts responded to all the reporting requirements of the ADPR. • 75% of the districts did not use any visual aids in their ADPRs.
• 73% of the districts did not report the results of activities in their ADEOPs. • 87% of the districts did not report the results of SPIPs.
• There is no process in the HQ and regional offices for quality check and stockpiling of the ADEOPs and ADPRs.
• There is no process to update understanding and knowledge of district officers on planning and review.
3. Recommendations
1) Modifications of guidelines
2
have a space for visions and missions of districts.
clearly show relations between planned outputs and outcome level targets
have a space for total budget figure and its justifications such as the budget per student and the expenditure amount of the previous year.
The ADEOP guidelines should:
strongly instruct that activities in the plans need to be stated in a more specific and measurable manner.
instruct districts to take into serious consideration their past expenditures and the scale of their student enrolment when they develop their ADEOPs.
stress the importance of clearly stating recommendations to ADEOP in the
performance reports and to ensure reflection of these recommendations in the plans.
The ADPR reporting template should:
streamline its reporting items especially those tables that reports detailed information.
include a guiding question for recommendations to the next ADEOPs.
The ADPR guidelines should:
suggest several patterns of analysis on indicators with effective use of visual aids.
instruct to go through results of major activities one by one and to critically analyse what are causes of obstacles for implementation if any.
clearly indicate how to review results of SPIPs in their districts.
2) Training needs
The following points need to be considered:
Strengthening understanding on projection on key indicators among district officers.
Systematising a training process of district officers for proper understanding on requirements in ADEOP and ADPR.
Enforcement of the guidelines especially on: • strict use of the ADEOP standard form.
• establishment of closer communications with DPs so that the district plans are effectively developed with mobilising all possible resources.
• ensuring quality checking by regional offices on contents of district reports • analysis on causes of changes on indicators and consideration on what need to be
done to improve their situations.
• coverage of DP activities in their reports.
3) System development
3
4) Roles of regional offices and the headquarters
The following points need to be considered to strengthen roles of regional offices and the headquarters in the process of planning and review.
Regional offices
Enforcement of guidelines on ADEOPs and ADPRs to districts
Quality control of ADEOPs and ADPRs in their regions
Compilation of ADEOPs and ADPRs for regional plans and reports
Consultative roles for districts for planning and review processes
Stockpiling of the documents from district in their regions
Headquarters
Quality control and updating of guidelines on ADEOPs and ADPRs
Control of annual planning and review processes
Establishment of training processes on planning and review for officers in districts and regions (actual implementation of training courses should be contracted out to training institutes)
4
1. Introduction
In order to make a detailed diagnosis on quality of key management documents at the decentralised level, i.e. 1) Annual District Operation Plan (ADEOP), 2) Annual District
Performance Report (ADPR), 3) School Performance Improvement Plan (SPIP), and 4) reports of School Performance Appraisal Meeting (SPAM), the Advisory Unit on Decentralised Education Management (AUDEM) in the Ghana Education Service (GES) first attempted to collect these documents initially at the headquarters of the GES in November 2010. However, it was turned out that only a small number of documents of ADEOPs and ADPRs were stocked at the HQ though these are supposed to be received by the HQ every year. The AUDEM
checked it with the Planning Budgeting Monitoring Evaluation Division (PBMED) of the Ministry but this division also did not stock any such documents as its staff said that this division
expected only a summary of these district documents from the HQ of the GES. As for SPIPs and SPAM reports of individual schools, there was no duty for the GES to stock them at its HQ. Therefore there was no single document at the HQ. It was also found that regional offices were not reliable in this regard as they did not keep any documents. Due to this situation, the AUDEM had to collect these documents directly from districts and schools to go for the diagnosis.
In December 2010, a letter of the Director General of the GES was issued to request district offices to submit the following documents and all regional offices were requested to ensure their submissions:
• ADEOP2009-2011,2010-2012
• ADEAP 2009, 2010
• ADPR 2009 - 2010
• SPIP 2010,2009 (three selected schools from each district)
• SPAM Report 2009 - 2010 (three selected schools from each district)
As a result, the AUDEM obtained 155 documents for the ADEOP and 112 documents for the ADPR in total from their submission and existing stocks at the HQ. Among them, ADEOP 2010-12 and ADPR 2009-10 were selected from each district and reviewed. For those districts that did not submit their documents of these particular years, the latest documents were selected. The status of SPIP and SPAM reports would be reported separately from this report.
5
Table 1: Submission and review of documents
ADEOP ADPR
2011-13
2010-12
2009-11
2008-10
2007-09
Others Total 2010-11
2009-10
2008-09
2007-08
Others Total
Obtained 11 59 69 14 1 1 155 5 87 17 1 2 112
Reviewed 7 59 40 10 1 0 117 5 87 17 1 1 111
[image:8.595.84.377.409.595.2]Only Northern Region submitted documents of all districts while Eastern Region showed low performance on submission. Those regions that showed low performance here need to improve their communications between regional offices and district offices.
Table 2: Submission of documents by region
Total Ashanti Brong
Ahafo
Central Eastern Greater Accra
Northern Upper East
Upper West
Volta Western
ADEOP 68.8% 66.7% 63.6% 82.4% 28.6% 80.0% 100.0% 66.7% 77.8% 55.6% 82.4%
ADPR 65.3% 48.1% 68.2% 82.4% 38.1% 90.0% 100.0% 77.8% 66.7% 55.6% 52.9%
Chart 1: Submission of documents by region
2. Evaluation Questions
6
Chart 2: ADEOP evaluation questions
Question Score
Q1 ADEOP standard form is used? Used =2, Not used=0
Q2 District vision and mission are clearly stated? Both are stated clearly=2, Partially stated=1, No statement=0
Q3 Relevance of targets: Fully relevant=2, Partially relevant=1, Not
relevant/unknown=0
Q4 Relevance of activities against targets: Fully relevant=2, Partially relevant=1, Not relevant=0
Q5 Relevance of costing: Fully relevant=2, Partially relevant=1, Not
relevant/unknown=0
Q6 Activities are SMART? Fully SMART=2, Partially SMART=1, Not at all=0
Q7 Recommendations from ADPR are reflected in the plan?
Fully reflected=2, Partially reflected=1, Not reflected at all/not known=0
Q8 Activities of DPs are reflected? Fully=2, Some extent=1, No=0
Chart 3: ADPR evaluation questions
Question Score
Q1 The standard structure instructed in the guidelines is used in the ADPR?
Used without any change=2, Partially changed=1, Totally different=0
Q2 All data shown are accurate? Inaccuracy not observed=2, Partially inaccurate=1, Not
accurate at all=0
Q3 Is analysis on indicators in good quality? Outstanding = 2, fair = 1, poor or NA = 0 Q4 Are there any parts that are not reported? No=2, Yes=0
Q5 Visual aids are effectively used? Effectively used=2, Used but not so effectively=1, Not used at all=0
Q6 Results of activities listed in ADEOP are properly reported?
Fully reported=2, Partially reported=1, Not reported at all=0
Q7 Results of SPIP are analysed? Fully analysed=2, Partially analysed=1, Not analysed at all=0 Q8 Activities of DPs are included in the report? Yes=2, No=0
Q9 Is there any recommendation for the next cycle of ADEOP?
Yes=2, No=0
3. Calculation of scores
The following types of calculations are made to numerically show the status of documents on each evaluation question:
1. Scores for respective questions are summed up to show the total score of a district (See
○
A in the table below).7
3. Percentage of the total score against the full score for a particular question in a region is calculated (See
○
C below).4. All regional total scores for respective questions are summed up to make the grand total scores (See
○
D below)5. Percentage of the grand total score against the full score for a particular question is calculated (See
○
E below).Chart 4: Scoring example
Name of district Score
Q1 Q2 … Q8 District total
District 1 2 1 2 ○A
District 2
District 3
…
District 20
Regional total ○B
% against full score ○C
…
Grand total ○D
% against full score ○E
6. Percentages of districts that obtained the score 2, 1 and 0 for each question are calculated to see breakdowns of obtained scores.
8
4. Result of Scoring
This section will go through the evaluation questions one by one on ADEOP and ADPR to describe results of scoring and give suggestions to improve the status.
ADEOP
Q1 ADEOP standard form is used? It has been found that in total 78.6 % of the districts used the standard form of ADEOP while 21.4 % used different forms. Particularly, no district in Upper East Region used the standard form. Only half of the districts in Brong Ahafo Region used the standard form. The other form is called Format C or D and
did not indicate targets of any outcome level indicators such as GER and NER. The other form is also less linked to the ESP compared to the standard form. Those districts that did not use the standard form should be strongly urged to do so.
Q2 District visions and missions are clearly stated?
Only 5.1 % of the districts stated their visions and missions in their plans although all the districts were guided to do so by the training and working manual of the ADEOP. District visions and missions are the basis on which all targets and objectives are set. But iw as found that few targets were set with referring to their visions and missions.
However, it was true that there was no space in the standard form to state visions and missions. Some districts therefore did so in their annual performance reports. It is therefore urged that the standard form must be modified to make a space for stating visions and missions.
Chart 5: Percentage of scores by region on Q1
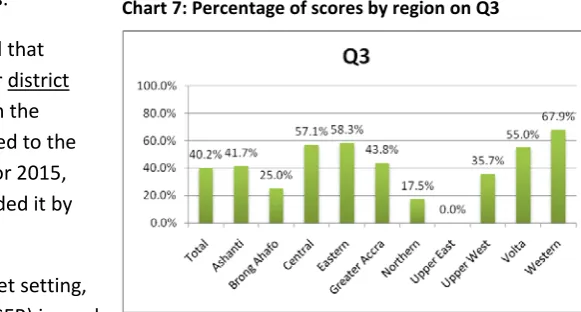
9 Q3 Relevance of targets:
First of all, it has been noted that though there is a column for district indicative targets for 2015 in the standard form, which is linked to the national indicative targets for 2015, none of the districts responded it by deleting the column.
To see the relevance of target setting, the Gross Enrolment Rate (GER) is used
[image:12.595.211.502.107.263.2]as a sample indicator for it since it is not possible for this study to examine relevance of all the targets in the plans. If targets of the GER looked relevant compared to its past trend, the score 2 was given. If not but still targets are shown, the score 1 was given. If there is no annual target shown at all in the entire plan, the score 0 was given. For example, if a district used the non-standard form, there is no annual GER target shown. In this case the score 0 was given. As a result of examining the documents by using these criteria, the percentage of the total score for this question against the full score (Figure
○
E above) was calculated as 40.2%. Especially, as there was no district that used the standard form in Upper East Region, the entire region got 0 score. Northern Region and Brong Ahafo Region also showed weak scores because of use of the non-standard form. Western Region demonstrated the best scores among others. Looking at the breakdown of scores, only 10.3% of the districts in total got the score 2 while 29.9% of them got the score 0. Western Region contributed to increase of the score 2. The regions of Brong Ahafo, Greater Accra, Northern, Upper East and Upper West did not have districts that got the score 2.Table 3: Breakdown of scores by region on Q3
Region
Total Ashanti Brong
Ahafo
Central Eastern Greater Accra
Northern Upper East
Upper West
Volta Western
Fully relevant =2 10.3% 5.6% 0.0% 14.3% 33.3% 0.0% 0.0% 0.0% 0.0% 10.0% 42.9%
Partially relevant=1 59.8% 72.2% 50.0% 85.7% 50.0% 87.5% 35.0% 0.0% 71.4% 90.0% 50.0%
Not relevant/NA =0 29.9% 22.2% 50.0% 0.0% 16.7% 12.5% 65.0% 100.0% 28.6% 0.0% 7.1%
To improve the status, understanding on projection on key indicators need to be strengthened among district officers since most of the districts are not able to make proper projection. Use of the standard form should be also ensured so that relevant outcome level targets are properly shown in the plans and linkages with the ESP are guaranteed.
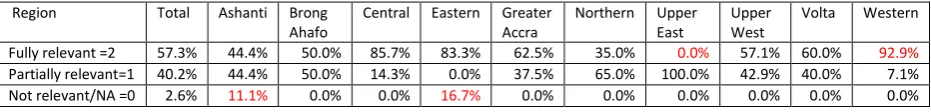
10 Q4 Relevance of activities against
targets:
For this question, if it was obvious that activities in a plan were not properly planned, for example if activities mentioned in a plan were full copies of those of other districts, the score 0 was given. If activities in a plan were enough to be specific and measurable against targets, the score 2 was given. If not,
the score 1 was given. As a result of review, the percentage of the total score for this question against the full score was calculated as 77.4%. While the regions of Central and Western showed good figures, Upper East and Ashanti showed relatively weak figures.
[image:13.595.72.538.415.471.2]Looking at the breakdown of scores, 57.3% of the districts got the score 2 while only 2.6% (3 districts) got the score 0. These three districts are those that did not have their own reports. Some are combined to other districts. The other fully copied a plan of another district. Moreover, Upper East Region had no district with the score 2.
Table 4: Breakdown of scores by region on Q4
Region Total Ashanti Brong
Ahafo
Central Eastern Greater Accra
Northern Upper East
Upper West
Volta Western
Fully relevant =2 57.3% 44.4% 50.0% 85.7% 83.3% 62.5% 35.0% 0.0% 57.1% 60.0% 92.9%
Partially relevant=1 40.2% 44.4% 50.0% 14.3% 0.0% 37.5% 65.0% 100.0% 42.9% 40.0% 7.1%
Not relevant/NA =0 2.6% 11.1% 0.0% 0.0% 16.7% 0.0% 0.0% 0.0% 0.0% 0.0% 0.0%
Apart from these scoring, there is an impression that those activities listed in the plans are a kind of ordinary activities repeatedly stated in the district plans over the past years such as classroom construction, provision of teaching learning materials and in-service training for teachers. On the other hand, the ADEOP standard form already listed up the key indicators that are closely related to the ESP, without showing indicative activities. It seemed that most districts simply related their ordinary activities with those indicators without clear linkages. It was therefore difficult to see whether or not these activities were really sufficient to achieve the targets set in the plans as there were no explanations to justify quantity of inputs in the plans. For example, Ahafo Ano North District in Ashanti Region set the GER target of
kindergartens as 83.4% in 2010, increased from 80.1% in 2009. To meet this target, it planned to construct 10 classrooms and to make furniture available in 58.3% of the kindergartens in the district, increased from 50.0% in 2009. It also planned to have an IEC campaign to "educate parents in the values of formal education". However, it was not clear how many pupils needed to be additionally enrolled to increase the GER by 3.3% and whether or not the 10 additional classrooms were sufficient to accommodate these newly enrolled pupils.
To improve the status, the guidelines should cleary instruct that activities in the plans need to be stated in a more specific and measurable manner. And more importantly, the ADEOP
11
standard form should be modified to clearly show relations between expected outputs of planned activities and outcome level targets.
Q5 Relevance of costing:
For this question, the score 0 was given if budget figures were not shown at all in a plan. In addition, if the total budget was too small or too large, more specifically in this case, if the budget per student (total budget/total number of students from kindergartens to junior high schools) was less than 10 Ghana Cedis (GH¢ )(too small) or more than GH¢ 200 (too much), the score 0 is given. This range was identified referring
[image:14.595.293.533.173.333.2]to the expenditure per student in 2009 which was calculated from the result shown in the annual national performance report in 2010 as about GH¢ 50. Besides, if budget figures in a plan were found to be partly unreasonable, the score 1 was given. If all budget figures in a plan seemed to be reasonable, the score 2 was given. As a result of review, the percentage of the total score against the full score was 58.1%. Central Region and Western Region got the highest percentage while the lowest was Upper West Region.
Table 5: Expenditure per student Total Expenditure
in 2009 (GH¢)
Estimated non-salary expenditure* (0.27% of total)
Enrolment in 2008-09
Exp per student
Pre-school 60,272,779 16,273,650 1,078,973 15.08 Primary 594,950,694 160,636,687 3,041,895 52.81 JHS 297,665,072 80,369,569 1,064,088 75.53 Total 952,888,545 257,279,907 5,184,956 49.62
(Source: Annual Education Sector Performance Report 2010, EMIS)
* As there was no figure of non-salary expenditure by each education level available in the report, these figures are estimated by using the ratio of the total non-salary expenditure against the total expenditure and in 2009 in the report.
Looking at the breakdown of scores, surprisingly, as much as 35.9% of the districts did not show relevant costing as indicated in the table below. This means that the ADEOPs of more than one third of the districts were unrealistic. Especially in the regions of Brong Ahafo, Greater Accra and Upper West, more than half of the districts did not show relevant budgets. The regions of Central and Western have relatively higher percentage of districts that got the score 2.
12
Table 6: Breakdown of scores by region on Q5
Region Total Ashanti Brong
Ahafo Central Eastern Greater Accra Northern Upper East Upper West Volta Western Fully
relevant =2 52.1% 44.4% 28.6% 71.4% 66.7% 25.0% 50.0% 66.7% 28.6% 60.0% 78.6%
Partially
relevant=1 12.0% 11.1% 21.4% 14.3% 0.0% 12.5% 20.0% 0.0% 0.0% 20.0% 0.0%
Not relevant/NA =0
35.9% 44.4% 50.0% 14.3% 33.3% 62.5% 30.0% 33.3% 71.4% 20.0% 21.4%
With regard to budget scales of the ADEOP, the total amounts of their annual budgets ranged from GH¢ 10,802 to GH¢ 129 million among 109 districts that showed their budget figures in their documents. The average was GH¢ 5.5 million. But almost 37% of the districts had their total budgets in less than GH¢ 1 million.
The budget per student ranged from GH¢ 0.21 to GH¢ 6,884.53. The average was GH¢ 157.39. This was much higher than 49.62, which was the
expenditure per student in 2009 calculated from the national performance report.
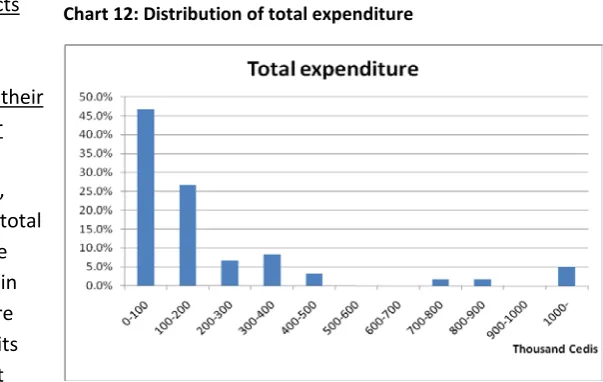
And sadly, the total budget figures in the plans of all the districts did not show any consistency with the figures of actual expenditures reported in their annual
performance reports. Among 60 districts that reported their
expenditure results in their ADPRs, only 3.3% of the districts (only two districts) reported more than GH¢ 1 million of their total expenditures though 63% of the districts put more than GH¢ 1 million in total in their ADEOPs. It should be however noted that some districts included the amount of their capitation grant in their expenditure reports while others did not do so.
Chart 10: Distribution of total budget
13 These results show that districts
should take into serious consideration their past
[image:16.595.219.521.104.295.2]expenditures and the scale of their student enrolment when their ADEOPs are developed. In the current ADEOP standard form, there is no space to show the total amount of their budgets. Since there is no total figure shown in the plan, a lot of activities were included without considering its budget scale. The total budget
figure should be shown and justified in the plans.
Q6 Activities are SMART? For this question, the score 2 was given if statements of activities included their specifications with numerical details and timelines. The score 1 was given if there are fair statements of activities but not with numerical details or timelines. The score 0 was given if there is no activity statement or if activities were just copied from other districts. As a result
of review, the percentage of the total score against the full score was 65.8%. While Western Region showed outstanding performance, the regions of Ashanti and Upper East showed weaker performance.
[image:16.595.74.538.667.741.2]Looking at the breakdown of scores, only 35.9% of the districts got the score 2. The regions of Brong Ahafo, Eastern, and Western showed more number of districts with the score 2 than those with the score 1 or 0.
Table 7: Percentage of scores by region on Q6
Total Ashanti Brong
Ahafo Central Eastern Greater Accra Northern Upper East Upper West Volta Western Fully
SMART=2 35.9% 11.1% 64.3% 42.9% 50.0% 25.0% 20.0% 0.0% 28.6% 10.0% 92.9%
Partially
SMART=1 59.8% 77.8% 35.7% 57.1% 33.3% 62.5% 80.0% 100.0% 71.4% 90.0% 0.0%
Not at all=0 4.3% 11.1% 0.0% 0.0% 16.7% 12.5% 0.0% 0.0% 0.0% 0.0% 7.1%
Chart 12: Distribution of total expenditure
14
If planned results of activities are not SMART, it is very difficult to monitor progress or
achievements of the plan. This could seriously undermine the credibility of the plan. Therefore this is the area that needs intensive efforts to improve the current status.
Q7 Recommendations from ADPR are reflected in the plan?
[image:17.595.83.504.345.648.2]There was no district that explicitly reflected recommendations of their annual district performance reports (ADPRs) on their ADEOPs. In many cases, their ADPRs did not have any clear recommendations to ADEOPs. There was obvious disconnection between a plan and performance review at the district level. Without reflecting results of performance review on planning, no progress could be expected. It is critical to establish a clear link between a plan and performance review. The guidelines of ADPR should stress the importance of clearly stating recommendations to ADEOP in the performance reports and the guidelines of ADEOP have to ensure reflection of these recommendations in the plans.
Table 8: Percentage of scores by region on Q7
Total Ashanti Brong
Ahafo Central Eastern Greater Accra Northern Upper East Upper West Volta Western
Q7 0.0% 0.0% 0.0% 0.0% 0.0% 0.0% 0.0% 0.0% 0.0% 0.0% 0.0%
Q8 Activities of DPs are reflected? Only 30.8% of the districts included activities supported by DPs in their ADEOPs. The regions of Upper East, Upper West and Western showed relatively higher percentages while Brong Ahafo had no district that included activities of development partners (DPs) in their plans. This result implies that day to day
communications between district offices and DPs are not very strong in these districts. It is required that more
communication needs to be established between district offices and DPs so that the district plans are effectively developed by mobilising all possible resources.
15 Total Score
In total, although Q 1 (use of standard form) and Q4 (relevance of activities) showed relatively higher scores, due to other questions that showed lower scores especially Q2 (visions and missions) and Q7 (recommendations from ADPRs), the percentage of the grand total score against the full score was as low as 44.5%. As for the regional status, Western Region demonstrated relatively higher percentage while the regions of Brong Ahafo, Northern and Upper East need more intensive efforts to improve their current status. It can be partly performed by ensuring their use of the standard form of ADEOP which has been long neglected by some districts in those regions. It is also needed to improve the standard form itself so that the above mentioned issues are more easily addressed by districts.
A distribution of actual scores obtained by the districts are shown in the chart. The total score ranged from 7 to 9 is the most frequent zone. There is no district that obtained the full score (16).
Chart 15: Total percentage by question
Chart 16: Total percentage by region
16
ADPR
Q1 The standard structure instructed in the guidelines is used in the ADPR? It has been found that more than 90% of the districts used the standard structure of the ADPR while only 10 districts used different forms. Among the 10 districts, some reorganised the standard structure to make it better. Others were those that could not be scored as these were just covered by other districts. A report of
some district was an exact copy of other district. In addition, contents of some districts were found to be several years old. Their reports did not report the latest status. To avoid these problems, regional offices should strictly check contents of district reports every time they receive them to ensure proper reporting.
Q2 All data shown are accurate? For scoring on this question, this study just focused on the number of primary school students and figures of GER and GAR. If the number of primary school students in the report were exactly same as the ones in the EMIS report and at the same time if total GER figures are consistent with its male and female GER figures, the score 2 was given. If both of them were not satisfied, the score 1 was given. If it could
not be reviewed as the district is covered by a report of other district, the score 0 was given. As a result of review, it has been found that the percentage of the total score for this question against the full score was 49.1%. Only 4.5% of the districts got the score 2. In fact only Obasi Municipal had the consistent figures of the number of primary school students with the EMIS report. All other districts reported different figures from the EMIS report. These discrepancies may give negative impression on credibility of the district reports as well as the EMIS report. And 63.1% of the districts reported higher or lower figures of total GER or GAR than figures of both female and male GER or GAR. This is a matter of very simple mistake in calculation of figures. It needs to be careful as this kind of simple error loses credibility of reports. There is no big difference among regions on this trend.
Chart 18: Percentage of scores by region on Q1
17
Table 9: Breakdown of scores by region on Q2
Total Ashanti Brong
Ahafo Central Eastern Greater Accra Northern Upper East Upper West Volta Western Inaccuracy not
observed=2
4.5% 15.4% 6.7% 7.1% 0.0% 0.0% 0.0% 0.0% 0.0% 0.0% 11.1%
Partially inaccurate=1
89.2% 76.9% 86.7% 78.6% 87.5% 88.9% 100.0% 100.0% 100.0% 90.0% 88.9%
Not accurate at all=0
6.3% 7.7% 6.7% 14.3% 12.5% 11.1% 0.0% 0.0% 0.0% 10.0% 0.0%
To avoid this situation, a unified database in district offices needs to be developed for EMIS, ADPR and other reporting purposes and the database should be equipped with various reporting modules so that all the reporting needs in districts can be satisfied.
Q3 Is analysis on indicators in good quality?
As for scoring, the score 2 was given if a report delivered good analysis on causes of changes and good recommendation to improve current situations. If a report put no analysis, describe only increase or decrease of figures or just copy analysis of other districts, then the score 0 was given. The score 1 was given for a report which was in-between of the
score 2 and 0. As a result of review, the percentage of the total score for this question against the full score was as low as 41.4%. It should be noted that 30.6% of the districts got the score 0. Especially in Upper West Region, half of the districts did so. The score 0 means that they did not even try to explain causes of changes of indicators and to show any solutions for problems. This implies that these districts were repeating activities without examining results or seeing impact of the activities that they completed. There is no doubt that there is little progress expected in such districts. Therefore these districts should be strongly encouraged that they don't forget to analyse causes of changes of indicators and seriously consider what need to be done to improve their situations.
Table 10: Breakdown of scores by region on Q3
Total Ashanti Brong
Ahafo
Central Eastern Greater Accra
Northern Upper East
Upper West
Volta Western
Outstanding = 2
13.5% 7.7% 26.7% 7.1% 12.5% 22.2% 15.0% 28.6% 16.7% 0.0% 0.0%
Fair = 1 55.9% 61.5% 60.0% 64.3% 50.0% 33.3% 45.0% 42.9% 33.3% 90.0% 66.7%
Poor or NA = 0
30.6% 30.8% 13.3% 28.6% 37.5% 44.4% 40.0% 28.6% 50.0% 10.0% 33.3%
[image:20.595.68.518.678.752.2]18 Q4 Are there any parts that are
not reported?
It has been found that only 12.6% of the districts met all reporting requirements. This is mainly due to 78.4% of the districts that did not report on the detailed tables required on such as NGOs, infrastructure profile, assessment of classroom furniture, and illness/accident/suicide. But some also did not report such key information as financial figures, indicators on TVET or
secondary schools. And some districts even copied reports of other districts. This may be partly because some district offices could not refer to the manual of the ADPR as it was no more available in their offices because of their poor document filing system. This may be also partly because there is no enough feedback from regional offices or GES headquarters on their reports. Moreover, there is no training workshop on the ADEOP and the ADPR conducted since 2007. There are therefore strong needs for systematising a training process of district officers for proper understanding on requirements in ADEOP and ADPR. On the other hand, the standard structure of the ADPR should be also streamlined. Very detailed data such as illness/accident/suicide and assessment of classroom furniture may not be suitable for sector performance reports like the ADPR. The reporting template needs to streamline its reporting items.
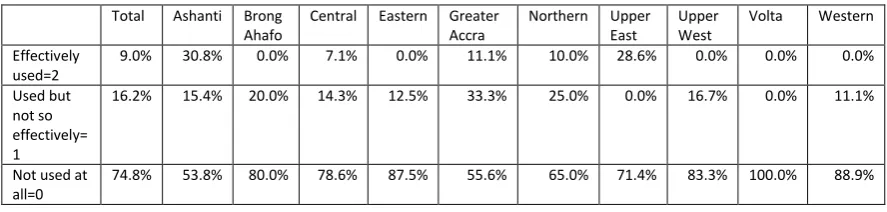
Q5 Visual aids are effectively used? The percentage of the total score for this question against the full score was as low as 17.1%. In total 74.8% of the districts did not use any visual aids at all. It must be mainly because use of visual aids is not instructed in the guidelines. But it may be also because analysis of indicators in many reports did not exist or was not in good quality as mentioned earlier. Visual aids are particularly effective when finding
correlations between indicators, seeing time-series trends in a long term or looking at geographical differences. But the analysis made in the submitted reports did not examine these aspects. Therefore it may be useful for the guidelines to suggest several patterns of analysis on indicators with effective use of visual aids.
Chart 21: Percentage of scores by region on Q4
19
Table 11: Breakdown of scores by region on Q3
Total Ashanti Brong
Ahafo Central Eastern Greater Accra Northern Upper East Upper West Volta Western Effectively
used=2
9.0% 30.8% 0.0% 7.1% 0.0% 11.1% 10.0% 28.6% 0.0% 0.0% 0.0%
Used but not so effectively= 1
16.2% 15.4% 20.0% 14.3% 12.5% 33.3% 25.0% 0.0% 16.7% 0.0% 11.1%
Not used at all=0
74.8% 53.8% 80.0% 78.6% 87.5% 55.6% 65.0% 71.4% 83.3% 100.0% 88.9%
Q6 Results of activities listed in ADEOP are properly reported?
In the guidelines, there are such guiding questions as "what has been the progress in implementing the ADEOP activities?" and "what are the key achievements?". However, in total 73.0% of the districts did not report progress or achievements of their ADEOPs. Particularly in the regions of Ashanti and Northern, more than 90% of the districts ignored these
guiding questions. As a result, the percentage of the total score for this question against the full score was as low as 16.7%. This is very critical as without reviewing results of planned activities it is difficult to consider next plans. Though some districts reported their
[image:22.595.252.518.321.470.2]achievements, these were general descriptions of their achievements such as just "successful" or "completed" and not exact results of individual activities in the plans. Due to this problem, the ADPRs were not effectively used to develop the next ADEOPs. This is causing serious disconnection between the plan and the review. In order to improve the current status, the guidelines should give an instruction to go through results of major activities one by one and to critically analyse what are causes of obstacles for implementation if necessary.
Table 12: Breakdown of scores by region on Q6
Total Ashanti Brong
Ahafo Central Eastern Greater Accra Northern Upper East Upper West Volta Western Fully
reported=2 6.3% 0.0% 6.7% 7.1% 12.5% 0.0% 5.0% 28.6% 16.7% 0.0% 0.0%
Partially
reported=1 20.7% 7.7% 40.0% 21.4% 25.0% 11.1% 0.0% 28.6% 16.7% 60.0% 11.1%
Not reported at
all=0 73.0% 92.3% 53.3% 71.4% 62.5% 88.9% 95.0% 42.9% 66.7% 40.0% 88.9%
20 Q7 Results of SPIP are analysed?
In the guidelines there is no guiding
question that asks to report results of SPIPs. This is the reason why no district reported full analysis on results of SPIPs. Most districts just stated that SPIPs were successfully developed and implemented. But without reporting what activities in SPIPs are successfully implemented and what activities did not go well, and what impact were made through
[image:23.595.279.523.142.298.2]implementation of SPIPs in the particular year, improvement in performance cannot be expected. The management cycle at schools is disrupted at this point. The guidelines should clearly indicate how to review results of SPIPs in their districts.
Table 13: Breakdown of scores by region on Q7
Total Ashanti Brong Ahafo Central Eastern Greater Accra Northern Upper East Upper West Volta Western
Fully analysed=2
0.9% 0.0% 0.0% 0.0% 0.0% 0.0% 0.0% 0.0% 0.0% 0.0% 11.1%
Partially analysed=1
11.7% 7.7% 6.7% 28.6% 25.0% 44.4% 0.0% 0.0% 16.7% 0.0% 0.0%
Not analysed at all=0
87.4% 92.3% 93.3% 71.4% 75.0% 55.6% 100.0% 100.0% 83.3% 100.0% 88.9%
Q8 Activities of DPs are included in the report?
In total 29.7% of the districts reported their activities supported by DPs, especially in the tables that described details of DP activities. The regions in the northern parts have relatively high percentage of scores. Most districts in other regions ignored this part Though it is the requirement in the guidelines. But without having information of DP activities, it is difficult to understand the entire picture of
interventions in the district. Districts should be strongly instructed to cover DP activities in their reports.
Chart 24: Percentage of scores by region on Q7
21 Q9 Is there any recommendation
for the next cycle of ADEOP? Only 3.6% of the districts put their recommendations to their next plans. The actual number of the districts was only four out of 111. This is mainly because there is no instruction in the guidelines to give recommendations to the next plans. However it is crucial to clearly state what need to be
considered when developing the next plans to establish good connections between
performance review and operational planning. Therefore the guidelines should be modified to include a guiding question for recommendations to the next ADEOPs.
Total
Although Q1 (use of standard
structure) showed higher percentage, due to other questions that showed lower scores, the percentage of the total score against the full score of all questions was as low as 29.8%. No substantial difference is observed on the scoring results among regions. There should be a number of modifications in the guidelines to improve the quality of reports while quality checking of reports by the headquarters and regional offices needs to be also strengthened to see whether or not submitted reports follow the guidelines. And feed backs from them to district offices need to be made to point out what need to be improved.
Chart 27: Total percentage by question
Chart 28: Total percentage by region
22 A distribution of actual scores obtained
by respective districts is shown in the chart. The score ranged from 4 to 6 is the most frequent one. There is no district that obtained the full score (18).
5. Recommendations
A number of recommendations have been already made in the previous chapter together with scoring analysis. Here are these recommendations extracted and highlighted as below.
1) Modification of the guidelines
The following recommendations are made on the guidelines and standard forms of the ADEOPs and the ADPRs:
The ADEOP standard form should:
have a space for visions and missions of districts.
clearly show relations between planned outputs and outcome level targets
have a space for total budget figure and its justifications such as the budget per student and the expenditure amount of the previous year.
The ADEOP guidelines should:
strongly instruct that activities in the plans need to be stated in a more specific and measurable manner.
instruct districts to take into serious consideration their past expenditures and the scale of their student enrolment when they develop their ADEOPs.
stress the importance of clearly stating recommendations to ADEOP in the
performance reports and to ensure reflection of these recommendations in the plans to establish an effective management cycle in districts.
The ADPR reporting template should:
streamline its reporting items especially those tables that reports detailed information.
include a guiding question for recommendations to the next ADEOPs.
23
The ADPR guidelines should:
suggest several patterns of analysis on indicators with effective use of visual aids.
instruct to go through results of major activities one by one and to critically analyse what are causes of obstacles for implementation if any.
clearly indicate how to review results of SPIPs in their districts.
2) Training needs
The following points need to be considered:
Strengthening understanding on projection on key indicators among district officers.
Systematising a training process of district officers for proper understanding on requirements in ADEOP and ADPR.
Establishment of closer communications with DPs so that the district plans are effectively developed with mobilising all possible resources.
Enforcement of the guidelines especially on: • strict use of the ADEOP standard form. • answering all guiding questions
• ensuring quality checking by regional offices on contents of district reports • analysis on causes of changes on indicators and consideration on what need to be
done to improve their situations.
• coverage of DP activities in their reports.
3) System development
A unified database in district offices needs to be developed for EMIS, ADPR and other reporting purposes and the database should be equipped with various reporting modules so that all reporting needs in districts can be satisfied.
4) Roles of regional offices and the headquarters
The following points need to be considered to strengthen roles of regional offices and the headquarters in the process of planning and review.
Regional offices
Enforcement of guidelines on ADEOPs and ADPRs to districts
Quality control of ADEOPs and ADPRs in their regions
Compilation of ADEOPs and ADPRs for regional plans and reports
24
Stockpiling of the documents from districts of their regions
Headquarters
Quality control and updating of the guidelines on ADEOPs and ADPRs
Control of annual planning and review processes
Establishment of training processes on planning and review for officers in districts and regions (actual implementation of training courses should be contracted out to training institutes)
Stockpiling of the documents from districts and regions possibly on a website
6. Conclusion
Though documents from all districts could not be reviewed, those from 65% of the districts were reviewed and some recommendations have been made to improve the planning and review process in districts. The most serious issues found in this study are 1) disconnection between the plan and the review, 2) irrelevant budgeting, 3) lack of review on activity results, 4) lack of orientation opportunities for district officers on the ADEOP and the ADPR and 5) indifference of regional offices and the HQ on quality of the district documents. Some can be improved by simply modifying the document templates and others need to have training sessions or sensitisation for relevant staff at districts, regions and the HQ. Those that can be simply modified should be reflected from this year process of the ADEOP and the ADPR. Others need more discussions among stakeholders and should be reflected from next year. The GES is expected to take these recommendations into its serious consideration and to take actions accordingly.
25
Annex
Page 1
ADEOP scoring results
GHANA DISTRICTS
Q1: U se of s
tandard
form ?
Q2: V ision
and M ission
state d?
Q3: T arget
relev ant?
Q4: A ctivit
y rele vant
?
Q5: C ostin
g rele vant
?
Q6: S MAR
T activ ities?
Q7: A DPR r
ecom .
refle cted?
Q8: D P acti
vities refle cted? Total Scor e Gene ral Re
mark s
Ashanti Region.
1 Adansi North 2 0 1 2 2 1 0 2 10 2009-11, primary GER targets not realistic,
2 Adansi South 0
3 Afigya-Kwabre new 2 0 1 2 2 1 0 1 9 2009-11, targets of JHS GER not realistic,
4 Ahafo Ano North 2 2 1 2 0 1 0 0 8 KG GER target not realistic, budget not
updated=still for 2008,
5 Ahafo Ano South 2 0 1 2 2 2 0 1 10 GER targets too ambitious,
6 Amansie Central 2 0 1 2 0 1 0 1 7 Budget one year old, GER targets too
ambitious, budget too much,
7 Amansie West 2 0 1 2 2 1 0 2 10 GER targets too high,
8 Asante Akim North Municipal 0
9 Asante Akim South 2 0 1 2 2 1 0 0 8 GER targets not realistic compared with past trends,
10 Atwima Kwanwoma new 0
11 Atwima Mponua 2 0 1 1 0 1 0 0 5 No action on health and hygiene, mistakes on budget year and baseline, budget of 2009 and 2010 exactly same, budget too small,
12 Atwima Nwabiagya 0
13 Bekwai Asante 2 0 1 1 0 1 0 0 5 No action for girls edu and few actions for quality improvement, JSS GAR targets seem too low, budget too small,
14 Bosome Freho new 0
15 Bosomtwe 0
16 Ejisu-Juaben Municipal 0
17 Ejura/ Sekyedumase 2 0 1 1 1 1 0 0 6 2009-11, no section for girls education, primary GAR targets too low, activities not specific, not sure costing are appropriate, all activities supported by DFID??
18 Kumasi Metropolitan 0
19 Kwabre 2 0 2 2 2 2 0 1 11
20 Mampong Municipal 0 0 0 1 1 1 0 0 3 Standard form not used, no outcome level target set, too detailed activities listed, old and new currency confused,
21 Obuasi Municipal 2 0 0 0 0 0 0 0 2 No info on quality, STTVET and EM. Mr. Kofi Nti stated on 22 Mar 2011 that the district does not put importance on these areas, budget too small,
22 Offinso Municipal 2 0 1 1 0 1 0 1 6 JHS GER targets not realistic, budget too small,
23 Offinso North new 0 0 0 1 0 1 0 0 2 Standard form not used, no outcome level target set, budget too small
24 Sekyere Afram Plains new 0 0 0 0 0 0 0 0 0This is an exact copy of Sekyere East
25 Sekyere Central new 0
26 Sekyere East 2 2 1 1 2 1 0 1 10 GER targets too high, activities too detailed,
27 Sekyere South 2 0 1 1 2 1 0 1 8 Primary GAR too low, no girls education
section,
Actual Score total 30 4 15 24 18 18 0 11 120
Full score total 36 36 36 36 36 36 36 36 230
% 83.3% 11.1% 41.7% 66.7% 50.0% 50.0% 0.0% 30.6% 52.2%
Total Number submitted 18
% of submission
66.7%
Brong Ahafo Region
1 Asunafo North Municipal 0 0 0 1 0 2 0 0 3 Different form, no outcome targets, activities too detailed, budget too much,
2 Asunafo South 0
3 Asutifi 0 0 0 1 0 1 0 0 2 No budget figures, no ST and EM, no outcome
targets for the next three years, five years instead of three years, activities are just copies of new ESP.
4 Atebubu-Amantin 0
5 Berekum Municipal 0
6 Dormaa East new 0
7 Dormaa Municipal 0 0 0 1 0 1 0 0 2 Activities too detailed, HIV-AIDS for KG teachers??, primary GER targets too low, budget unrealistic,
8 Jaman North 2 0 0 1 0 1 0 0 4 No targets available, not sure activities are relavant because of no targets, its structure very confused, budget unrealistic,
9 Jaman South 0 0 0 1 0 1 0 0 2 Different form, ADEOP and ADEAP mixed
together, no outcome targets, no budget figure,
10 Kintampo North Municipal 0 0 0 1 2 1 0 0 4 Structure confused, primary GER targets too low,
11 Kintampo South 2 0 1 2 1 2 0 0 8 Enrolment targets too low according to EMIS, no enrolment rate targets, TVET budget wrong,
12 Nkoranza North new 2 0 1 2 2 2 0 0 9 2008-10, no outcome targets,
13 Nkoranza South 0
Page 2 GHANA DISTRICTS
Q1: U se of s
tandard
form ?
Q2: V ision
and M ission
state d?
Q3: T arget
relev ant?
Q4: A ctivit
y rele vant
?
Q5: C ostin
g rele vant
?
Q6: S MAR
T activ ities?
Q7: A DPR r
ecom .
refle cted?
Q8: D P acti
vities refle cted? Total Scor e Gene ral Re
mark s
15 Sene 0 0 0 1 1 2 0 0 4 Seems incomplete,
16 Sunyani Municipal 2 0 1 2 2 2 0 0 9 Targets of primary GAR too low, JH NER too high,
17 Sunyani West new
18 Tain 2 0 1 2 0 2 0 0 7 No enrolment rate targets, budget too small
19 Tano North 0 District Education Medium Term Plan (not
ADEOP),
20 Tano South 2 0 1 2 2 2 0 0 9 No enrolment rate targets,
21 Techiman Municipal 2 0 1 2 1 2 0 0 8 Primary GER target too low, budget
unrealistic,
22 Wenchi Municipal 2 0 1 2 0 2 0 0 7 2008-10, no outcome targets, no budget for 2008
Actual Score total 16 0 7 21 11 23 0 0 78
Full score total 28 28 28 28 28 28 28 28 224
% 57.1% 0.0% 25.0% 75.0% 39.3% 82.1% 0.0% 0.0% 34.8%
Total Number submitted 14
% of submission
63.6%
Central Region
1 Abura/ Asebu/ Kwamankese 2 2 1 2 2 1 0 1 11 2009-11, Primary GER target not realistic, expenditure not fully reported,
2 Agona East new 0 Covered by Agona West
3 Agona West Municipal 2 2 1 2 2 1 0 1 11 2008-10, GAR/GER targets lower than actual,
4 Ajumako/ Enyan/ Essiam 2 0 1 2 2 2 0 1 10 2009-11, year of baseline and budget not indicated, primary GER target wrong,
5 Asikuma/ Odoben/ Brakwa 2 0 2 2 1 2 0 0 9 2011-13, budget for 2010,
6 Assin North Municipal 2 0 1 2 2 2 0 0 9 2009-11, primary GER target a bit too high, 7 Assin South 2 0 1 2 2 1 0 0 8 GER targets too low at all levels, target of % of
trained teachers in JHS too high, no reflection of ADPR recommendations,
8 Awutu-Senya new 2 0 2 2 2 2 0 2 12
9 Cape Coast Metropolitan 2 0 1 1 2 1 0 0 7 Enrolment targets not properly projected, no science/technology and TVET,
10 Effutu Municipal 0
11 Gomoa East new 2 0 1 2 0 2 0 2 9 2009-11, Not clear how targets were set
though no enrolment rate available, no recommendations from ADPR, budget too old (2008),
12 Gomoa West 2 0 1 2 2 1 0 0 8 GER targets may be too high, targets of % of
trained teachers unrealistic,
13 Komenda/ Edina/ Eguafo/ Abirem 2 0 1 2 2 2 0 1 10 there are activities without costing, primary GER target too high,
14 Mfantseman Municipal 2 0 1 2 2 1 0 2 10 GER target for JHS may be too high, targets of % of trained teachers unrealistic, 15 Twifo/ Heman/ Lower Denkyira 2 2 1 2 0 1 0 0 8 2008-10, GER too low compared to EMIS,
budget too small
16 Upper Denkyira East Municipal 2 0 1 1 1 1 0 0 6 2008-10, GER target a bit too low, construction activity redundant. Budget one year old,
17 Upper Denkyira West new 0
Actual Score total 28 6 16 26 22 20 0 10 128
Full score total 28 28 28 28 28 28 28 28 245
% 100.0% 21.4% 57.1% 92.9% 78.6% 71.4% 0.0% 35.7% 52.2%
Total Number submitted 14
% of submission
82.4%
Eastern Region
1 Akuapim North 0
2 Akuapim South Municipal 2 0 1 2 2 2 0 0 9 2009-11,
3 Akyemansa new 0
4 Asuogyaman 0
5 Atiwa 0
6 Birim Central Municipal 0 0 0 0 0 0 0 0 0Combined to Birim South but no info
7 Birim North new 2 0 1 2 2 1 0 2 10 2009-11, GER targt too high,
8 Birim South new 2 2 2 2 2 2 0 0 12 2008-10 and 2010-12 are mixed, orientation workshops can provide qualified teachers?, no health related activities,
9 East Akim Municipal 0
10 Fanteakwa 0
11 Kwaebibirem 2 0 2 2 0 2 0 0 8 budget unrealistic,
12 Kwahu East new 0
13 Kwahu North 2 0 1 2 2 1 0 1 9 2008-10, primary GER target too high,
14 Kwahu South 0
15 Kwahu West Municipal 0
16 Lower Manya Krobo 0
17 New-Juaben Municipal 0
18 Suhum/ Kraboa/ Coaltar 0
19 Upper Manya Krobo new 0
20 West Akim Municipal 0
21 Yilo Krobo 0
Page 3 GHANA DISTRICTS
Q1: U se of s
tandard
form ?
Q2: V ision
and M ission
state d?
Q3: T arget
relev ant?
Q4: A ctivit
y rele vant
?
Q5: C ostin
g rele vant
?
Q6: S MAR
T activ ities?
Q7: A DPR r
ecom .
refle cted?
Q8: D P acti
vities refle cted? Total Scor e Gene ral Re
mark s
Full score total 12 12 12 12 12 12 12 12 96
% 83.3% 16.7% 58.3% 83.3% 66.7% 66.7% 0.0% 25.0% 50.0%
Total Number submitted 6
% of submission
28.6%
Greater Accra Region
1 Accra Metropolitan 2 0 1 2 0 2 0 0 7 figures of enrolment targets not natural, budget is somehow for 2011, no recommendations from ADPR, budget too small,
2 Adenta municipal new 0
3 Ashaiman municipal new 2 0 1 2 1 1 0 1 8 no plan for education management, enrolment target figures seem unrealistic, budget of some activities not shown, fiscal year/school year confusion, some areas do not have activities, recommendations from ADPR not available,
4 Dangme East 2 0 1 2 0 1 0 1 7 no plan for constructing classrooms, name of
DPs not shown, no recommendations in ADPR 2009/10, budget too small,
5 Dangme West 2 0 1 2 0 0 0 0 5 2011-13, no costing, activities copied from
national plan,
6 Ga East Municipal 2 0 1 1 2 1 0 0 7 No targets for 2012, enrolment rate targets not shown, completion rate targets not shown, baseline data remained in 2005/06, classroom construction is planned for improving PTR, why iodized salt consumption?, No EM,
7 Ga West Municipal 2 0 0 1 0 1 0 0 4 No recommendation in ADPR 2008/09, no
targets shown at all, no budget figures shown,
8 Ga South (Weija) municipal 2 0 1 1 2 2 0 0 8 2009-11, No specific recommendations to AMEOP, no enrolment rate targets, no PTR targets, too many detailed activities listed (74),
9 Ledzekuku-Krowor municipal new 0
10 Tema Metropolitan 2 0 1 2 0 1 0 0 6 targets and activity do not match, Budget of many activities not shown, No activities for educational management, not sure whether targets are relevant, ADPR not available, new and old currency confused,
Actual Score total 16 0 7 13 5 9 0 2 52
Full score total 16 16 16 16 16 16 16 16 128
% 100.0% 0.0% 43.8% 81.3% 31.3% 56.3% 0.0% 12.5% 40.6%
Total Number submitted 8
% of submission
80.0%
Northern Region
1 Bole 2 0 1 2 0 2 0 0 7 Primary GAR too high, budget unrealistic,
2Bunkpurugu-Yunyoo 0 0 0 1 2 1 0 2 6 Different form used, no outcome targets set,
3 Central Gonja 2 0 0 1 2 1 0 1 7 No outcome targets,
4 Chereponi new 2 0 0 1 0 1 0 1 5 No budget figures, no outcome targets,
5 East Gonja 2 0 1 1 1 1 0 1 7 Base line figures newer than targets, GAR/GER
targets wrong, old currency on budget,
6 East Mamprusi 2 0 0 1 0 1 0 0 4 No outcome targets, budget too small,
7 Gushegu 0 0 0 1 0 1 0 1 3 Standard form not used, no outcome targets,
budget totally unrealistic,
8Karaga 0 0 0 1 2 2 0 1 6 Different form used, no outcome targets,
9 Kpandai new 0 0 0 1 2 1 0 1 5 Different form used, no outcome targets set,
10 Nanumba North 2 0 0 2 1 2 0 1 8 No target
11Nanumba South 2 0 1 2 2 1 0 1 9 GER targets too high,
12 Saboba 2 0 1 1 2 1 0 1 8 2007-09, GAR targets going down,
13Savelugu/ Nanton 2 0 1 1 1 1 0 1 7 Tried to follow the new ESP, most of activities
no targets, activities just copied from the new ESP,
14 Sawla-Tuna-Kalba 2 0 0 1 2 1 0 0 6 No outcome targets,
15Tamale Metropolitan 2 0 0 1 0 1 0 0 4 2009-11, Looks incomplete,
16 Tolon/ Kumbungu 2 0 1 2 2 2 0 1 10 Baseline too old, GER/GAR too different from ADPR,
17 West Gonja 0 0 0 1 1 1 0 0 3 Form different, no section of quality
improvement,
18West Mamprusi 0 0 0 2 0 1 0 1 4 Form different, output and outcome confused,
no enrolment rate target, no budget, target year range different.
Page 4 GHANA DISTRICTS
Q1: U se of s
tandard
form ?
Q2: V ision
and M ission
state d?
Q3: T arget
relev ant?
Q4: A ctivit
y rele vant
?
Q5: C ostin
g rele vant
?
Q6: S MAR
T activ ities?
Q7: A DPR r
ecom .
refle cted?
Q8: D P acti
vities refle cted? Total Scor e Gene ral Re
mark s
20Zabzugu/ Tatale
2 0 1 2 2 1 0 1 9 GAR/GER target in primary too high,
Actual Score total 26 0 7 27 24 24 0 16 124
Full score total 40 40 40 40 40 40 40 40 320
% 65.0% 0.0% 17.5% 67.5% 60.0% 60.0% 0.0% 40.0% 38.8%
Total Number submitted 20
% of submission
100.0%
Upper East Region
1 Bawku West 0 0 0 1 0 1 0 1 3 2009-11, very few targets, budget too small,
2 Bolgatanga Municipal 0
3 Bongo 0 0 0 1 2 1 0 1 5 2009-11, no outcome targets shown,
4 Builsa 0 0 0 1 2 1 0 1 5 2009-11, very few targets,
5 Garu-Tempane 0 0 0 1 2 1 0 1 5 2009-11, no year indicated, no outcome
targets shown, no policy link,
6 Kassena Nankana West new 0
7 Kassena/ Nankana 0
8 Talensi-Nabdam 0 0 0 1 0 1 0 1 3 2009-11, no outcome targets shown, budget
unrealistic,
9 Bawku Municipal 0 0 0 1 2 1 0 1 5 2009-11, many of 2nd and 3rd year activities not shown, no outcome targets, activities too detailed,
Actual Score total 0 0 0 6 8 6 0 6 26
Full score total 12 12 12 12 12 12 12 12 96
% 0.0% 0.0% 0.0% 50.0% 66.7% 50.0% 0.0% 50.0% 27.1%
Total Number submitted 6
% of submission
66.7%
Upper West Region
1 Jirapa 2 0 1 2 2 1 0 0 8 Enrolment rates seem different from emis,
2 Lambussie Karni new 0
3 Lawra 2 0 1 2 0 2 0 2 9 2009-11, GAR/GER targets not reflecting
reality, budget is for 2008, budget unrealistic,
4 Nadowli 2 0 1 1 0 1 0 1 6 No GER targets, budget too small,
5 Sissala East 2 0 1 2 2 1 0 1 9 2009-10, GER targets lower than actual,
6 Sissala West 0 0 0 1 0 2 0 1 4 2009-10, structure confused, no outcome
targets, budget unrealistic,
7 Wa East 2 0 1 2 0 1 0 2 8 2009-11, the form reorganised and confused,
GER targets not shown, budget too small,
8 Wa Municipal 0
9 Wa West 0 0 0 1 0 1 0 1 3 2009-11, no outcome targets, budget
unrealistic,
Actual Score total 10 0 5 11 4 9 0 8 47
Full score total 14 14 14 14 14 14 14 14 112
% 71.4% 0.0% 35.7% 78.6% 28.6% 64.3% 0.0% 57.1% 42.0%
Total Number submitted 7
% of submission
77.8%
Volta Region 1 Adaklu-Anyigbe
2Akatsi 2 0 1 2 2 1 0 1 9 Structure mixed together,
3 Biakoye District new 0
4Ho Municipal 2 0 1 2 2 2 0 1 10 2009-11, targets different from ADPR,
5 Hohoe Municipal 0
6Jasikan 2 0 1 1 0 1 0 0 5 No enrolment rate targets, SHS and NFE
included, budget too much,
7 Kadjebi 2 0 1 2 2 1 0 0 8 Baseline too old, NAR/NER targets too high,
budget too much,
8Keta Municipal 0
9 Ketu North new 2 0 1 2 1 1 0 0 7 Structure confused, SHS included, enrolment targets may be too low, not clear about which year's budget,
10Ketu South 0
11 Kpando 2 0 2 1 1 1 0 0 7 No ST and EM, SHS included, no GAR targets
for primary, activities simply copied from new ESP,
12 Krachi East 0
13 Krachi West 0
14 Nkwanta South 2 0 1 1 0 1 0 0 5 NER targets not available, construction budget unrealistic,
15 Nkwanta North new 2 0 1 2 2 1 0 0 8 2011-13, no NER targets, no JHS enrolment targets, GER targets may be too low,
16 North Tongu 0
Page 5 GHANA DISTRICTS
Q1: U se of s
tandard
form ?
Q2: V ision
and M ission
state d?
Q3: T arget
relev ant?
Q4: A ctivit
y rele vant
?
Q5: C ostin
g rele vant
?
Q6: S MAR
T activ ities?
Q7: A DPR r
ecom .
refle cted?
Q8: D P acti
vities refle cted? Total Scor e Gene ral Re
mark s
18South Tongu
2 0 1 2 2 1 0 0 8 Primary GER target too low,
Actual Score total 20 0 11 16 14 11 0 2 74
Full score total 20 20 20 20 20 20 20 20 160
% 100.0% 0.0% 55.0% 80.0% 70.0% 55.0% 0.0% 10.0% 46.3%
Total Number submitted 10
% of submission
55.6%
Western Regions
1 Ahanta West 2 0 2 2 2 2 0 0 10 base line data too old (2005-06), budget for 2009, budget in old currency,
2 Aowin/ Suaman 2 0 2 2 2 2 0 0 10
3 Bia 2 0 2 2 2 2 0 0 10
4 Bibiani/ Anhwiaso/ Bekwai 2 0 2 2 2 2 0 0 10 2008-10, no district indicative target 2015, no ST,
5 Ellembelle new 2 0 1 2 2 2 0 2 11 targets of GER and TT unrealistic,
6 Jomoro 2 0 1 2 2 2 0 2 11 Target of GER of KG too low, target of TT%
unrealistic,
7 Juaboso 2 0 2 2 2 2 0 0 10 2008-10,
8 Mpohor/ Wassa East 2 0 1 2 2 2 0 2 11 EM missing, GER targets look too high, 9 Nzema East Municipal 2 0 1 2 2 2 0 2 11 Quality related targets not filled, no primary
GER targets, JS GER targets too high,
10 Prestea-Huni Valley new 2 0 2 2 0 2 0 0 8 Budget too high,
11 Sefwi Akontombra new 2 0 1 2 2 2 0 2 11 KG GER targets too high,
12 Sefwi-Wiawso 2 0 1 2 2 2 0 2 11 targets of KG GER too high,
13 Sekondi Takoradi Metropolitan 0
14 Shama new 2 0 0 1 0 0 0 0 3 2009-11, many areas have no activity, no
enrolment target shown, very poor quality of plan,
15 Tarkwa Nsuaem Municipal 0
16 Wasa Amenfi East 2 0 1 2 0 2 0 2 9 no enrolment related targets other than GER, total budget unrealistic,
17 Wasa Amenfi West 0
Actual Score total 28 0 19 27 22 26 0 14 136
Full score total 28 28 28 28 28 28 28 28 224
% 100.0% 0.0% 67.9% 96.4% 78.6% 92.9% 0.0% 50.0% 60.7%
Total Number submitted 14
% of submission
82.4%
Total
Actual Score total 184 12 94 181 136 154 0 72 833
Full score total 234 234 234 234 234 234 234 234 1872
% 78.6% 5.1% 40.2% 77.4% 58.1% 65.8% 0.0% 30.8% 44.5%
Total Number submitted 117
% of submission
Page 6
Analysis on budget and expenditure
GHANA DISTRICTS Annual Budget in ADEOP total
Year Public KG Public Pri Public JHS Total Budget per student
Info source Remark Expenditure except PE reported in ADPR
Year
Ashanti Region.
1 Adansi North 503,470.0 2008 7458 18771 6026 32255 15.61 emis 2 Adansi South
3 Afigya-Kwabre new 3,716,900.0 2010 no enrolment
info available
4 Ahafo Ano North 518,016.0 2010 4476 13351 5052 22879 22.64 emis 105,152.00 2009 5 Ahafo Ano South 984,942.4 2009 8224 18480 5891 32595 30.22 emis
6 Amansie Central 5,695,704.0 2009 5866 12862 4122 22850 249.26 emis 36,603.42 2009 7 Amansie West 4,584,100.0 2010 11259 25362 7883 44504 103.00 emis
8 Asante Akim North Municipal
9 Asante Akim South 1,708,900.0 2009 7596 25362 7883 40841 41.84 emis 193,484.93 2009 10 Atwima Kwanwoma new
11 Atwima Mponua 185,500.0 2010 10060 23599 6531 40190 4.62 emis 22,100.00 2009 12 Atwima Nwabiagya
13 Bekwai Asante 340,174.0 2010 6406 19573 11446 37425 9.09 ADPR 2009-10 all schools in red colour
na
14 Bosome Freho new 15 Bosomtwe 16 Ejisu-Juaben Municipal
17 Ejura/ Sekyedumase 575,000.0 2008 6878 14303 3608 24789 23.20 emis 86,215.99 2009 18 Kumasi Metropolitan
19 Kwabre 1,318,270.0 2009 9657 14303 3608 27568 47.82 emis na
20 Mampong Municipal 8,946,470.0 2010 11675 28451 9922 50048 178.76 ADPR 2009-10 25,871.15 2009 21 Obuasi Municipal 137,500.0 2010 4219 18212 9159 31590 4.35 emis na
22 Offinso Municipal 268,419.0 2009 10569 31118 8705 50392 5.33 ADPR 2009-10 2009-10 218,423.17 2009 23 Offinso North new 27,100.0 2012
24 Sekyere Afram Plains new na
25 Sekyere Central new
26 Sekyere East 1,160,276.0 2009 8777 21347 7607 37731 30.75 ADPR 2009-10 839,535.18 2009 27 Sekyere South 3,165,444.0 2009 11273 27176 10098 48547 65.20 ADPR 2008-09 na
Total 33,836,185.4 544,204 62.18 1,527,385.8 Average 1,990,363.8 32,012 62.18 89,846.2 Highest 8,946,470.0 50,392 249.26 839,535.2 Lowest 27,100.0 22,850 4.35 22,100.0
Brong Ahafo Region
1 Asunafo North Municipal 19,951,760.0 2010 9458 19496 6738 35692 559.00 ADPR 2009-10 54,124.34 2010 2 Asunafo South
3 Asutifi 4 Atebubu-Amantin 5 Berekum Municipal 6 Dormaa East new
7 Dormaa Municipal 37,070,050.0 2010 8020 21922 5651 35593 1,041.50 ADPR 2009-10 104,185.38 2010 8 Jaman North 49,890,485.0 2010 5758 11485 4784 22027 2,264.97 emis na
9 Jaman South
10 Kintampo North Municipal 923,400.0 2010 6316 12712 4185 23213 39.78 emis 11 Kintampo South 3,924,648.0 2009 6180 11285 2559 20024 196.00 emis
12 Nkoranza North new 6,178,744.7 2008 10887 23511 6155 40553 152.36 ADPR 2009-10 107,053.00 2008 13 Nkoranza South
14 Pru
15 Sene 527,500.0 2010 7090 15385 3365 25840 20.41 emis
16 Sunyani Municipal 2,235,659.0 2010 5406 14949 6467 26822 83.35 ADPR 2008-09 2008-09 38,125.00 2008 17 Sunyani West new
18 Tain 209,291.1 2011 7462 16255 4773 28490 7.35 ADPR 2009-10 2009-10 127,531.50 2009 19 Tano North
20 Tano South 2,712,215.0 2010 6883 12590 4277 23750 114.20 emis 129,904.94 2009 21 Techiman Municipal 8,642,676.0 2010 12131 30256 11557 53944 160.22 emis 60,179.33 2009 22 Wenchi Municipal 1,367,186.0 2007 6035 15370 4205 25610 53.38 ADPR 2009-10 2007-08 111,162.48 2009
Total 133,633,614.8 361,558 369.60 732,266.0 Average 11,136,134.6 30,130 369.60 91,533.2 Highest 49,890,485.0 53,944 2,264.97 129,904.9 Lowest 209,291.1 20,024 7.35 38,125.0
Central Region
1 Abura/ Asebu/ Kwamankese 893,220.0 2009 7166 16240 5729 29135 30.66 ADPR 2009-10 2008-09 na 2 Agona East new
3 Agona West Municipal 3,733,793.0 2008 8424 27957 10264 46645 80.05 ADPR 2009-10 2007-08 3,432,261.45 2008 4 Ajumako/ Enyan/ Essiam 1,119,450.0 2009 8407 18000 6769 33176 33.74 ADPR 2009-10 2008-09 41,740.06 2009 5 Asikuma/ Odoben/ Brakwa 4,252,020.0 2010 7842 21230 7146 36218 117.40 emis
6 Assin North Municipal 3,986,900.0 2009 9413 24571 9003 42987 92.75 emis
7 Assin South 902,400.0 2009 7783 19832 6881 34496 26.16 ADPR 2009-10 2008-09 32,748.00 2009 8 Awutu-Senya new 5,711,050.0 2009 9643 31569 13535 54747 104.32 emis 711,345.00 2008 9 Cape Coast Metropolitan 2,056,740.0 2010 4657 16484 7305 28446 72.30 ADPR 2009-10 135,296.97 2009 10 Effutu Municipal
11 Gomoa East new 2,649,780.5 2008 5711 25045 6294 37050 71.52 ADPR 2009-10 2009-10 na 12 Gomoa West 1,461,900.0 2010 6348 32688 6294 45330 32.25 ADPR 2009-10 na
13 Komenda/ Edina/ Eguafo/ Abirem 728,597.7 2010 5916 19383 7242 32541 22.39 ADPR 2009-10 23,485.48 2009 14 Mfantseman Municipal 631,600.0 2010 9842 27275 9618 46735 13.51 ADPR 2009-10 32,138.36 2009 15 Twifo/ Heman/ Lower Denkyira 227,702.0 2008 9761 19676 7752 37189 6.12 ADPR 2008-09 2007-08 na