COMMISSION OF THE EUROPEAN COMMUNITIES
Brussels, 08.09.1999 SEC( 1999) 1386 final
DRAFT JOINT EMPLOYMENT REPORT 1999
JOINT EMPLOYMENT REPORT 1999
PART I
THE EUROPEAN UNION
EXECUTIVE SUMMARY
DRAFT JOINT EMPLOYMENT REPORT 1999
The present draft Joint Employment Report is the second elaborated since the launch of the Luxembourg Process. It is based on the Commission's analysis of the Member States' implementation reports on their 1998 National Action Plans (NAP) for Employment and on the examination of how the 1999 Employment Guidelines have been translated into revised NAPs for 1999. Its aim is to assess compliance by the Member States with commitments set by the Employment Guidelines, and to undertake a first evaluation of policy efforts and of their impact on labour markets. The present Report will form the basis of the Joint Employment Report that the Commission and the Council will jointly submit to the Helsinki Summit in December
1999.
The Report is structured in two parts. Part I offers a comparative overview of Member States' performance under each of the four pillars of the Employment Guidelines and a thematic assessment of whether policies implemented by Member States comply with the individual guidelines, and the role and degree of involvement of the various actors in this process. Part I also highlights some examples of good practice identified by the Member States, which will be subject to a more detailed evaluation, with the purpose of improving the quality of labour market policies.
Part II presents a description of the key employment challenges facing Member States, and an assessment of the policy measures implemented in each individual Member State in the light of its NAP 1998, as well as of new policies initiated m reference to the 1999 Employment Guidelines.
The analysis contained in this Report underpins the recommendations addressed to Member States which the Commission is proposing this year for the first time following the entry into force of the new Treaty on 1 May 1999. The Commission has been mindful of the need to ensure consistency between these recommendations and those set out in the Broad Economic Policy Guidelines drawn up under Article 1 03(2) of the Treaty. Furthermore, Member States are required to implement their employment policies in a way which is consistent with the Broad Economic Guidelines in accordance with Article 126 of the Treaty.
The following key messages emerge from this draft Report:
• Major structural challenges persist in the Member States' labour markets. The last four years of economic recovery have done little to improve the low employment rate in the Union, which, at 61%, is still lagging considerably behind that or our main trading partners, the US and Japan. Low participation in employment concerns in particular prime-age women and older people. The employment rate of women, at around"' 51%, is still 20 percentage points lower than that of men. For older people in the age bracket between 50 and 64 years, the employment rate amounted to only 47.6%. Long-term unemployment remains a persistent and severe problem, affecting 5.2 million people in 1998. While unemployment of young people has continued to fall in 1998, more than 4.3 million young people are still unemployed, representing an average share of9.3% of youth population. Unemployment continues to affect women more than men, and the gender gap remains over 3%.
• The Member States are responding to the challenges by adopting more preventive and active strategies. There is now a clear move towards a preventive approach in combating youth and adult long-term unemployment, but some Member States are more advanced than others in setting up the necessary framework for complying with the EU - level targets: to offer to all young and adult unemployed a new start before 6 or 12 months of unemployment. Four groups of Member States emerge from the analysis: Sweden, UK, Denmark and Ireland, for example, have complied or are about to comply with the targets. France, Spain, Portugal, Finland and Austria have set in motion a reform process which is expected to bring about results in line with the guidelines and before the agreed deadline of 2002. More progress is expected from Germany, Netherlands and Luxembourg, while concerns are raised by the delays in implementation in the cases of Belgium, Greece and Italy.
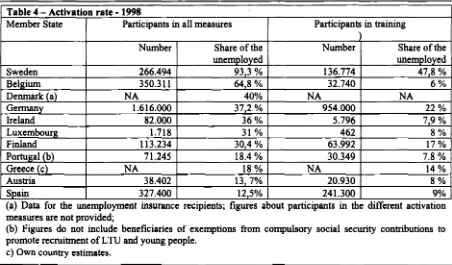
As regards the activation of policies required by guideline 3, a maJonty of Member States reached, some even exceeded, the 20 % target on participation in active measures for the unemployed. Some Member States - France, Austria, Spain, Greece and Portugal - recognise that they have not yet reached the target but indicate that policy efforts are being taken with a view to reach it before 2002. Concerns are raised by the lack of comparable information from Italy, Netherlands and the UK. More generally, evidence shows that the training content of active measures vary widely across individual Member States, and that further efforts are requit~d in order to evaluate the cost-effectiveness of some measures and ensure that they lead to integration in the labour market.
• Tax and benefit systems are being reviewed, but progress is slow. Reforms in the
tax
and benefit systems are a means to provide incentives for participation in working life, in particular for women and older workers. To meet this challenge, a number of Member States are in the process of reviewing, and to some extent reforming, their tax and benefit system. Given the high expectations, however, the overall response appears to be weak. Further efforts are warranted in order to move from passive income support to active measures supporting employability.• Member Sates are recognising the crucial role of lifelong learning. Investment in education and training are key to developing the strength and flexibility of EU enterprises and the employability of the EU workforce m a context of fast
technological changes affecting the nature and organisation of work. Participation in lifelong learning activities remains, however, inadequate and concrete targets are lacking in many Member States. Comprehensive strategies and concrete action by Member States and social partners are therefore required to raise the skill levels across the Union.
. ...
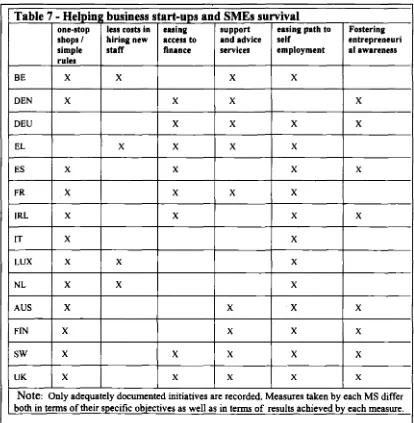
• Member States report on a large number of initiatives to improve entrepreneurship, but the lack of precise targets and deadlines, as well as the scarcity of comparable indicators, make the assessment of achievements rather difficult, including as regards job creation in services. Most Member States refer to measures associated with the promotion of the information society and care services. Overall, measures taken by the Member States in 1998 fail, however, to address in a comprehensive and adequate way the need to develop the services sector. Also, more needs to be done to enhance local development and the job creation at local level. The role of small businesses in providing the major impetus for economic growth and job creation is generally recognised, and Member States reported on some encouraging progress in reducing the administrative burdens which hamper their job creation potential. The need to make the taxation system more employment friendly was generally recognised in the implementation reports, but concrete initiatives are scarce and national targets for the reduction of fiscal pressure on labour have not been set by many Member States.
• More progress is required in the promotion of adaptability through modernising the organisation of work, where the social partners have a particular responsibility. Encouraging adaptability of businesses and their employees is key to enhancing the innovative capacity, productivity and competitiveness of businesses, on one hand, and the security of their workers, on the other. The response to this broad challenge has been rather disappointing and mostly focused on the issue of working time. With a few exceptions, the participation of social partners in promoting adaptability needs to be more proactive in all Member States and more concrete initiatives are called for.
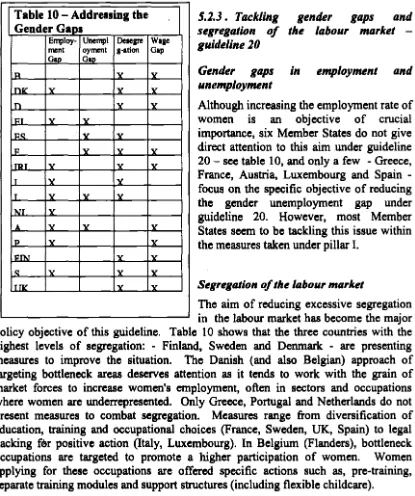
• Reinforced policy efforts should be directed to the persistent lack of equality between women and men in the labour market. There is ample room for improvement, in particular for actions to close the gender gaps in employment, unemployment and pay, to redress the unbalanced representation of women and men across sectors and occupations, and to improve care for children and other dependants. The indicators presented in this Report tend to highlight women's persistently poor labour market position compared with men.
The partnership approach must be further developed. The social partners play
a crucial role in the making and implementation of labour market policy, both nationally and locally. Their involvement at all levels throughout the employment process is central to channeling structural change into more and better jobs. Based on the traditions of partnership intlie
different national contexts, the social partners have participated in a variety of ways in the NAP process. However, concrete action initiated by social partners to transpose the Employment Guidelines into effective outcomes appears to be rather weak. Scope for the involvement of local and regional actors arises under all the pillars. Although partnership approaches are very varied across the Union, all Member States agree on the need to develop the territorial dimension of their employment policies, in particular through local partnerships.Disseminating good practice
The exchange of good practice is an important aspect of the Luxembourg process. Good practices show how Employment Guidelines can be transposed into national or regional contexts. They are also meant to speed up the learning process at EU level by sharing experience, by building on success and learning from past failures. A peer review exercise is underway, which will produce a multilateral assessment of the best practices indicated in last year's Joint Employment Report.
The Member States presented 27 cases of good practice in their 1999 implementation reports, of which 7 are described in this Report. The selection was based on the availability of some monitoring and evaluation. The examples are, by pillar:
Employability:
• "lnserjovem" and "Reage" initiatives in Portugal • Activation of benefits in Belgium
• Additional school support scheme in Greece
• Work place suppo~ for persons with disabilities in Sweden Entrepreneurship:
• The Single Counter in the Catania Municipality in Italy Adaptability:
• Labour foundation in the construction industry in Asturias (Spain) Equal opportunities:
• Development of children's day care in Finland
Introduction
This Report is the first to be formally submitted in accordance with Article 128 of the Amsterdam Treaty. Its pwpose is to present the conclusions drawn from the examination of the measures taken by Member States to implement the Employment Guidelines, in the light of their employment situation. It provides the basis for the Joint Employment Report that the Commission and the Council will jointly submit to the European Council meeting in Helsinki in December 1999.
The Report is structured in two parts. The first offers, for each of the four pillars of the Employment Guidelines, a comparative overview of Member States' performances, including a thematic assessment of the policies and measures undertaken under the National Action Plans. It also highlights some examples of good practice that Member States have identified in their implementation reports.
The second part presents, for each Member State, a detailed analysis of the policy measures implemented under the 1998 National Action Plan or announced in the revised 1999 NAPs, in the light of its employment situation. The Report includes, to the extent possible given the short time that has elapsed since the actual launch ofthe implementation of most new policies and measures, a first assessment of the outcome of each Member State's National Action Plan. The analysis and conclusions included in this Report provide the basis for the new Employment Guidelines for 2000 as well as for the Commission's Recommendation to the Council for recommendations addressed to Member States on the implementation of their employment policies.
l. The Employment Guidelines for 1999
With the adoption of the 1999 Employment Guidelines, the Luxembourg process entered in its second year of implementation. The 1999 Employment Guidelines1 maintain the integrated and multiannual approach and the four-pillar structure geared towards improving employability, entrepreneurship, adaptability and equal opportunities.
They have been strengthened in a number of areas, as a result of the examination of the National Action Plans undertaken in 1998.
• Particular emphasis has been put on achieving tangible progress in promoting equal opportunities between women and men, in particular by a gender mainstreaming approach across all pillars.
• The importance of lifelong learning in the development of a skilled and adaptable workforce is reinforced and Member States are called upon to set targets to achieve_ progressively higher participation rates in lifelong learning.
1
The 1999 employment guidelines were adopted by the Council resolution of22 February 1999.
• A new guideline specifically addresses the need to fully exploit the jobs potential of the services sector, in particular in the area of information technologies and in the environmental sector.
• More emphasis is placed on the need for an examination of the tax-benefit systems in order to provide incentives for the unemployed and inactive individuals to take up work or training opportunities.
• Furthermore, supporting measures are sought for older workers to increase their participation in the labour force and for a labour market open to all, including disadvantaged groups and individuals.
2. The National Action Plans for 1999
The 1999 Employment Guidelines served as a basis for the preparation of the 1999 National Action Plans (NAPs). The Council Resolution requested Member States to submit by the end of May implementation reports describing in detail the main measures taken to implement the 1998 National Action Plans and the adjustments made to take into account the 1999 Employment Guidelines.
In the first quarter of 1999, a series of bilateral seminars were held with each of the fifteen Member States to discuss tbe preparation ofthe revised NAPs. A broad range of government departments, as well as the representatives of social partners and, in some Member States, also the regional authorities, participated in the seminars and subsequently were to varying extents involved in the actual revision of the NAPs. The bilateral seminars served to highlight the main strengths and weaknesses in the employment situation of each country and to launch a debate around the most significant policy issues arising from last year's assessment of the NAPs. Given their positive results, the bilateral seminars are likely to become a permanent feature of the process.
3. Progress in setting common indicaton
The Luxembourg process requires the setting of verifiable objectives and deadlines in employment-policy making both at European and at national level. This in tum requires the development of a comprehensive set of indicators for measuring both policy efforts and outcomes as regards the Employment Guidelines.
In monitoring the Employment Guidelines, three objectives are pursued:
1. Assessing whether the policies implemented in the context of the Employment Guidelines are producing the desired impact. For this purpose, a set of basic performance indicators measuring trends in employment, unemployment and some key macro-economic variables were developed and already used in the 1998 Joint Employment Report.
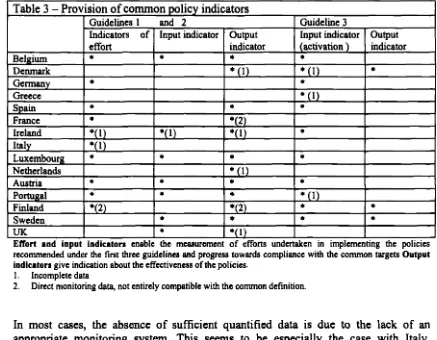
2. Measuring the policy efforts undertaken by the Member States in transposing the EU-level operational targets set in the first three guidelines on prevention and activation into national policy and evaluating their effectiveness. This calls for common policy indicators developed on the basis of administrative data on beneficiaries of employability policies and on stocks and flows into and out of unemployment.
3. Monitoring the progress achieved by Member States over the medium-term towards more structural goals as set by the Employment Guidelines. This needs to be done with the help of structural (performance) indicators for areas such as education and training, entrepreneurial activity, employment in services, taxation and equality of opportunities between women and men.
Significant progress has been achieved in 1999 with respect to common policy indicators. A set of indicators for the first three guidelines on prevention and activation was agreed in May by the Commission and the Member States under the auspices of the Employment and Labour Market Committee (ELC), and submitted to the Cologne Summit. The Member States were asked to step up the adaptation of their monitoring systems so as to provide data in accordance with the newly agreed indicators in their 1999 implementation reports, thus allowing for a more objective assessment of progress towards the common policy targets.
However, further work still needs to be done, with the aim of reaching an agreement on a comprehensive monitoring system. This will require both the further development of appropriate indicators and the improvement of data collection systems by expanding the capacities at national and European level.
4. The involvement by the Social Partners
The social partners have a crucial role to play in the making and implementation of labour market policy, both nationally and locally, and are called on to play an active role at European level in the implementation and assessment of the progress made under the Employment Guidelines.
At European level
The social partners are regularly invited to discuss employment and social matters with the Commission and other EU Institutions. The Standing Committee on Employment, which dates back to 1970, has served as a forum for discussion between the Council, the Commission and the two sides of industry. In March 1999, the Committee was reformed and streamlined in order to become an operational instrument for ensuring the consistency between the Employment Guidelines and the Broad Economic Policy Guidelines. The reformed Committee is composed of European social partners organisations2, the Council and the Commission.
This reform underlines the importance given to the role of social partners within the European Employment Strategy since the launch of the Luxembourg process. They are represented in other fora, such as the different Social Dialogue committees, and since the Cologne Summit, the new structures created for the macro-economic dialogue.
This institutional framework at the European level provides ample opportunities for the Commission to inform the Social Partners and involve them in the discussion of the Employment Strategy3. The present Report will certainly provide important inputs to such discussions.
2
3
UNICE,CEEP, UEAPME, COPA, EUROCOMMERCE, ETUC, EUROCADRES and CEC.
At national/eve/
The social partners have been better consulted and implicated in the process of establishing the NAPs than last year. The 1999 NAPs show that social partner action within a supportive framework is increasing and is proving to be an effective way forward both on life-long learning and on the modernisation of work organisation. This is the case when Member States take on commitments within their sphere of competence in order to support the process, leaving room and/or giving incentives for social partner action, e.g. in Netherlands and Luxembourg. This is also true to varying extent for Ireland, Finland, France and Belgium. Isolated calls on the social partners to take action are rarely effective.
In
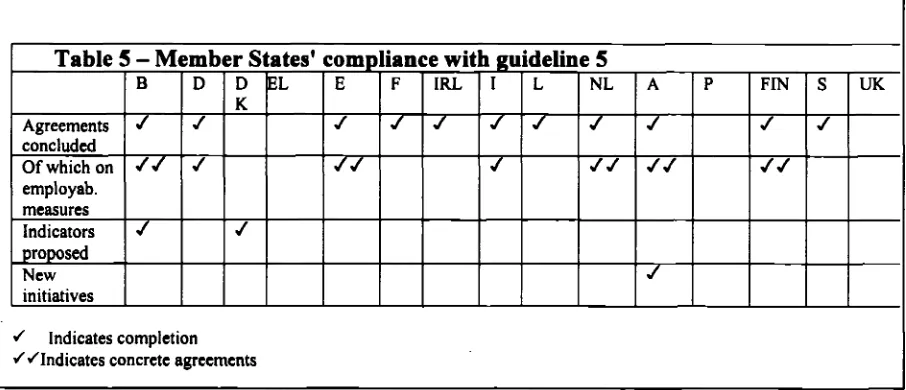
general, the social partners have participated in the preparation of the NAPs and implementation reports. In some Member States, specific bodies have been established for that purpose, e.g. in Denmark, France and Sweden. Furthermore, in Austria and Denmark the social partners have made their own joint contributions to the 1999 NAPs indicating clear commitments. However, in most cases, the social partners' participation remains rather procedural and there is much room for improvement in establishing effective partnerships in support of national strategies. The most comprehensive partnerships in the NAP process take the form of tripartite agreements between the social partners and governments or of bipartite social partner agreements covering a wide range of issues, such as wage moderation, the improvement of mechanisms for lifelong learning and work organisation. Most of these agreements were made during 1998 or before and are currently being consolidated and developed via concrete actions within the established framework.Regarding the tripartite approach,
in
Luxembourg the 1998 NAP was the result of an employment pact between government and social partners. This pact included obligations for the social partners to address employment in all agreements, focusing on flexibilisation and reduction of working time and the promotion of training. In Finland, the latest employment and income pact has been the result of a tripartite co-operation, where central components are moderate pay rises and a government promise to cut income tax for employees and payroll taxes for employers. In Italy, a comprehensive social pact between the social partners and the government was renewed in December 1998. In Ireland, the Partnership 2000 agreement between the social partners constitutes a framework for consideration of a wide range of issues.Specific Contributions under the Guidelines
In
some Member States, social partners have found common ground on issues under the employability pillar. The common positions by the Austrian social partners reflect their tradition of co-operation. The major part of it deals with improvement in education, vocational training and further training. The pact for older workers should also be mentioned. In the Netherlands, the social partners and the government have concluded an agreement in order to reinforce the apprentice system and in Germany the discussions in the context of the tripartite Job Alliance (Bundnis for Arbeit) have also been focused on the creation of more apprenticeship places. In Sweden, the social partners and the government concluded a tripartite agreement on upgrading of skills for employees.In most Member States the social partners are increasingly involved in the administration of employment offices and the operational bodies of various
programmes under the NAP, mostly within education and training. This is most evident in Denmark. In some Member States this co-operation has been widened to other fields, e.g. an entrepreneurship assessment agency in Sweden and the new employment centres in Finland.
On adaptability, a more significant contribution would be expected. In several Member States, the social partners have been closely involved in, or linked to, specific policies, either through consultation or through collective agreements. This has been the case for example in Belgium, Germany and France. Such policies however, almost exclusively concern working time issues.
Part-time work is another important issue addressed by the social partners. In Spain, the government and the trade unions concluded an agreement in 1998 with the view to strengthening the position of part-time workers. This issue has been discussed by the social partners in many Member States, including Netherlands and Germany.
5. Involvement of Actors at Local and Regional Levels
Overall, all NAPs stressed the need to devel9p the territorial dimension of employment policies. The involvement of local and regional actors concern all four pillars of the guidelines with, however and unsurprisingly, a stronger emphasis on guideline 12.
Generally speaking, almost all the Member States are in the process of decentralising, through local PES, the delivery of policies mainly decided and financed at national level. However, there is a strong tendency to build working partnership with different types of local actors.
As for federal Member States- Belgium, Germany, Austria- or Member States with strong regional institutional competencies - Italy, Spain - there is a sharing of competence under almost every guideline, and therefore, the regional authorities are involved in the preparatory phase of the NAPs as well as in their implementation.
In the Scandinavian countries, there are consolidated mechanisms such as the regional labour market council which promote a better taking into account of the regional and local specificities. In other Member States, such as UK, France and Portugal, the emphasis is on the development of partnerships with regional and local authorities, the voluntary sector and bodies representing small firms as well as on the building of new decentralisation tools, such as the Regional Development Agencies in England, the strategic local planning in Wales, or the social inclusion partnerships in Scotland. In this context Portugal also promotes in Alentejo, Madeira and Azores, the development of Regional Employment Plans which are considered to be the best way to respond to local needs.
The role of the municipalities is also enhanced by several NAPs (Netherlands, Sweden, Denmark, Finland, Belgium and Portugal for the metropolitan area of Oporto). In the Netherlands, where the municipalities are responsible for the reintegration for people who only receive social security benefit, the Municipalities receive funds for the development of comprehensive inclusion approaches which can be freely allocated. In Belgium, regional and federal Authorities co-operate with the local authorities for the development of Local Employment Agencies and "Maisons
Finally several Member States report on the importance of local partnership approaches, such as the ADM in Ireland, or the
Agences Locales pour I'Emploi
andMaisons de I'Emp/oi
in Belgium. There are also some insights on the development of new type of partnership based on the EU experience of Territorial Employment Pacts. TEPs are designed in Austria to better pool the forces of active labour market policy in a designated area. Others- Italy, Greece, Spain, Portugal- promote a more global territorial dimension involving the participation of a whole range of local actors.6. Equal opportunities bodies
Although specifically mentioned in the agreed format for the implementation reports, only three countries (Germany, France and Portugal) mention the involvement of equality bodies in the preparation of the NAP. Finland refers to "interested groups", the UK to "wide consultation, including bodies representing disadvantaged groups". In Luxembourg, the
"Comite du travail feminin"
will be involved in the follow-up of the implementation of the NAP.7. Budgetary commitments
Information on financial resources allocated to support the implementation of the 1998 NAPs varies greatly between Member States. In some cases, budgetary data are comprehensive but the information is not presented in a way that allows for any in-depth analysis. The request to present the data in a common systematic way has not been followed. In the absence such data, a cross-country analysis is not possible and a comparable assessment is therefore restricted to whatever data is available for the individual country. The information and data supplied by the Member States is ' reviewed in Part II of the present Report.
8. Implications of the new Treaty
The Treaty of Amsterdam entered into force on 1 May 1999 and this means that the Title on employment is fully applicable this year for the first time. Its entry into force has implications at various levels:
• Firstly, the Treaty provides for a wide consultation of European institutions and bodies. The Employment Guidelines, drawn up every year on a proposal by the Commission, are subject to consultation of the European Parliament, the Economic and Social Committee, the Committee· of the Regions and th~ Employment Committee, prior to their adoption by the Council.
• Secondly, Article 128 of the Treaty provides for the possibility that the Council, acting on a recommendation by the Commission, makes recommendations to Member States on the basis of the examination of the National Action Plans. • Thirdly, Article 130 of the Treaty foresees the establishment of an Employment
Committee with advisory status to promote co-ordination between Member States on employment and labour market policies. It will take over the work largely carried out so far by the Employment and Labour Market Committee and the latter Committee will be dissolved.
1.
THE EMPLOYMENT SITUATION
1.1.
The EU macro-economic and employment context
Growth
Taken as a whole, 1998 confinned the continuing recovery in the EU economy, the rate ofGDP growth going up from 2.7% in 1997 to 2.9% in 1998. However, from mid-year onwards, the recovery lost some momentum. This essentially reflects the direct and indirect impact of the sharp deterioration in the world economic situation on exports and investment in the Union. Given the underlying strength of the EU economy, some improvement of the external economic environment and confidence-building economic policies, economic activity is expected to improve again. GDP growth is now forecast to reach 2.1% in 1999 and to accelerate further to 2.7% in
2000.
Current economic conditions are favourable to growth and they provide the basis for higher growth and employment. It is essential that the currently favourable investment conditions, in terms of comparatively high profitability and low interest rates, are fully exploited. Investment in infrastructure, knowledge and skills should be enhanced to accelerate the transition to a high-technology, high-skilled and service-based economy. In particular, it is necessary to move quickly into new promising sectors, so that growth in the EU is accompanied by a satisfactory level of job creation.
As recommended in the Broad Economic Policy Guidelines, creating the conditions for high and sustainable growth and employment, which is primarily a matter for Member States, will require a comprehensive and coherent strategy that consists of three mutually-reinforcing key components:
• sound macroeconomic policies that are conducive to growth, employment and price stability, involving full respect of the Stability and Growth Pact and appropriate wage developments;
• policies to improve the overall functioning of labour markets and in particular to promote employability, entrepreneurship, adaptability and equal opportunities by means of a steadfast, prompt and transparent implementation of the Employment Guidelines, and
Employment
The number employed in the Union increased by 1.8 million in 1998, or by 1.2%, twice the rise in 1997 and the highest rate of growth since 1990. Moreover, also for the first time since 1990, employment went up in all Member States without exception, although in Germany the rise was marginal.
Despite the growth in employment, the number in work in 1998 was still over 600,000 below the peak reached in 1991. Four years of economic recovery and continuous expansion in employment, therefore, have not yet offset the three years of decline between 1991 and 1994.
As a result, the employment rate (the number employed relative to the population aged 15 to 64) in the EU in 1998 was 61 %, a rise of
Yz
percentage point on the 1997 level, but still 1Yz
percentage points below the level at the onset of the recession in 1991.In
terms of full-time equivalents, the employment rate rose by less thanYz
percentage point to 55% in 1998.The four years of net job creation since 1994 have, therefore, done little to raise the low rate of participation in the Union, which is a particular problem for inactive prime-age women, and older people.
In
1998, the employment rate of women was only around 51% of women of working age, and still20 percentage points below that for men. However, there is a rising trend for the Union as a whole (the female employment rate was only 49.5 % in 1994). For older people, the levels of participation in employment clearly decrease after 50 years of age (the employment rate for the age bracket 50-64 is now 47.6%, one percentage point higher than in 19954) and particularly after 55 years (36.5%).In the EU in 1998, 17% of those in employment worked part-time, 58 %of them voluntarily. In relation to 1994, both percentages increased, respectively by 1.4 and 2 percentage points. However, in 1998, for the first time during the present recovery, the number of full-time jobs in the Union increased by more than the number of part-time ones. In the Union as a whole, 54% of the net additional jobs were full-time. Most of these were taken by men. For women, almost 75% of the increased number of jobs in 1998 were part-time, leading to a further rise in the proportion of women working in such jobs, to 33% of the total employed, or 2.2 percentage points higher than in 1994.
The number of people working in jobs with fixed-tenn contracts increased significantly in 1998, continuing the trend towards temporary employment which has been evident since the onset of recession in the early 1990s. Over a third of the increase in employment in the Union was accounted for by temporary jobs - 36% in the case of men, 35% for women - which now account for almost 13% of all employment, up from less than 11% in 1991.
" Due to EU enlargement, there are no comparable data for periods before 1995.
Unemployment
The growth of employment in the EU was accompanied by a continuing fall in unemployment, from just over 1 OY:z% in 1997, and a peak of just over 11% in 1994, to an average of 9.9% of the workforce in 1998. Unemployment has continued to decline during the first six months of 1999, to reach 9.4% of the work force in June 1999 (equivalent to 16 million people).
The fall in unemployment in the EU in 1998 amounted to a reduction of some 1 million over the year. Given the increase in the number in work, this implies that around 40% (some 700 000) of the net addition to jobs was taken by new entrants to the labour force, or by those who previously were not actively looking for work and who had, therefore, not been recorded as being unemployed. This proportion is slightly lower than for the recovery period as a whole, largely reflecting an increase in rate of net job creation relative to the growth of population ofworking age. Of the 4.2 million net additional jobs created between 1994 and 1998, 60% (almost 2.6 million) went to those who had not been in the labour force before.
The fall in unemployment in the EU during 1998 and the first few months of 1999 has been much the same for women as for men. Since the peak rates reached during 1994, unemployment of men has fallen by some 2% of the work force, whereas for women, it has declined by 1 Y2% and the gap between the two rates at the EU level, is now just over 3 percentage points (11 Y2% for women, just under 8\l:z% for men).
Unemployment of young people under 25 has continued to fall in 1998, although the relative level of youth unemployment still varies markedly across the Member States. The gap between youth and adult unemployment, however, remains wide and in relative terms has narrowed only slightly over the present recovery. At the last count, the average share of youth unemployment5 in total population in the age bracket 15-24 was 9.3% in the EU, down from 9.9% in 1997. More than 4.3 million people young people were unemployed in 1998, of which 2.5 million (almost 60%) had been without a job for at least 6 months.
The fall in the overall rate of unemployment in the EU in recent years has been accompanied by a slow decline in the number of long-term unemployed. The rate of long-term unemployment in 1998, at 4.9% of the labour force, was not much lower than in 1994 (5.2%) and the number affected, almost 8.4 million, was only 4% less than four years earlier when unemployment was at its peak. The share of the unemployed who have been out of work for a year or more, at 49Y2%, was higher than in 1994 (47%) and slightly above the level in 1997, indicating that the long-term unemployed have the greatest difficulty in finding a job even in a situation of falling unemployment.
The number of very long-term unemployed in the EU, those who had been looking for a job for two years or more, was actually higher in 1998 than in 1994 ( 5.2 million as against 4.8 million, an increase of over 7%) and, in relation to the total unemployed, significantly higher (31 Y2% as opposed to 26Y2%).
5
1.2.
Comparative ovenriew of labour market performance
1.2.1 Emplo:YifNIII
In 1998, the European Union generated 1.8 million net jobs. Just three Member States (Spain, France and the UK) together
created
approximately 1 million of them (Chart 1 ). By adding three other Member States (Netherlands, Portugal and Italy), more than 75% of the total net job creation in the EU in 1998 is accounted for.UK
Relative to 1997, all Member States increased the numbers in employment in 1998, Particularly strong employment growth (above 2% ) could be observed in Ireland, Luxembourg, Spain, Netherlands, Portugal, Finland and Denmark. By contrast, just a very slight increase was registered in Gennany, Greece and Italy.
Since the onset of the present economic recovery in 1994, all Member States with the exception of Gennany have been able to take advantage of the overall improved economic conditions, and increase their employment levels (Chart 2). Six of them, however, have achieved particularly robust average growth of 2% or more, comparable to that of the US: Ireland, Luxembourg, Netherlands, Spain,
Denmark
and Finland. Ireland in particular was able to reach an average employment growth rate of 5%, thanks to average GDP growth exceeding 10%.It is quite significant that none of the four major economies in the EU - France, Germany, Italy and the UK- can be counted among the Member States with more dynamic employment performance over the 1990s. The low or negative rate of net job creation in these economies, which together account for 700AI of employment in the Union, is the major reason why employment in the EU as a whole has been so modest. In two - Italy and Germany - the number in work in 1998 has not yet recovered to the level reached in 1991.
C~1n2 · E•,IIYIIUitnwtii,CIII,IriiiU hiWitn lVII u• 14111 lturce: hnalltluc~••rt
There are, however, signs of improvement in the four major economies. This is particularly the case in France, where the number employed increased by just under 1 ~%in 1998, the highest growth rate since 1989. In Italy, the number rose by
Yz%,
having not increased at all in 1997, while in Germany, it went up, even if marginally, for the first time since unification. As to the UK, the improvement started much earlier, and an average employment growth of 1.2% has been achieved since 1994.The employment rate
Given the overall sluggish employment performance and the continuing
growth
of working-age population, the employment rate in 1998, at 61%, was 1Yz
percentage points below the level before the onset ofthe recession in 1991, and just 1% above the level at the end of the recession in 1994.Across the Union, the employment rate was highest in Denmark (79%), with those in the UK, Austria and Sweden also being over 70% (Chart 3). The growth in employment rates was highest in economies which had a lower starting point in 1994: Ireland, Finland, Spain, Portugal and Netherlands, in all of which the overall employment rate increased by 3 percentage points or more. Conversely, in Germany, Italy, Greece, Luxembourg, Austria and Sweden the employment rate did not improve, and it improved only marginally in France and Belgium.
In terms of full-time equivalent employment6, the highest rates in Europe are to be found in Denmark, Austria and Portugal, all of which have rates at or above 65%. France, Ireland, Greece and Germany have rates close to the EU average of 55.7%, whereas Italy and Spain (47.9%) have the lowest rates. Since 1994, the average FTE employment rate in Europe has remained practically the same, suggesting that the average time worked has decreased proportionally to the increase in the total number of jobs.
6
(2)
----,---~-:-::-:cc:--::-:---
-Chort3 · E10ploynuntro111, •••••rilan ol1884. 1187, 1888 8 ou rca: Euolla t. I •nc tunuks
100 , - - - ,
80
eo
40
20
1.1.2. Unemployment
Between 1997 and 1998, unemployment fell in the EU as a whole and also in the majority of Member States (Chart 4). Improvements were especially significant in the two countries with highest unemployment in 1997 - Spain (from 20.8% to 18.8%) and Finland (from 13.1% to 11.4%)- but also in a few countries with low or average unemployment, like Ireland, Netherlands, Portugal and Sweden. In all these countries the unemployment rate (ILO definition) declined by more than one percentage point.
Exceptions to this overall positive trend are to be found in Greece, Italy, Belgium, Luxembourg and Austria. In Greece, where the increase in 1998 was of nearly 1 percentage point, the unemployment rate was brought above the EU average, while Italy has now the second highest unemployment rate in the EU.
While for the Union as a whole the improvement in 1998 appears as a continuation of a trend dating back to the onset of the economic recovery in 1994-95, this is by no means the case with all Member States. Six Member States - Ireland, Netherlands, UK, Denmark, Portugal and Finland - have succeeded in bringing their unemployment rate down from the level reached in the mid nineties. In these countries improvements in the labour markets are of a long-standing nature which suggests the effects of structural reforms, in addition to the positive impact of economic recovery.
Cher14· Unetaployoun1rlll
I ou rc 1: Eu ro1t1 l, Ht nnaniltd unemployment r1 111
6
-20 16 10
I
0.jJ.&l,J.&I.,J.II..I.,.J.&.I.,~J.,.I.&I.,J.&&,~
I "'
~ ""q.<t ('
tb- (j-+
~ .:~· <t· 4' ~ "" ~ / ~ ~L____
lc1814 •1817 c1a!i] Youth unemploymentAs measured by the ratio of youth unemployment to youth population 7 the improvement in 1998 was widely spread, with an average fall from 9.9% to 9.3% in the EU as a whole, and moderate to strong declines in the majority of Member States (Chart 5). Reductions of one percentage point or more were witnessed in France, Netherlands, Ireland, Portugal, Spain and Sweden, whereas in Austria, youth unemployment stabilised at the 1997 level and Greece was again the exception with a sharp increase similar to the rise in overall unemployment.
The reduction of youth unemployment in 1998 continues the declining trend that has been observed since 1994 for the large majority of Member States. The exceptions are Austria and Germany, where relatively low levels of youth unemployment have been maintained throughout the period, and Italy and Greece, where no improvement has been registered in their already high initial levels of youth unemployment.
7
Chart &: Youth unemployrMnt ratio Source: Eu~ LFS
Long-term unemployment
In 1998, only a few Member States managed to reduce significantly long-term unemployment, as measured by the long-term unemployment rate8• In Portugal, Ireland 9 and Spain the L TU rate declined by more than one percentage point, and in Finland, the UK and Netherlands the reduction was still above half percentage point. Spain however still presents the highest level of long-term unemployment in the EU (Chart 6).
Worrying signs are shown by Greece but also by Belgium where the LTU rate increased in 1998, whilst in several Member States having high to average levels of long-term unemployment, like Italy, France, and Germany, no improvement could be observed in 1998.
When appraised over a longer period, long-term unemployment appears as a persistent problem. In six Member States, long-term unemployment is now even at higher levels than in 1994. In contrast, the UK, Denmark, Netherlands, Portugal, Ireland Finland and Spain have managed to decrease long-term unemployment steadily, and bring it below its 1994 level.
9
---~
Chon I. Laog·llno uno•play10ontroto Souru: Eurapun Lfl, kollnd lUI: notionolutirrull
Defmed as the stock of long-tenn unemployed persons divided by the labour force.
Due to the unavailability of Eurostat Labour Force Survey data for Ireland in 1998, a national estimate was used for the rate of long-tenn unemployment.
2.
PILLAR 1: EMPLOYABILITY
Ma iBber States ale
·called
011to
untlertakeconcrete
action to attain the following objeeti.ts• Implementing
_a prwantive approach so as to reduce significantly the inflow ofyoq
and adult UJlelllployedpersons into
long-term unemployment (guidelines 18Dd2);
• Strengthening active labour market policies and reviewing tax and benefit systems so as
to
reduce the number of people dependent on benefits (guidelines 3 and 4); • Developing. p8ltnersbi.p as a framework for the provision of training and theexpansMm
of
poaaibilitiea fer
lifelong learning (guidelines S and 6);• Facilitating the
traDsiticm
from achool to work, by reducing early school leaving andequipping
youagpeople
with
marketableskills
(guidelines 7 and 8);• Promoting a
labour
matket
open to all, by givingspecial
attention to the needs of the disablod, ethnicmiJlorities
and other disadvan ed · deline 9).2.1. A comparative overview of the situation in Member States
2.1.1. Labour IIUirket policiei0
For the EU as a whole, 3% of GOP was spent in 1998 on labour market policies, of which 38% on active policies (mainly training, youth programmes, rehabilitation programmes, subsidised employment schemes addressed to the unemployed and the administration of public employment services). The remainder was spent on income support ·benefits for the unemployed and early retired workers.
As shown in Chart 7 this pattern has been remarkably stable over time. However, in recent years, and partly in response to widespread policy advice by the European Commission and international organisations like the OECD, EU governments have tended gradually to put proportionally more resources in the financing of active policies. Since 1992, when labour market policy spending per unemployed person reached its peak, the Union as a whole has spent less on income support policies, while maintaining average spending with active policies broadly constant.
Across Member States the situation is quite mixed, both in terms of the financial importance oflabour market policy and in terms of tendency.
10
c~ ... 7: EU lohuroouhtupondilun II •11 •IIIII' 4ivilltd . , llt.luneooployrOinlrollr, 1111·1111
Snrce: 0 ECD, EUR ltlrtllllr&colulollrd . , DB 5 0,10 r
-D.50
0,40
0,30
_....---
•
•
0,20
-
•
•
•
•
•
•
• •
•
• • • •
0.10
•
•
0,00
II 18 10 II 82 u 84 I& u 87
---~~
~hill -:---Acdn - P u s l n
•
•
u
Six Member States spend 4% ofGDP or over on the labour market- Denmark (5.6%), Netherlands, Ireland, Finland, Belgium and Sweden - of which only the last achieves a balanced distribution between active and passive policies. All the other five countries spend more than 2/3 in passive income support (see chart 8).
Six other Member States spend less than 2% of GOP on labour market policies - Italy, Portugal, Austria, UK, Luxembourg and Greece - of which only the first two spend more or less the same on active and passive policies. Gennany, France and Spain are close to the EU average.
Chart&· Comparisan olacliuand pauinlabourmarkuupandiane 111 I oiGDP
1888
--r
Source: DE CD
8.---~
8
5 5 4 4 3
3
2
2
1
D
6··~·~··&~~~~~~~·~#9~
~
~CPauinl
!
However, the share of expenditure in GDP gives a distorted view of the real importance of active policies in the different Member States, since the number of unemployed people to which such policies are addressed varies substantially .
One way of standardising active spending is to express it as a ratio to the unemployment rate (see chart 9). The Member States that spend proportionally more
with active policies
in
favour of the unemployed are Netherlands2, Denmark, Sweden, Ireland and Portugal (all above or close to 0.2% of GDP per percentage point of unemployment). The Member States who spend less are Spain, Greece and the UK (all below or close to 0.05%).While (standardised) expenditure on active policies in the EU as a whole has remained relatively stable since 1992/93, the evolution by Member States has been quite diverse. Sweden and Germany have n:::duced markedly their average expenditure on active policies, whereas Netherlands 11, Denmark and Ireland have increased theirs .
. The other Member States have shown smaller variations, with France, Austria and Spain showing an increasing trend, and Portugal, Belgium, Finland, Italy and Greece a decreasing one 12• .
1
----, --- ---
Chlr19·Ritioolectinlabourmarket u n em p loym en t ra• • 1998,1994 upendillua,% shue ofODP toI
0,50 -·---·---·- Source: DECO, Dati for US end JP 921118
i
0,45I
D,4o1 0,35
1 o.3o
I
! 0,25 0,20
I o. li 0,11 0,05
... ~ <f· <f; ~
t/'
~&
~- ~s'+-«' ;:.
~..;:·
~.} ~~.s~ i! ~11!11994 .19981
Expenditure on active policies in relation to unemployment may be seen as an indicator of the policy effort undertaken by national authorities in upgrading the skills of the unemployed and providing them with job opportunities. However, other factors, e.g., the quality of training, the relevance of training to labour market needs and the motivation of participants in training may all also have a strong impact on people's employability.
More broadly, active policies are not alone in bringing about low unemployment. This is also the outcome of other important institutional and economic factors, such as the tax-benefit system, and the way it is articulated with the provision of active policies, the strength of labour demand or the flexibility of the labour market.
2 A substantial part of active policies
in Netherlands is directed to disabled ~ople, and their classification as active can be questioned to some extent.
12
!
J
Chrt 10. A< lin ohunftlrllollrpondl.,,. ond unuoployoun 111111, 1188
lou reo: 0 ECD ond Eurollot Honoaniud unuoployoun 111111
20r---~
18
12 . . .
Ul
Ul •
4 • • •
• lT Jf
lUI
...
•
"
IT
••
...
JUl. DJ.ll
.R ...
41'
..
,
0~----~---~
0,0 0,6 1,0 2,0
Acdvo upondilll11111loiGOP
Chart 10 presents standardised active policy expenditure and the unemployment rate plotted together. For the majority of Member States, spending in active policies is negatively correlated with unemployment. However, the same chart also suggests that the US and Japan and, in the EU, Austria, Luxembourg, UK, and to a lesser extent Portugal, have managed to reach low unemployment rates, with relatively low average spending in active policies per unemployed person.
While confirming the overall positive influence of active policies promoting employability in bringing down unemployment levels, these results also draw attention to the decisive role played by other policies, in support of the integrated approach contained in the Employment Guidelines.
2.1.2. Educational attainment levels and participation in lifelong learning
High levels of educational attainment are a key enabling factor for achieving performing and adaptable labour markets. They are also a facilitating factor for further learning in adulthood and an advantage, when it comes to upgrading skills and knowledge. Overall, EU Member States have invested heavily in initial education and as a result have a comparatively highly educated and productive workforce. Over several decades, a lengthening of school education has been observed, and on average, the time length of formal schooling varies between 14 and 16 years, whereas full-time compulsory education varies between 8 and 11 years.
Young people in all Member States reach today higher levels of education than did previous generations, as shown by the widening gap between levels of education among generations (see chart 11). In 1997, according to the Labour Force Survey, 46% of people aged 24-34 had completed upper secondary education compared with 32% in the 45-64 age group.
c - - - ---~
10
70
10
10
40
:10
:zo
10
0
AT OE
Chart 11 • Attainment of upper secondary education level by age groups, 1997
- E - L f S . - b y O G 5
Fl OK SE FR N1. EUR15 GR IT BE IE UK LU ES PT
'
-Although a catching-up effect has been observed in southern Member States, where growth rates in educational attainment have been higher than in northern ones, significant disparities remain. Four countries (Spain, Greece, Italy and Portugal) still have 60% or more of their population at a low level of educational attainment 13, whereas in Austria, Denmark, Germany and Sweden only 25% of the population or less are at that level. By contrast, a comparison across the European Union between male and female rates of educational attainment shows that in almost all countries young women are now coming close to, or even exceed, the educational levels attained by men.
Lifelong learning after initial formal education and training is crucial for maintaining a highly skilled and adaptable workforce in the EU. However, participation rates in further training and education are generally low and do not provide a uniform pattern. In 1997, onr 7.5% ofthe employees in the EU received training during the previous four weeks 1 • Participation rates vary from country to country from a few percentage points in roughly half the Member States to over 15 % in Denmark, Finland and Sweden. Countries which have well-developed systems of initial education and training, like Germany, Ireland, Italy and Austria, have participation rates below 10%.
Participation rates of different age groups in the labour force are also very divergent. Older workers appear to participate less in training activities, with most training. going to younger age groups, especially those around the early thirties. Whereas only 2.5% of workers between
55-59
participate in training or education, for those aged between 25-29 and 30-34 the rates are 10% and 8% respectively.Participation in lifelong learning activities also reflects strongly the initial levels of educational attainment. Those with higher qualification are four times more likely to participate in training than those with a low level of qualification. Overall, the above data point to the possibility of rising skill gaps, in the form of increasing demand arising from a rapidly developing information society for a better skilled and trained workforce.
13 Low level of education is assimilated here to basic secondary level or less (ISCED 0-2). 14
le11r••: l•toUet L;l
-" 1 - -
-II.
l l
..
.
"" "" • IU 0'"' I I I
' •• P ' ML
I • • • • 11·11 I
--With an ageing population, the need to retrain and upskill to improve employability becomes crucial if the EU is to avoid skill shortages. According to the Commission report on job opportunities in the Information Society, skill shortages are already emerging and up to 500,000 jobs are currently vacant for lack of an appropriate supply of skilled labour.
2.1.3. Early school leaving
Despite the steady improvement of education systems, which has been responsible for the extension of initial education, a number of young people leave the education system too early, either on the completion of basic education or by dropping prematurely out of their studies. In either case, these young people enter active life with very inadequate skills and will remain throughout their entire working lives particularly vulnerable to unemployment or social exclusion. By adopting as a proxy1s for school drop-outs the number of young people having left education with a low level of attainment, the average drop-out rate in the EU is 18% in 1997 (see chart 13). The problem of dropping out of school early is more serious in Italy, Luxembourg, Spain and Portugal, where 30% or more of the young cohorts leave school with only the most basic skills. Early school leaving among males tends to be more frequent with young men, except in Austria and Germany.
2.2. Assessment of National Adion Plans
2.2.1. Overview of policy developments
Progress in implementation is evident in respect of guidelines 1 to 3, where the establishment of clear targets and deadlines has helped to focus policy and to mobilise efforts. In several Member States, there is evidepce that preventive policies have been put in place systematically or expanded since the beginning of 1998 in response to the commitments made at the Luxembourg Summit. Such is the case of Denmark, Ireland, France, Spain, Portugal, Finland and Austria. Other Member States are still in the
15 Available statistics do not provide comparable international figures on "early school leaven
defmed u people who leave school before attaining a certain level of education, however this is defined.
preparatory stages of such implementation, while others such as the UK and Sweden , had already policies in place complying broadly with the new requirements. Despite different points of departure, and a few cases of delayed or questionable implementation, there is now a clear move towards a more preventive approach in order to combat youth and long-term unemployment more effectively.
Chart 13 - Share of population 18-24 years old having achieved ISCED low levels and not attending education and training 1997 ..._...,_LJI&..._._IICM
I_
I ~~---~ .5
•o
35
30
25
20
LU IT IS GR IE !UR15 NL ,R II
!•Males •Females CTotall
In a few cases, the implementation of new measures can be associated with positive outcomes in terms of lower inflows into long-term unemployment. However, a longer time span is necessary to assess the impact on the employment situation.
In contrast with this encouraging outcome, the implementation of policies in response to the guidelines where no quantified target has been set continues to offer reasons for disappointment. Most NAPs lack well defined objectives and time schedules, and innovative policies and initiatives are the exception rather than the rule. The positive examples to be highlighted are :
• the UK, Ireland, Netherlands, Austria and Finland for the reforms of tax-benefit systems,
• Belgium, Finland, Spain, Austria and Netherlands for partnership agreements on training;
• Ireland, UK and Portugal for policies to combat early-school leaving;
• Germany, Austria, Portugal for their efforts on apprenticeship.
education and training tended to be among the first in suggesting an articulate policy. Therefore, the guideline is not promoting major policy change, as expected. The only Member State which has fully complied with the guideline is the UK.
The lack of comparable data describing the scale or nature of the needs of disabled people and ethnic minorities is a serious handicap for assessing policies addressed to these groups. The most articulate policy responses in the NAPs to the new guideline 9 are to be found in Sweden, UK, Denmark, Netherlands and Germany.
2.2.2 Tackling youth Ullemployment 11nd pnventing longterm unemployment -guidelines 1 1111d 2
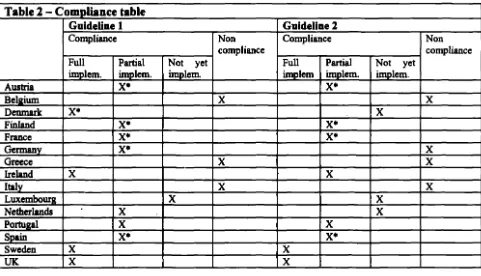
The assessment of implementation of guidelines 1 and 2 has been undertaken with the help of qualitative information and policy descriptions, as well as quantitative indicators wherever these are available, on the basis of the two following criteria:
• Have new policies and programmes incorporating the preventive approach been fully, partially or not yet implemented (i.e. made operational)?
• Do such policies and programmes fulfil the objectives set out in the Employment Guidelines so that the common targets can realistically be achieved in the given deadline?
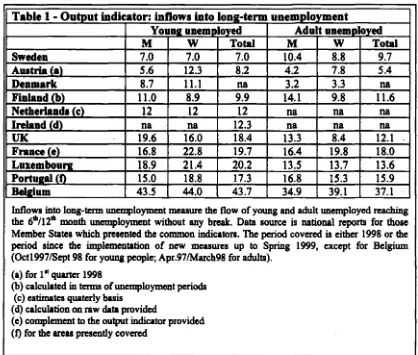
In addition, the information provided by Member States on the rate of inflow into long-tenn unemployment (as presented in Table 1) has been used in order to establish a relationship with the outcome. This aspect is further explored in Part II of the Report.
Progress
in
opmltional implementationNot all Member States are at the same stage of implementation. For most, 1999 is the year of take-off or of implementation of the new programmes initiated last year. Some ·Member States however seem to have taken a more gradual approach. Due to the specific institutional arrangements adopted for the whole proeess of implementation in Belgium and Luxembourg, despite some first steps already taken in 1998, the preventive approach is just being launched. In Greece and Italy, the effective implementation of the preventive approach necessitates the reform of their respective employment services. Other Member States are now in the process of extending the coverage of the new preventive policies in accordance with pre-defined plans: Spain, Finland, Austria, France and Portugal.
All these Member States have launched the preventive approach simultaneously for the young and the adult unemployed. Others have opted for a two-stage process, where priority was given to the programmes addressed to the young unemployed. That is the case of the UK (with a very short time lag) and Ireland (where the preventive programme for adult unemployed in the age bracket 25-35 started only in May 1999). In a few other countries, the new preventive programmes addressed to adult unemployed have not yet started- Netherlands, Belgium and Germany- or are being implemented at a slower pace than intended - Denmark-.
Table 1 -Output indicator: inflows into long-term unem_p_l~ment
Youn1 unemployed Adult unem_fJ~ed
M
w
Total Mw
TotalSweden 7.0 7.0 7.0 10.4 8.8 9.7
Autria (a) 5.6 12.3 8.2 4.2 7.8 5.4
Denmark 8.7 11.1 na 3.2 3.3 na
Finland _{b) 11.0 8.9 9.9 14.1 9.8 11.6
Netherlands (c) 12 12 12 na na na
Ireland (d) na na 12.3 na na na
UK 19.6 16.0 18.4 13.3 8.4 12.1
FranceOO_ 16.8 22.8 19.7 16.4 19.8 18.0
Luemboui'R 18.9 21.4 20.2 13.5 13.7 13.6
Portusral CO 15.0 18.8 17.3 16.8 15.3 15.9
Belsrium 43.5 44.0 43.7 34.9 39.1 37.1
Inflows into long-term unemployment measure the flow of young and adult unemployed reaching the 6111/12111 month unemployment without any break. Data source is national reports for those Member States which presented the common indicators. The period covered is either 1998 or the period since the implementation of new measures up to Spring 1999, except for Belgium (Oct1997/Sept 98 for young people; Apr.97/March98 for adults).
(a) for 1111 quarter 1998
(b) calculated in tenns of unemployment periods (c) estimates quaterly basis
(d) calculation on raw data provided
(e) complement to the output indicator provided
(f) for the areas presently covered
Assessment of complillnce with the common targets
There is now a clear move towards a more preventive approach in combating youth and adult long-tenn unemployment, but some Member States are more advanced than others in setting up the necessary framework for complying with the EU-wide commitments: to offer to all young and adult unemployed a new start before 6 or 12 months of unemployment, respectively. Four groups of Member States can be distinguished in this regard. Sweden, the UK, Denmark and Ireland have complied or are about to comply with the targets. Other Member States - France, Spain, Portugal, Finland and Austria - have set in motion a reform process which is expected to bring about results in line with the guidelines and before the agreed guideline of 2002. More concrete progress is expected from Gennany, Netherlands and Luxembourg. Finally, concerns can be raised in respect of the delays in implementation in the cases of Belgium, Greece and Italy.
On the basis of the information provided in the National Action Plan reports, Sweden and the UK seem to fulfil the EU-wide target, despite very different policy mixes: