RIT Scholar Works
Theses
Thesis/Dissertation Collections
1999
An evaluation of the current state of digital
photography
Charles Dickinson
Follow this and additional works at:
http://scholarworks.rit.edu/theses
This Senior Project is brought to you for free and open access by the Thesis/Dissertation Collections at RIT Scholar Works. It has been accepted for inclusion in Theses by an authorized administrator of RIT Scholar Works. For more information, please [email protected].
Recommended Citation
SIMG-503
Senior Research
An Evaluation of the Current State of Digital
Photography
Final Report
Charles Dickinson Center for Imaging Science Rochester Institute of Technology
May 1999
An Evaluation of the Current State of Digital
Photography
Charles Dickinson
Table of Contents
Abstract Copyright Introduction Background Theory Methods
Camera Characterization Printer Characterization Subjective Evaluation Results
Camera Results Printer Results
Subjective Evaluation Results System Results
Discussion Conclusions References Appendix A Appendix B Appendix C
An Evaluation of the Current State of Digital Photography
Charles Dickinson
Abstract
The field of digital photography is always changing. Due to the rapid pace of new technologies being developed for this area, it is becoming more commonly used by people in all walks of life, particularly that of the consumer. It is therefore important to criticaly evaluate the current state of this technology to gain a better understanding of how advanced it has become.
This research has evaluated the digital photographic systems from digital camera input to printer output. The metrics used to judge the performance of the camera and printer performance were the modulation transfer functions, or MTFs, of the devices, and subjective evaluations of their prints. Previous research of this kind has been done on specific devices, but this project is unique in that it looks at digital photography as a system, and incorporates not only the traditional MTF, but also the ratings of observers.
From the results gained by doing this research, several conclusions have been made. The first is that a generic model of digital photography has been gained. What is meant by generic is that the cameras and printers span a wide range of quality and expense, so it is possible to substitute devices of similar qualities and obtain information from the results. The second conclusion to be made is that for low end cameras, an upgraded printer makes little difference in the output of the system. Finally, the effects of interline vs. frame transfer CCDs have not been determined by this research due to the unexpected differences in the two cameras used for this question.
Copyright © 1999 Center for Imaging Science
Rochester Institute of Technology
Rochester, NY 14623-5604
This work is copyrighted and may not be reproduced in whole or part without permission of the Center for Imaging Science at the Rochester Institute of Technology.
This report is accepted in partial fulfillment of the requirements of the course SIMG-503 Senior Research. Title: An Evaluation of the Current State of Digital Photography
Author: Charles Dickinson Project Advisor: Dr. Jeff Pelz SIMG 503 Instructor: Joseph P. Hornak
An Evaluation of the Current State of Digital Photography
Charles Dickinson
Introduction
The field of digital photography is one which is in a constant state of flux. Recent technological advances have promoted the use of digital photography in all walks of life, particularly that of the consumer. As such, it becomes increasingly important to periodically evaluate how well this field is performing.
This research seeks to evaluate digital photography, from digital camera input to printer output. To accomplish this, the modulation transfer functions, or MTFs, of several different cameras and printers will be modeled. These MTFs were cascaded for each camera / printer combination to generate a system MTF. By doing this, one will be able to see the differences in the various combinations. To verify this data, subjective evaluations were performed.
There are several questions that should be answered by doing this research. First, by generating an imaging model of the system, the question of 'will an upgrade of my camera/printer be a significant improvement?' will be answered. It is suspected, for example, that for a low-end camera, the transition from an inkjet to a dye-sub printer will not
increase image quality significantly. Another question which will be answered by this research will be 'what are the effects of interline vs. frame transfer CCDs on image quality?' This is a viable question for this project because two of the cameras being studied are essentially equivalent, except that one is interline and one is frame transfer. Finally, it is hoped that although this study is limited to a finite number of cameras and printers, it will provide an adequate evaluation of digital photography. The reasoning for this is that both the cameras and the printers span a wide range of qualities and expense, so the results of the experiments to be completed will be applicable to cameras and printers of similar qualities.
Background
The charged coupled device, or CCD, was invented in 1970 by Boyle and Smith (1). By using an optical system with the CCDís photosensitive elements, it is possible to turn incoming photons from a scene into voltages which may be stored digitally as discrete grey (or color) values. These components are the basis of the digital camera. Recent advances in CCD technology have created markets in television, machine vision, science, the military, and for amateur photographers. Obviously, the CCD chip is the heart of the digital camera, and it has 3 main functions: charge collection, charge transfer, and conversion of charge to voltage (1). Several factors affect the performance of the chip such as dark current (the current measured in the chip even when no photons are incident to its surface), the chip's dynamic range, and various kinds of noise like shot noise and amplifier noise. The CCD is made up of metal oxide (MOS) capacitors which are referred to as gates. By manipulating the voltages of the gates, the charge held in the capacitor is either stored or transferred (1). The camera system, whose characteristics will be examined by this study, are composed of the lens, the array architecture, array noise, and the characteristics of the display. All of these factors effect the outcome of the image. The signal of the image is affected by the spatial response of the optics and the detector, while the noise comes from the detector and the electronics in the camera.
called frame transfer. This kind of chip has two arrays, one for image pixels to capture the scene, and one for storage before readout. The storage cells are actually the same as the image pixels, but they are covered from the light (1). Using this kind of architecture, half of the chip is used for storage, but there is a longer period of time necessary to transfer the charge packets from the image sensors. This type of array is used for high-end digital cameras such as the DCS315 and the DCS460, and it is also used for many scientific and military applications where resolution is the highest concern.
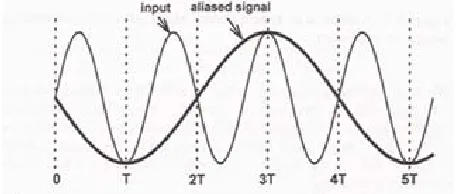
The CCD is a two-dimensional array of discrete detector elements. Because of this, sampling is an innate feature of the camera. What is meant by sampling is that the continuous image reflectance can only be represented as discrete ëpixelsí or picture elements, which arise from the discrete locations of the detector elements (1). The sampling effect is of interest because it is most noticeable when imaging edges, where it causes aliasing, and periodic targets, where it causes Moiré patterns, both of which will be used to characterize the camera (1). This sampling creates limits on what images can be reproduced faithfully. Specifically, the Nyquist frequency, or fN , is the maximum spatial frequency that can be imaged without causing artifacts. The Nyquist frequency of the camera is defined to be equal to one half of the sampling rate. If a higher frequency is introduced into the imaged scene, it will be ëaliasedí, or made to look like a lower frequency. This is illustrated in Figure 1 (1).
[image:7.612.192.420.280.377.2]
Figure 1: Aliasing diagram (1)
Clearly, for a CCD array, the Nyquist frequency will be equal to one half the reciprocal of the number of elements per mm. To counter the aliasing, many digital cameras have an anti-aliasing filter to drop the high frequency components of the image. The ideal filter would simply multiply all frequencies within the Nyquist region by one, leaving them unchanged, and multiply all frequencies above the Nyquist frequency by zero, thereby eliminating them. This kind of filter is impossible to implement, but it may be approximated. In addition, some optical band-limiting can occur before signals hit the CCD such as small diameter optics, defocusing, image blur, or a birefringent crystal between the lens and the array (1).
The next region of interest for this study is the digital non-impact printer. In this project, ink-jet and dye
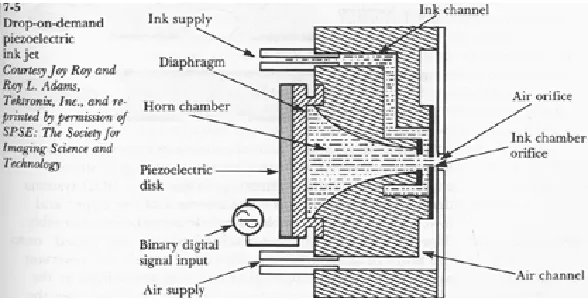
sublimation printers are used. First, the ink-jet will be briefly described. The ink-jet used in this study is the Epson Photo Color Stylus 800, and it falls under the sub-category of drop on demand, piezo-electric ink jet. An example diagram of a piezo-electric drop-on-demand printer is shown in Figure 2 (2).
Figure 2: Piezoelectric ink jet diagram (2)
These printers are called drop-on-demand because they are a departure from the older continuous inkjets, whose ink stream was continuous, and when ink wasn't required, the stream was deflected. Piezo-electric ink jets get their name from the piezo crystal in their cartridges. These printers send a voltage to the cartridge when ink is required, and the voltage causes the crystal to flex, which forces ink out of the nozzle (2). The air chamber serves to improve droplet rate and control (2). These printers move the substrate (typically paper) with a drum mechanism in the slow scan direction, and the cartridge moves back and forth linearly in the fast scan direction, thereby covering the image. The other type of printer is the dye sublimation printer. As the name implies, this printer uses the chemical process known as sublimation to get its colorant to a recieving sheet. The ink is initially a solid which sublimates to a gas and then sublimates again into a solid on the paper. This process formerly caused problems with handling the print due to the sensitivity of the dye, but recent advances in paper and a coating process done by the printer have alleviated this problem.
Theory
This section will discuss the theory of image systems analysis, which is the main thrust of this study. When a scene, typically composed of reflectances in the visible portion of the EM spectrum for the camera and digital counts for the printer, is imaged, it is affected by the system that imaged it. This system is made up of all of the components that the device uses to capture the scene. In the case of the camera, these components include the optics and the CCD, while the printer has electronics and print heads. In general, these systems blur the image by some amount. The amount to which they are blurred is called the point spread function, or PSF. This PSF is found by inputting a delta function, which is a peak of (ideally) infinite magnitude at position zero, and zero elsewhere. Because the system cannot reproduce this function perfectly, the image will be a blurred version of the delta function. This blurred function is the PSF of the system. The PSF therefore represents how the system reproduces a delta function. This relationship can be described mathematically by what is called a convolution. The PSF is convolved with the delta to yield the PSF (this is a property of delta functions). This PSF can then represent what any function (image) is convolved with to yield an output. The two-dimensional convolution equation is listed below:
The MTF is the ratio of output modulation to input modulation, normalized to 1 at 0 spatial frequency. The ideal MTF of most systems is a sinc function, where sinc(Wf)=sin(pi Wf)/pi Wf, W is the pixel width, f is the spatial frequency (3). In this ideal case, the highest reproducible frequency is the one right before the function crosses 0 for the first time. However, as previously stated, the CCD is a sampled system, so this ideal is incorrect. What in fact happens is that frequencies higher than the Nyquist ëfold overí and are reproduced as lower frequencies, i.e.. aliasing. The obvious solution to this problem is to limit the band-width of the imager to the Nyquist frequency or lower (3). In order for all of this MTF theory to be applied to a system, 4 conditions should be met: the radiation is incoherent, the signal processing is linear, the image is spatially invariant, and the system mapping is single valued, i.e.. non-noisy and non-digitized (1). In fact, the last 3 of these are violated under the CCDís conditions, but clearly no real system is perfect or linear, and these assumptions provide a wealth of mathematical tools which are very useful in characterizing imaging systems (1). The most important result of these assumptions is that different MTFs in a system can be ëcascadedí, or multiplied, to get a system MTF which incorporates all of the components. This is of particular value to this study as an overall characterization is desired.
Methods:
This section will be split up into three parts: camera characterization, printer characterization, and subjective evaluation. This section will also go into detail about the two pieces of software which were used in this study to generate the camera and printer MTFs. While several programs were used to accomplish this including Adobe Photoshop 4.0 (4), Microsoft Excel 98 (5), and IDL 5.0 (9), the two which require discussion are PIMA Image Analyzer (6) and Imlab.
Camera Characterization:
The digital cameras which have been characterized for this project are the Kodak DC120, DC260, DCS315, and the DCS460. The prices of these cameras range from $400 to $28,000. Their resolution in pixels is as follows:
DC120: 1280 x 960 DC260: 1536 x 1024 DCS315: 1524 x 1012 DCS460: 2036 x 3060
The cameras were modeled by empirically determining their MTF curves.
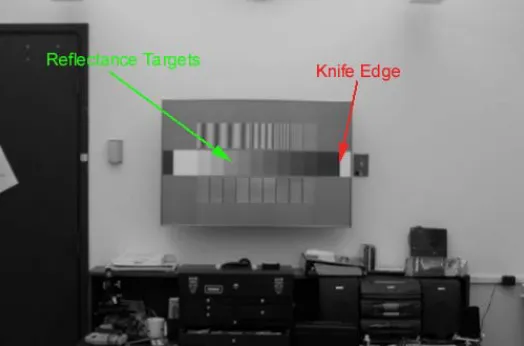
The first step in obtaining the camera MTFs was generating a reflectance vs digital count curve. This curve is used to convert the digital counts seen on the computer to reflectances. This procedure begins by taking an image of the target shown in figure 3.
Figure 3: Camera target (reflectance patches and knife edge)
The camera files were imported into Photoshop using Kodak's TWAIN driver. The imported files were then transformed to L*a*b* space, and the a* and b* channels were discarded. This is because the eye is most sensitive to sharpness in a brightness channel. These were then written to a CD as TIFF files. Unfortunately, before the TIFF files could be read into IDL, they had to be resaved with a program called GraphicConverter (7) because of an incompatibility between IDL and Photoshop TIFF files. Next, an IDL program was used which goes through the following procedure:
Read in TIFF file.
Define rectangle within each reflectance patch.
Take the average digital count, or DC within each rectangle, and run a function which returns the standard deviation.
Write the average DC's to a text file, and print the standard deviations to the screen for review.
A program of this nature had to be customized for each camera. A sample of one of the programs is listed in
Appendix A. The rectangles were defined by examining where the pixel locations for each patch were, then using the pixel locations in the code.
The average DC values were saved as a text file and read into Microsoft Excel, and plotted versus the known reflectances of the target patches. A trendline was fitted to the data, and was typically of the power or exponential variety. If plotted versus density, the trendline was linear. The equations along with the graphs may be seen in
Appendix B. Finally, the numbers 0 through 255 were plugged into the DC - reflectance equation to get the reflectances associated with all eight bits of grey levels. These reflectances are what the Image Analyzer software refers to as an Opto-Electric Conversion Function or OECF.
Image Analyzer is a Photoshop plug-in which was used to get the MTF data for the digital cameras. This software was chosen because of its ease of use and its accuracy. Image Analyzer works on a technique called slanted edge MTF, which is especially designed to do MTF calculations with spatially sampled capture devices (8). By using a slanted edge, or an angled knife edge, the plug-in can create a one dimensional super-sampled edge profile from traces of the two-dimensional edge (8). This actually permits the plug-in to generate MTF values past the Nyquist frequency. Also, the plug-in is largely insensitive to the angle of the knife edge, which allows for easy image capture of the edge (8).
The procedure that the plug-in uses is basically as follows (8): The edge to be studied is selected by the user in Photoshop.
Each scan-line of the edge is differentiated using the discrete derivative kernel (-1,0,1). The centroid of these first derivatives is determined.
A best line is fit through the centroids which represents the position of the edge.
A one-dimensional line-spread function is found by using the derivatives of the two dimensional data. The data points on each scan line are placed into one of four bins according to the distance from the edge for each line.
A Hamming window is applied to reduce leaking, an effect of quantization when taking a Fourier transform. The line spread function is Fourier transformed to generate the MTF of the camera.
Image Analyzer has been found to be extremely accurate and functional for angles from 1 to 60 degrees by Kodak (8).
The knife edge images were taken at approximately 5° from the vertical. The images were opened in Adobe
Photoshop 4.0, and a the marquee tool was used to select a rectangle containing the knife edge. Image Analyzer was then selected from the 'filter' menu, and it requested the text file containing the OECF for the camera. After being selected, the plug-in runs, and it writes an Excel text file to the hard drive containing the relative frequency in terms of the camera resolution, the modulations corresponding to the frequencies, and the OECF used. These MTF frequencies were converted to cycles per inch with the following conversion factor: pixel width of image/7". The seven inches was chosen because the subjective prints were 5" x 7".
Printer Characterization:
The two printers used in this study were the Epson Stylus 800 inkjet and the Kodak 8670 dye-sub. The Epson has a stated addressability of 1440 x 720. Using a microscope, the 'true' dpi of the Epson appears to be roughly 400. The Kodak, however, has a resolution of 300 dpi, but unlike the binary 1 bit of gray in the inkjet, the dye-sub has 8 bits of color per channel. The dye-sub images were printed with standard dye-sub glossy paper with three color RGB ribbon, and the inkjet images were printed with Epson Photo Quality Glossy Paper. Both printers were characterized using the software and process outlined below.
Imlab is a DOS-based program which was used to obtain the printer MTF data. It allows for the digitization of images from a video microdensitometer, and the calculation of the image's histogram and profile. The histogram generated from the captured images was the main tool in generating the MTF data, while the horizontal profile was used to see the effects of aliasing on the images.
The procedure for getting the MTF data points from the histograms is as follows:
Test patterns were created with sine patterns of given cycles/inch printed, and these sine patterns were captured with the microdensitometer.
A reference image was taken of the white paper. This image is saved to disk. For each sine pattern, Imlab is used to do the following calculation:
where dark is the digital count the microdensitometer has when the lens cap is on (dark current); image is the sine pattern; reference is the white image; and <reference-dark> is the average digital count of the white image minus the dark current.
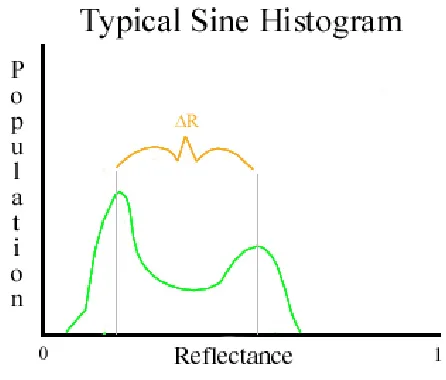
because the sine equation oscillates between two values which would translate to two reflectances, and there are ever more pixels with grey values that approach those max and min values.
Figure 4: Perfect sine wave histogram
A typical sine histogram, however, looks like Figure 5 because the printer cannot perfectly reproduce the sine wave due to factors such as dot gain and the need for tone transfer curves. In the case of the inkjet, producing a sine wave is impossible because it only has binary output, black or white, while a sine image would have a large number of greys. The dye-sub does slightly better, but again, it only has eight bits per channel of output.
Figure 5: Typical sine histogram
The maximum and minimum DC values are converted to reflectances with the following equation:
[image:12.612.192.415.388.578.2]The input modulation is computed in a similar manner, except the values are always the same. The DC values are the average reference - dark for the white, and the DC of a black patch. These are converted to
reflectances, and then the modulation is found.
The MTF is then generated by taking the ratio of the output modulation to the input modulation.
The DC max and DC min values were put into Excel, converted to reflectances, and the modulation was then calculated. At high frequencies (90+ cyc/inch), the analysis became difficult. The histograms yielded by Imlab no longer had two distinct peaks, they merged into a single peak. This could be partially alleviated by observing horizontal line scans which plotted the position versus the pixel value in Cartesian coordinates. From the line scans, the DC max and min could be determined by simply looking at the peaks and troughs of the sine pattern. However, even this analysis became difficult because early effects of aliasing started becoming a problem and the max and min values became indistinct. Therefore, the printer MTFs have a maximum frequency of 93 cyc/inch.
Subjective Evaluation:
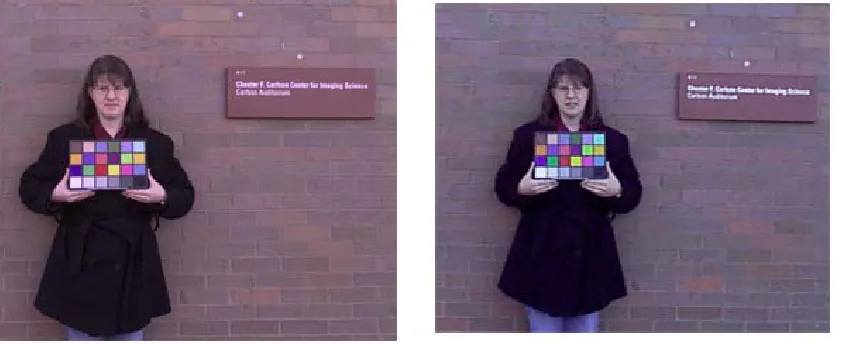
[image:13.612.99.523.257.429.2]The subjective evaluation used natural images like those shown in Figure 6.
Figure 6: subjective images (DCS460 and DC120)
The natural images were taken with a DCS460 (shown on left), a DC120 (shown right), and a traditional camera (not shown). The digital images were printed with both the inkjet and the dye-sub at 5 x 7 inches and a print of the photograph was also made at 5 x 7 inches. Before printing the digital images, some image processing was used. The reason for this was that images taken with digital cameras may have a color cast to them, and the rationale is that the user would adjust the color before printing the images. The 'Auto-levels' function in Adobe Photoshop was used on the entire image, and then just on the MacBeth Color Checker chart. This procedure was used for both the DC120 image and the DCS460 image. After printing, the five images (4 digital, 1 AgX) were mounted on mat board and labeled A through E. Subjects viewed the images under a D5000 daylight light booth, and were given a
questionnaire listed below.
1.) Order (from best to worst) the five pictures based on their sharpness. How do you rate the sharpness of these pictures on a 1-10 scale with 1 being unacceptably blurry and 10 being perfectly sharp?
2.) Order the five pictures based on how pleasing their color is to you excluding the color checker chart. How do you rate the overall color of the pictures on a 1-10 scale with 1 being unacceptable colors and 10 being perfectly pleasing colors?
3.) Order the five pictures based on their color reproduction of just the color checker chart. How do you rate the overall color reproduction of the pictures on a 1-10 scale with 1 being unacceptable reproduction and 10 being perfect reproduction?
perfect quality?
The reason for the two color questions was that the image processing involved an operation on the entire image, and on just the chart, so two questions were devised to separate the effects. It should also be noted that the color checker chart was avaliable for reference while question three was asked.
Results:
Like the previous sections, the results will be split up into three sections: camera results, printer results, and subjective evaluation results. In addition, a system results section will contain the cascaded MTFs.
Camera Results:
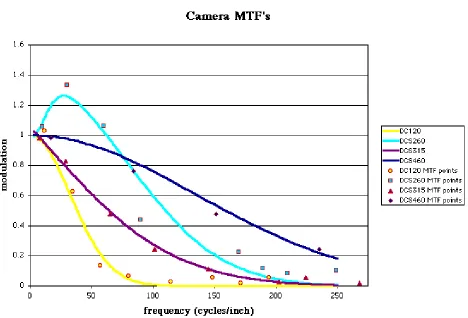
The camera MTFs yielded some interesting results. All of the MTFs can be viewed in Appendix C. Shown in figure 7 are the MTFs with the least sum squared error for each camera.
[image:14.612.75.543.288.606.2]
Figure 7: Camera MTFs
The lines represent the fitted Gaussian curves or difference of Gaussian curves for the 260, while the corresponding data points outlined in red represent actual data points for each camera. The fitted curve equations are shown below, where frequency is in cycles/inch, and SSE is the sum squared error:
Camera Equation SSE DC120 1.06*EXP(-(frequency/33.5)^2)) 0.050 DC260 1.38*EXP(-(frequency/109)^2))-0.4*EXP(-(frequency/17)^2)) .343 DCS315 1.5*EXP(-((frequency+87.9)/143.8)^2)) 0.037 DCS460 1.53*EXP(-(frequency/334)^2)) 0.034 The Gauss fits were obtained using Excel. The data were plotted along with the data from a generic Gaussian of the form: scale*EXP(-((frequency - offset)/width)^2). The parameters scale, offset, and width were adjusted to
approximate the data, and the squared error was calculated for each frequency. The sum squared error was then determined, and using the Excel Solver tool, the error was minimized. If possible, width was the only parameter adjusted, as in the 120 and the 460. However, the 260 needed to be a difference of two Gaussians, so both scale and width were adjusted. The reason for this was the edge enhancement which is a characteristic of the DC260, to be discussed later. This causes the MTF to have a maximum peak greater than one which isn't at zero frequency. The 315 needed all three parameters to reduce its error sufficiently.
One important note about the DCS315 results is that initial images taken with it were blurry even though the image appeared focused in the cameras viewfinder. As a result, the MTF suffered significantly. Therefore, the exposure time corresponding to the best of the DCS315 MTFs was used, and ten images were taken using small focusing steps to ensure at least one sharp image. The MTF shown in Figure 7 corresponds to the best image of these focusing steps.
Printer Results:
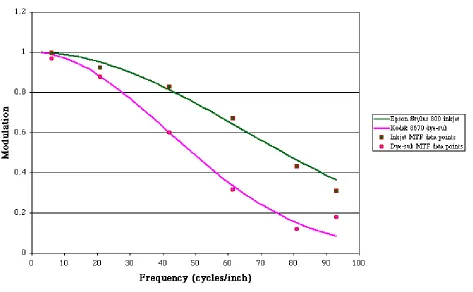
The printer MTFs are shown below in Figure 8:
Figure 8: Printer MTFs
Again, the points outlined in red represent actual data, while the lines are Gaussian fitted curves done in Excel with Solver. The equations are as follows, with frequency in cycles/inch:
Table 2: Printer MTF equations
Printer Equation SSE
Epson inkjet EXP(-(frequency/93.2)^2) 0.038 Kodak dye-sub 1.04*EXP(-((frequency+7.3)/65.5)^2) 0.036 The procedure for obtaining these equations is identical to the one listed above in the camera results section. Both MTFs may be found in Appendix C with the camera MTFs.
Subjective Evaluation Results:
Figure 9: Subjective evaluation graphs
The values shown are based on the normalized average of 12 subjective ratings. The error bars represent plus and minus the standard error of the mean, which is the standard deviation divided by the square root of the number of entries.
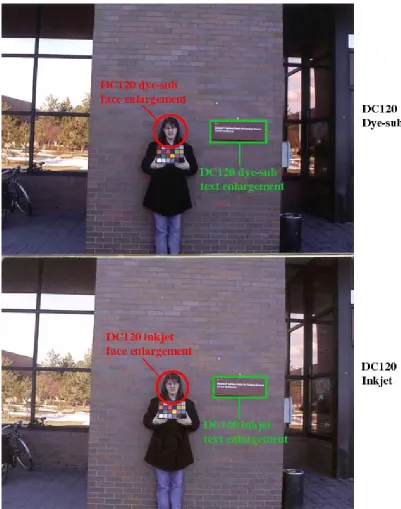
[image:18.612.93.494.131.640.2]In addition to these results, the prints which the evaluations were based on are a result also. First, Figure 10 shows the DC120 prints with the inkjet and the dye-sub.
Figure 10: DC120 prints
Figure 11: DC120 facial enlargements (dye-sub on left, inkjet on right)
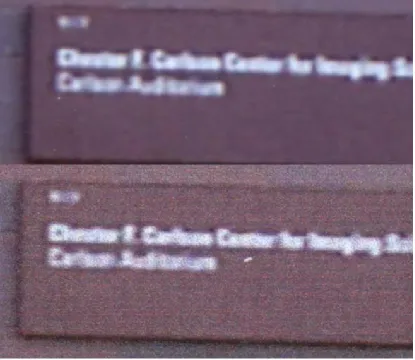
Figure 12: DC120 text enlargements (dye-sub on top, inkjet on bottom)
Figure 13: DCS460 prints and traditional photograph
Figures 14 and 15 are the face and text enlargements of the prints, again to show their differences.
Figure 14: DCS460 and traditional face enlargements (clockwise order: dye-sub, inkjet, traditional)
Figure 15: DCS460 and traditional text enlargements (order from top: dye-sub, inkjet, traditional)
System Results:
Figure 16: System MTFs
These MTFs were derived by multiplying the camera MTFs by the printer MTFs. The points which were plugged into the Gaussian equations listed above were the frequencies used for the printer sine targets. The reason for this was that the printers were the limiting device in the system in that their MTFs only went to 93 cycles/inch.
Discussion:
The results of this study have yielded several interesting results on the topic of digital photography. In this section, the results will be discussed and related to the hypotheses and the background and theory of the research. In addition, possible sources of error will be examined.
The results of the camera characterizations were in general as expected. The DCS460 high-end camera MTF faired much better than any of the other cameras, while the low-end DC120 camera MTF faired much worse. This result is expected simply because the 460 is a more expensive camera than the others and therefore has more CCD pixels to image with, as opposed to the 120. However, the camera MTFs did yield some surprises. The most noticeable of these is that the DC260 performed much better than the DCS315 did. This can plainly be seen by the MTF curves in the results section, at all but the high frequencies, the 260 is well above the 315, and at the high frequencies, the 315 performs no better than the 260. The reason for this in the 0-60 cycles/inch frequency range is that the 260 clearly has some edge enhancement processing going on within the camera. It is impossible for an MTF to be greater than unity unless the output modulation is in fact higher than the input. The typical way to accomplish this is to make the darks darker and the lights lighter at high contrast boundaries (edges) within the image. In fact, this actually
becomes visible on high magnification of the 260 images at the knife edges: at the knife edge, the values are darker in the black region and lighter in the white region than they are at further distances from the edge. In addition to the edge enhancement, however, the 260 continues to outperform the 315 at greater than 60 cycles/inch, where no obvious edge enhancement is taking place. The reason that this result is surprising is that the DCS315 is
improvements which would account for the superiority of the camera compared the the older DCS315. One possible reason for the discrepancy may be that the DC260 is an interline camera while the DCS315 is a frame transfer. This possibility will be discussed in detail in the conclusion section. Another important note about the DCS315 which was mentioned in the results section was that although some initial images appeared to be in focus in the camera viewfinder, the images taken with the camera were not. The reason for this was most likely poor alignment within the camera. If the optics which take the image from the camera lens to the viewfinder are at a different path length than to the CCD chip, then the image will not be as expected because it won't be focused on the CCD.
The possible sources for error with the camera characterizations are mostly based on human error of the principal investigator. Evidence of this is the problems experienced with the DCS315. The defocus of its images might not be due to the optics of the camera, but of the photographer. If this was the case for the 315, it may well be the case for the other cameras. However, this source of error would not have affected the results too severely because most of the MTF differences are quite large, so a decrease in the modulation values from defocusing would probably not have altered the fact that, for example, the DC260 outperformed the DCS315. Another source of error might have been the Image Analyzer software. This software was never tested by the principal investigator, and it could be incorrect. However, Kodak's evaluation of the plug-in (8) seem to indicate that it is very reliable for determining digital camera MTFs, so it is unlikely that this was a significant source of error.
The printer results were quite surprising indeed. It was expected that the dye-sub would outperform the inkjet due to its greater cost and greater number of bits per color channel. However, the inkjet did noticeably better than the dye-sub, as the printer MTFs listed in the results section show. There are several possible explanations for this difference. The first explanation comes about by looking at the sine patterns under the microdensitometer. When the inkjet tries to reproduce a sine wave, it is limited to binary output; black or white. The dye-sub, on the other hand, can print tones of grey. It might seem that the dye-sub has a better chance of faithfully reproducing the sine pattern, but one must keep in mind that the measure here is the MTF, which is calculated by taking the output modulation divided by the input modulation. As previously stated, the modulation is (max-min)/(max+min), so the only values to be considered are the maximum and minimum reflectances.
Clearly, the inkjet has only black and white values when printing monochrome images. Therefore, the black is the minimum reflectance, and the white is the maximum. The dye-sub, however, does not have white as its lightest shade. It seems to be printing some value where the sine wave should be white, which would decrease the maximum reflectance. Even at the low frequencies this is evident. If the maximum is less than it should be at every frequency with the dye-sub, then the modulation will be less, and therefore the ratio of output to input will be less, which would account for the poorer MTF. Another reason for the superiority of the inkjet is that although its dpi was found out to be less than 1440 x 720, the 'true' dpi of 400 is only an approximation, and it might actually be significantly higher. Even though the dye-sub has a higher number of bits/channel, a higher resolution might make the inkjet outperform it.
There is one apparent problem with the MTFs, and that is that the dye-sub appears to have greater modulation past 80 cycles/inch than it does just before 80 cycles/inch, i.ethe MTF starts to bound upward. This is most likely due to error of the experimenter. As previously stated, at high frequencies, the min and max values became difficult to identify. It is probable that the reason for the increase in the MTF is due to incorrect evaluation of the min and max values. Based on the data in the MTF curve, one might suspect that the apparent increase in modulation is due to aliasing. However, before aliasing occurs in a device, the modulation must first fall to zero before the modulation begins to increase again. By looking at the data points on the curve, it is clear that this isn't the case, the modulation does not appear to go to zero. In addition to this, human error is probably the largest source of error for the printers. Additional sources of error are inconsistency of the light source for the microdensitometer set up, and noise from the microdensitometer. Because the printer experiment spanned several days, the light source might not have been of the same intensity from day to day. This would affect the flat-fielding of the images and would therefore change the max and min values of the sine patterns, which would alter the MTF. The noise from the microdensitometer was probably minimal, but it still may have been a factor.
the best, and in the color reproduction category, it faired the worst. The main 'saving grace' for the traditional photograph is that it was poorly printed by the developers, so the colors appear dull. This would explain its poor performance with the color evaluations, but that doesn't save it from the sharpness evaluation, or the overall quality evaluation. And while there is some uncertainty with any subjective evaluation test, it is clear that the photograph did not outperform either the DCS460 with the inkjet and with the dye-sub. Again, however, the poor color must be mentioned. The overall quality evaluation is in essence a weighted average of the previous questions of sharpness and color. In general, subjects weighted sharpness more than color, but color is still a factor. Keeping this in mind, it seems plausible that the photograph would have at least faired better than the DCS460 image printed with the inkjet for the overall quality evaluation, if not both 460 images. The sharpness evaluation, however, is much less certain. The DCS460 printed with the inkjet scored slightly higher than the photograph, and the standard error bars show that these values are essentially interchangeable.
The most obvious conclusion about the subjective evaluations is that the subjects much preferred the images taken with the DCS460 than those with the DC120. This result was expected because of the vast price difference between the two cameras, and the differences in CCD size and optics. The interesting result to be looked at regarding the DC120 images is that they scored approximately the same regardless of what printer they were printed on. The dye-sub prints actually faired worse in every category, but the difference is minimal and the error indicates that the order might not hold if more subjects were used.
The important source of error for this experiment is clearly the unpredictability of human observers. Many factors can alter how subjects rate images including: wording of questions, initial order of the images, lab setting, and states of mind. The only solution to this problem is to increase the number of subjects, and this was accomplished by adding four subjects to the original eight. This addition did reduce the error significantly, but more subjects could obviously reduce it more.
In addition to the subjective evaluation results, the prints which were used in the evaluations were results of the DC120 and DCS460 systems and should be discussed also. The figures shown in the results section are
magnifications of the original prints, specifically the face and the text in the images. These allow one to closely examine the images and get some insight as to why some of the subjective evaluation results occurred. The DC120 magnifications show that there are no significant advantages that one printer has over the other. This matches the results of the subjective evaluations very well, the overall quality and sharpness evaluations have the same result. The DCS460 and traditional photograph text magnifications show that the inkjet does in fact appear sharper than the dye-sub or the traditional photo. Again, this supports the sharpness evaluation where the inkjet performed the best. Also, the photograph appears to be slightly sharper than the dye-sub, which also matches the subjective results. The facial enlargement, however, seems to contradict these results. The traditional photo seems to have the sharpest face while the inkjet and dye-sub are approximately equivalent. The subjective results aren't really contradicted when one considers the cues in the image to direct the observer to the sharpness in the image. The most important sharpness cue is the text, which, when magnified (Figure 12, 15), matches the subjective results.
The system MTFs generated by cascading the camera and printer MTFs were the main thrust of this study. There are several important things to note about these curves. The most noticeable fact about the system MTFs is that the DC260 with the inkjet performs the best. Even at high frequencies ( >75 cycles/inch), the DCS460 with the inkjet is only slightly better. This is really a quite astounding result. For a consumer-based camera to outperform a
technology, it really can't be considered an upgrade. It is better thought of as a printer "option". The previous comments on the interline vs. frame transfer regarding the DC260 and 315 have been cascaded along with the MTFs. The DC260's edge enhancements make it superior to the DCS315. However, it is interesting that with the inkjet, the DCS315 actually does better than the DC260 with the dye-sub. In fact, the DCS315 inkjet combination performs better than the DCS460 with the dye-sub at greater than 45 cycles/inch. This is an important result because the most expensive camera printer combination performs poorer than the two cameras below it with inkjet printing. However, the MTFs do not always predict subjective quality, and this can be seen with the inkjets subjective ratings, discussed in the conclusions section.
Conclusions:
The purpose of this study was to examine the current state of digital photography. The main goal was to create a model of digital photographic systems which would cover a wide range of qualities and expense. For the purposes of this research, digital photography has referred to input with a digital camera and output with a digital printer. Another goal of the research was to examine the effects of frame transfer vs. interline CCD technologies. A comparison of digital photography vs. traditional photography was also hoped for from this research. Finally, this study hoped to answer the question of whether a printer/camera upgrade will significantly improve the output of a digital photography system.
The methods used to accomplish these goals were the characterizations of the Kodak DC120, DC260, DCS315 and DCS460 cameras, the characterization of the Epson Stylus 800 inkjet and Kodak 8670 dye-sub, and the subjective evaluations of images taken with the DC120 and DCS460, printed on both the inkjet and the dye-sub, in addition to a traditional photograph taken with a point-and-shoot camera. The camera characterizations consisted of determining the MTFs of each camera by the slanted knife edge method. The printer characterizations were done by finding the MTFs of the printers with sine targets. Finally, the subjective evaluations were performed by imaging a natural scene and asking 12 subjects to evaluate the image based on four questions regarding the images sharpness, color, and overall quality. The camera and printer MTFs were then cascaded to get eight system MTFs.
Several conclusions can be made about the digital cameras examined in this research. The first conclusion is that the DCS315 does not perform nearly as well as expected. It performed only slightly better than the DC120 which is the cheapest of the cameras used in this study. The reasons for this are unknown. Although problems were encountered with its focusing, the MTF was found with a focused image, so this should not be a factor. It is very interesting that the DCS315 which is a frame transfer CCD was outperformed by the DC260 which is an interline. As stated in the background section, an interline chip has its pixels in alternating columns of sensors and storage, while a frame transfer uses half of its chip for image capture and half for storage. The 260 did much better than the 315 at all frequencies. Based on the analysis performed by this research, a comparison of interline vs. frame transfer cannot be done. It has become obvious that there is much more to these two cameras than their CCDs, so a direct comparison of the technologies using these cameras is impossible. However, one possible reason for this is stated in the
background section. A frame transfer chip takes longer to transfer its image to storage than an interline because it doesn't have its storage pixels adjacent to its capture pixels. This longer distance may in fact significantly degrade the image quality. Clearly, when these charge packets are transferred, the move is not flawless, some electrons may be left behind in the process. By going a further distance, the frame transfer chip (in the DCS315) may loose a significant amount of electrons, which would cause the image to have less information than an interline whose electrons have a relatively short distance to travel.
Another conclusion which may be made about the cameras is that while the DCS460 performed much better than the other cameras, the DC260 is in fact a wiser choice for the amateur photographer. Part of the reason for this
There is only one conclusion which is of significant relevance to this research which can be made about the printers examined without talking about them in conjunction with the cameras. It is obvious that for the two printers which were characterized, the inkjet is quite superior to the dye-sub in terms of MTF. At all the frequencies looked at, the Epson inkjet performed much better than the Kodak dye-sub. The reasons for this were listed in the Discussion section. This is one of the most surprising conclusions made by this study. Given the dye-sub technology's price and reputation, it was expected to do much better than the inkjet. Judging by the MTF curves of these two printers this expectation is in fact false. However, it is extremely important at this time to point out that the MTF does not completely characterize or describe the performance of a device! What the MTF describes is how much input sine waves are attenuated by the system. The reason it is used so frequently for device characterization is that, as Fourier discovered, any function (image) can be decomposed into a sum of sines and cosines. Therefore, the MTF can relate how well the device is reconstructing these sines and cosines which make up an image. Clearly this metric does not describe every attribute of a device. Other important features which comprise an image's quality are noise, color reproduction, and in the case of the inkjet, halftoning. This halftoning is a significant feature of the inkjet and of the subjective evaluations on its prints, which will be described later in this section. The point is that although the inkjet's MTF is better than the dye-sub's, it doesn't necessarily mean that the inkjet is the better printer for all purposes. As previously discussed, part of the reason for the inkjet's superior performance was that it only has binary output, and the MTF looks at max and min values which could therefore only be black or white. Before discounting the apparent performance of the inkjet however, two factors must be considered. The first is how much human observers like its prints, this factor will be discussed with the subjective evaluations. The other factor is the price of the inkjet. The latest price for an Epson Stylus 800 is approximately $279, a far cry from the Kodak 8670 price of $5500. This is of very significant importance to this study. Although this discussion just got finished saying that the MTF is not the only factor to consider and that the results are somewhat artificial, the inkjet MTF is still the better of the two. Combining this fact with the price difference leads to the conclusion that for all but the most professional of users, the inkjet is by far the best printer to use for digital photography. This will become more evident when the system MTFs and the subjective evaluations are discussed. There are, however, some caveats to this statement. There is more to a printer than its MTF. Factors such as light and water fastness, in addition to archival quality of the prints are also very important to users. In these categories, the dye-sub is by far the best candidate. However, the fact remains that the inkjet possesses better resolution at a much lower price.
difference between the DC120 images and DCS460 images is very significant. This is to be expected because their MTFs are so different.
There are some conclusions to be made regarding the color ratings also. The first is that the DCS460 inkjet
combination is the best for color preference. The colors are richer, and they match the original more closely than the other combinations. This is, however, only a subjective rating. Colorimetric measurements would be necessary to verify that the DCS460 with the inkjet was in fact reproducing the colors the best. This brings up an important fact about the color reproduction rating. Although the DCS460 with the inkjet was rated at being the best at reproducing the color checker chart's colors, this may be based largely on the visual preference of the subjects. In other words, the visual system might regard certain colors more preferable on one print than another and equate that with better color reproduction when in fact the color of another print might be more accurate. Another conclusion which could be made from the color ratings is that traditional photographs create undesirable colors and are bad at color
reproduction. However, this conclusion is most likely false. As previously mentioned, the photograph was poorly printed by the developers and does not really represent the best that a silver halide print can do. A conclusion based on the camera used can also be made from the results. It is obvious that the DC120 does a worse job at making pleasing colors and at reproducing colors on its prints. This is to be expected because of the price and quality difference between the DC120 and the DCS460. Another interesting fact about the DC120 color ratings is that its ratings with the printers match the results of the DC460 prints. That is, the inkjet with a given camera produces more desirable colors which are judged as being closer to the original than the dye-sub. This is an important result for the inkjet / dye-sub question because the dye-sub actually has more bits per channel and should therefore be able to produce better colors. The conclusion just stated clearly discounts that theory however.
Finally, the topic of overall quality needs to be discussed. The winner of this category has already been stated, the DCS460 printed with the inkjet. There are some other important conclusions which can be made about this rating however. The first is that the DC120 does not really benefit significantly from a change in printer technologies. This supports the hypothesis regarding printer upgrades. The hypothesis stated that for a low-end camera, an upgrade in printers would not be significant. This has been proven by the results presented in this study, the difference between printers for the DC120 is minimal. The other obvious conclusion for this rating is that for a given printer, a change from a low to a high-end camera is significant. Clearly the inkjet with the DC120 vs. the inkjet with the DCS460 yielded very different results. What this says is that digital photography is very limited by the camera used for the image input.
The next topic to discuss is that of the system MTFs. Again, many conclusions can be made about digital
photography from the system MTFs. The first is that the goal of creating a model of digital photography has to an extent been achieved. The printers and cameras span a wide range of quality and expense and their results relay a lot of information regarding digital photography. Many of the conclusions based on the system MTFs merely reflect the conclusions from the individual camera and printer MTFs. This is to be expected because the system MTF is simply a camera MTF multiplied by a printer MTF. The first conclusion is that the DC260 with the inkjet is the best performer of the MTF curves. It even outperforms the DCS460 with the inkjet. This is an important result because the system which performed the best is one of the cheapest combinations. What this means is that the price vs. performance curve would not be monotonically increasing as one would expect. It peaks with the DC260 and the inkjet and declines for every other combination. Another conclusion which can be made from the system MTFs is that the DC120 does not benefit from a switch in printer technologies. This result in the MTF curves clearly backs up the conclusion made based on the subjective evaluations of the DC120. Therefore, this result also supports the hypothesis that low-end cameras do not benefit from printer upgrades. However, based on the system MTFs it is obvious that for a high-end camera, a printer upgrade is very significant. This can be seen for both the DC260 and the DCS460. The inkjet in both cases has a much better MTF than the dye-sub equivalent. Again, the price vs. performance curve seems to be nonlinear. The inkjet is much more inexpensive than the dye-sub, yet it performs better for every system combination.
that the DC120 would outperform the DCS460. A comparison of the DC260 with the DCS460 might be of significant use due to the MTF results of these two cameras mentioned earlier. Another factor to add to the subjective evaluations is to use different sized prints which was also discussed earlier. There are other aspects of digital photographic systems which should be analyzed besides MTF and subjective evaluation. One is the noise associated with the systems. This is important because noise can become a problem with long camera exposures. Another factor to analyze is color reproduction. While this factor was addressed by this study, it was not of an objective nature. The metric which would be of the most use for this would be *E, which represents the difference between the original color and the reproduced color. Finally, it might be of interest to remove the printers from the system and replace them with monitors of varying sizes. It could be argued that viewing the digital camera images on screen is as if not more important than hard copy output. In this situation, one would proceed in a similar manner by obtaining the monitor MTFs and getting subjective evaluations of on screen images, in addition to any of the other research discussed in this paragraph.
To summarize, many conclusions have been pointed out regarding digital photography. The most significant is that the Kodak DC260 and the Epson Stylus 800 inkjet are the best performers of the devices studied, individually and in tandem. This is an important conclusion because neither of these devices are the most expensive in their category. Another benefit from doing this study has been that a model has been created which spans a wide range of qualities for both cameras and printers. It is possible with the results from this research to estimate where a given camera -printer combination falls on the system MTF curve and decide how it compares to other combinations. An important conclusion based on this research has been that for a low-end camera, an upgrade in printers does not create
significant improvements in resolution, whereas for a high-end camera, a printer upgrade is quite beneficial to the MTF of the system.
An Evaluation of the Current State of Digital Photography
Charles Dickinson
References
1. Gerald C. Holst, CCD Arrays, Cameras, and Displays, JCD publishing, Winter Park FL, 1996 2. Gerhard A. Nothmann, Nonimpact Printing, Graphic Arts Technical Foundation, Pittsburgh PA, 1989 3. G.J Martin, “High-resolution Color CCD Camera”, Proceedings of SPIE: Cameras, Scanners, and Image Aquisition Systems, vol. 1901, pp. 120-135 (1993)
4. Adobe Photoshop: http://www.adobe.com/prodindex/photoshop/main.html
5. Microsoft Excel: http://www.microsoft.com/catalog/display.asp?site=618&subid=22&pg=1
6. PIMA Image Analyzer: http://www.pima.net/kp_sfr_measure.htm
7. Graphic Converter: http://www.lemkesoft.de/us_gcabout.html
8. Don Williams, "Benchmarking of the ISO 12233 Slanted-edge Spatial Frequency Response Plug-in", IS&T PICS Conference
9. IDL: http://www.rsi.com
An Evaluation of the Current State of Digital Photography
Charles Dickinson
Appendix A
PRO dc260
filename=PICKFILE(title='Select the TIFF image
',/R,filter='/nfs/cis/ugrad/chd4750/Senior/luminance260/*.tif') image1=READ_TIFF(filename)
;tv, image1
xsize=N_ELEMENTS(image1(*,1)) ysize=N_ELEMENTS(image1(1,*)) mean = FLTARR(11)
;--- --
;each of the following sections looks within the defined area (ex. ref1), takes the mean of the digital values, and also prints the standard deviation to the screen
;FOR DENSITY = .1
ref1=image1[665:685,500:525] sum1=TOTAL(ref1) mean[0]=sum1/N_ELEMENTS(ref1) mom1=MOMENT(ref1,SDEV=s1) print,s1 ;--- ---
;FOR DENSITY = .2
ref2=image1[700:712,500:525] sum2=TOTAL(ref2) mean[1]=sum2/N_ELEMENTS(ref2) mom2=MOMENT(ref2, SDEV=s2) print,s2 ;--- ---
;FOR DENSITY = .3
ref3=image1[722:735,500:525] sum3=TOTAL(ref3) mean[2]=sum3/N_ELEMENTS(ref3) mom3=MOMENT(ref3, SDEV=s3) print,s3 ;--- ---
;FOR DENSITY = .4
ref4=image1[746:757,500:525] sum4=TOTAL(ref4)
mom4=MOMENT(ref4,SDEV=s4) print,s4
;--- ---
;FOR DENSITY = .5
ref5=image1[767:780,500:525] sum5=TOTAL(ref5) mean[4]=sum5/N_ELEMENTS(ref5) mom5=MOMENT(ref5,SDEV=s5) print,s5 ;--- ---
;FOR DENSITY = .6
ref6=image1[792:803,500:525] sum6=TOTAL(ref6) mean[5]=sum6/N_ELEMENTS(ref6) mom6=MOMENT(ref6,SDEV=s6) print,s6 ;
---;FOR DENSITY = .7
ref7=image1[815:825,500:525] sum7=TOTAL(ref7) mean[6]=sum7/N_ELEMENTS(ref7) mom7=MOMENT(ref7,SDEV=s7) print,s7 ;--- ---
;FOR DENSITY = .8
ref8=image1[836:850,500:525] sum8=TOTAL(ref8) mean[7]=sum8/N_ELEMENTS(ref8) mom8=MOMENT(ref8,SDEV=s8) print,s8 ;--- ---
;FOR DENSITY = .9
ref9=image1[860:875,500:525] sum9=TOTAL(ref9) mean[8]=sum9/N_ELEMENTS(ref9) mom9=MOMENT(ref9,SDEV=s9) print,s9 ;--- ---
;FOR DENSITY = 1.0
ref10=image1[883:895,500:525] sum10=TOTAL(ref10)
mom10=MOMENT(ref10,SDEV=s10) print,s10
;--- ---
;FOR DENSITY = 1.1
ref11=image1[905:930,500:525] sum11=TOTAL(ref11)
mean[10]=sum11/N_ELEMENTS(ref11) mom11=MOMENT(ref11,SDEV=s11) print,s11
;
---;Here, the variables where the average digital counts are stored get read out to a text file
filename2=PICKFILE(title='Select the OECF file to write ',/W,filter= ' *.txt') OPENW,1, filename2
PRINTF,1,mean[0] PRINTF,1,mean[1] PRINTF,1,mean[2] PRINTF,1,mean[3] PRINTF,1,mean[4] PRINTF,1,mean[5] PRINTF,1,mean[6] PRINTF,1,mean[7] PRINTF,1,mean[8] PRINTF,1,mean[9] PRINTF,1,mean[10] CLOSE,1
END
An Evaluation of the Current State of Digital Photography
Charles Dickinson
Appendix B
DC120 reflectance vs. DC curves
DCS260 reflectance vs. DC curves
DCS315 reflectance vs. DC curves
DCS460 reflectance vs. DC curves
An Evaluation of the Current State of Digital Photography
Charles Dickinson
Appendix C
DC120 MTFs
DC260 MTFs
DCS315 MTFs
DCS460 MTFs