Int. J. Electrochem. Sci., 8 (2013) 7327 - 7344
International Journal of
ELECTROCHEMICAL
SCIENCE
www.electrochemsci.org
Influence of the Second Coordination Sphere on the
Electrochemical Behavior of Chromium Complexes in Chloride
Melts: Experimental and Calculation Methods
Yu. V. Stulov, V. G. Kremenetsky, S. A. Kuznetsov*
I.V. Tananaev Institute of Chemistry and Technology of Rare Elements and Mineral Raw Materials, Kola Science Centre of the Russian Academy of Sciences,
26a Akademgorodok, Apatity, 184209, Murmansk region, RUSSIA *
E-mail: [email protected]
Received: 4 March 2013 / Accepted: 22 March 2013 / Published: 1 May 2013
The cyclic voltammetry method was used to determine the standard rate constants of charge transfer (ks) on a glassy carbon electrode for the Cr(III)/Cr(II) redox couple in the systems of NaCl–KCl–CrCl3, KCl–CrCl3, and CsCl–CrCl3 in the temperature range of 973–1173 K. It was shown that ks increase with increasing temperature and decreases as sodium cations are replaced by potassium and cesium cations in the second coordination sphere of chromium complexes. The calculations carried out using the Firefly quantum–chemical software by means of the DFT method showed that the values of the charge transfer activation energy change monotonously in the series of Na–K–Cs in accordance with the ratio of reorganization energies. In its turn, this leads to monotonous variation of the charge transfer rate constants.
Keywords: melt, redox couple, chromium complexes, quasi-reversible process, cyclic voltammetry, standard rate constants of charge transfer, quantum-chemical calculations
1. INTRODUCTION
Electrochemical behavior of chromium in molten alkali chlorides is studied in a great number of works [1-8]. This is due to the possibility of obtaining ductile chromium in molten salts using an electrochemical technique [1]. It was found in all studies that electroreduction of chromium complexes to the metal occurs in two stages. The electroreduction processes can be described by the following electrode reactions:
Cr(III) + e– ↔ Cr(II) (1)
At the same time, the effect of the second coordination sphere on the standard rate constants of charge transfer for the Cr(III)/Cr(II) redox couple was not established in any work. It is necessary to point out that the amount of works studying the effect of the second coordination sphere on the standard rate constants of charge transfer of metal redox couples is not large. Thus, it was established for the redox couples of Eu(III)/Eu(II) [9-12], Sm(III)/Sm(II), and Yb(III)/Yb(II) [13] in alkali chlorides that the ks values grow with an increase in the size of the outer sphere cation from sodium to cesium. Charge transfer in the above couples probably occurs through the outer sphere cation and the highest ks values obtained for molten CsCl are explained by its higher polarizability as compared to other alkali cations [12].
In [14, 15], the method of cyclic voltammetry was used to determine the standard rate constants of charge transfer of the Nb(V)/Nb(IV) redox couple in the NaCl–KCl (equimolar mixture)–K2NbF7, KCl–K2NbF7, CsCl–K2NbF7 melts. The following unusual series of variation of the charge transfer rate constants was established: ks (KCl) < ks (CsCl) < ks (NaCl–KCl). The calculations carried out in [15] using the PC GAMESS/Firefly ab initio quantum–chemical software showed that the values of the charge transfer activation energy might indeed change nonmonotonously in the series of Na–K–Cs in accordance with the ratio of reorganization energies. In its turn, this leads to nonmonotonous variation of the charge transfer rate constant.
The charge transfer rate constants for the Cr(III)/Cr(II) redox couple using the method of cyclic voltammetry were determined in the KCl [16] and CsCl [17] melts. It was found in these studies that ks depends on the CrCl3 concentration in molten salts and decreases at an increase of the concentration of chromium trichloride and charge transfer activation energies grow. In the opinion of the author, this is related to formation of binuclear chromium complexes in the molten systems.
The obtained results appear ambiguous, as the fraction of binuclear complexes grows with an increase in the concentration, while in the case of the presence of the Cr–Cl bridge bond, the reorganization time and energy of the complex decrease, as a rule, owing to the low strength of this bond. In this case, the charge transfer rate constant must grow and not diminish with an increase in the concentration. In its turn, the charge transfer activation energy must decrease and not increase.
An assumption as to formation of polynuclear complexes does not agree with the result of [18], where formal standard potentials of Cr(III)/Cr(II) and Cr(II)/Cr were determined in alkali chloride melts, and no deviations from the Nernst law were observed. This assumption contradicts the data of electron spectroscopy [19] that exclude formation of polynuclear chromium complexes in NaCl–KCl, KCl, CsCl melts. In [16, 17], the reference electrode was the Ag/NaCl–KCl–AgCl electrode (2 wt.%) with a porcelain or alundum tube. We established interaction of these materials with the NaCl–KCl– CrCl3 melt [20]. After two hours of the conditioning of the reference electrode in the chloride melt, film formation on porcelain or alundum was observed.
The exact film composition could not be determined, but it includes chromium with the oxidation degree of +3 and +2. It was found that formation of this film in the course of measurements resulted in an increase of ohmic resistance between the working electrode and reference electrode. Herewith, an increase in ohmic resistance in the course of the experiment was also observed.
problem of using the reference electrode in the molten alkali chlorides containing CrCl3 is also indicated by the fact that the values of formal standard potentials E*Cr(III)/Cr(II) calculated on the basis of the values of the peak potentials in molten KCl and CsCl [16, 17] agree poorly with the results of [18, 19].
Another procedure error in [16, 17] consisted in using the same working electrode of glassy carbon for studying both process (1) and electrode reaction (2). Discharge of Cr(II) complexes on a glassy carbon electrode leads to formation of chromium carbides. Due to the processes of carbide formation and their dissolution, “surface” loosening occurs and many defects are formed on the electrode surface [21], which inevitably affects the standard rate constants of charge transfer of the Cr(III)/Cr(II) redox couple.
To determine ks, one must know diffusion coefficients of the Cr(III) and Cr(II) complexes. Numerous and well agreeing data on diffusion coefficients D were obtained for the NaCl–KCl system [2-7]. In this work, the results of [5] were used to calculate ks. For the KCl melt, the data on diffusion coefficients are presented only in two works [7, 22] and the values of diffusion coefficients differ drastically. The results of [7] appear ambiguous, as the author established that the values of D grow with an increase in the radius of the outer–sphere cation, which contradicts numerous data on the effect of the second coordination sphere on the values of diffusion coefficients [23]. Diffusion coefficients of Cr(III) and Cr(II) in the CsCl melt were determined in [17]. In the opinion of the authors, mononuclear and binuclear chromium complexes in the KCl and CsCl melts are present and it remains unclear what the concentration of these forms is and for which complexes diffusion coefficients were determined. Besides, if one assumes the position of the author [16, 17] that both the charge transfer rate constants and charge transfer activation energies change under variation of concentration, then the diffusion coefficients of each separate system with a different concentration may also be different.
Due to the above mentioned the values of diffusion coefficients obtained on the basis of correlation equations from [24] were used for calculation of ks in molten KCl and CsCl.
The aim of the present study was to determine the standard charge transfer rate constants of the Cr(III)/Cr(II) redox couple in molten NaCl–KCl (equimolar mixture), KCl, and CsCl, which allows establishing the effect of the composition of the second coordination sphere on their values.
This work is a part of systematic studies of the first and second coordination sphere composition on the standard rate constants of charge transfer for redox couples of refractory metals, including chromium.
2. EXPERIMENTAL
2.1 Electrochemical methods
crucible was placed in a sealed retort of the X18H10T stainless steel. Voltammetric curves were recorded on the glassy carbon (SU-2000) electrodes vs. a glassy carbon quasi-reference electrode (a SU-2000 plate). Using a quasi-reference electrode allowed the contact between the oxides, incorporated in the structure of the classical reference electrode with the chloride melt [10, 11]. The potential of the quasi-reference electrode is a compromise determined by redox processes occurring with the participation of different melt components; therefore its value depends on the melt composition and temperature [11]. It should be noted that using a quasi-reference electrode is a prerequisite for obtaining reproducible results and studying chloride melts containing CrCl3, as discussed above. Therefore the Ag/NaCl–KCl–AgCl (2 wt.%) reference electrode was dipped into the melt only at the end of each experimental series for a short time and the standard rate constant of charge transfer was determined. A good agreement is observed between the ks values obtained when using a silver reference electrode and glassy carbon quasi-reference electrode.
The procedure of salts preparation was as follows. Alkali chlorides (Prolabo 99.5% min.) were recrystallized, sintered in a muffle furnace, and placed into a quartz retort. The retort was evacuated to the residual pressure of 0.66 Pa, first at room temperature and then by step-wise heating to 473 K, 673 and 873 K whereupon it was filled with inert gas (argon) and the electrolyte was melted.
The background salt was put into a glassy carbon crucible, immersed into a retort and subjected to the evacuating and melting operations described above.
2.2 Quantum-chemical calculations 2.2.1 Model System and Its Limitations
and to test the obtained conclusions by comparison of the calculated and experimental characteristics of heterogeneous charge transfer.
The choice of such experimental data for comparison with calculations was based on a successful prediction of an anomalous ratio of the constants of heterogeneous charge transfer in the series of the Na-K-Cs outer-sphere cations we obtained earlier for the systems of the type (M+)n[NbF7]2- [33]. It turned out that it is for the most stable particles that the correct ratio of the calculated activation charge transfer energies is fulfilled, i.e., corresponding to the ratio of the standard rate constants of charge transfer in the series of outer–sphere cations of Na–K–Cs.
Therefore, one may assume that the composition of the most thermodynamically stable particles also characterizes the most probable dynamic composition of the electroactive complex in the melt that under certain conditions, takes predominant part in the electrochemical charge transfer.
At the same time, our experiments for determination of the charge transfer rate constants revealed the dependence of the experimental data on the anionic composition of electrolyte. This means that the common level of model systems limited by account for only the outer–sphere shell of complexes (type I) is in this case insufficient. One has to complicate the description of systems in order to take into account the anionic composition of the melt. This may be achieved by introduction of a certain amount of electrolyte MX into the model system. A transition to more extensive systems (type II) requires development of a different calculation technique for the activation energy as compared to the one used in model systems of type I limited by account for only the outer–sphere shell and implies a drastic increase in time consumed in calculations. In this work, the calculation results are related only for model systems of type I. Despite a comparatively small size, the systems of this level are very important methodically, as they allow studying a number of qualitative effects that can hardly be discovered in large systems in the absence of the corresponding preliminary data.
Taking into account the effect of the electrode surface and the corresponding electric field on the processes of charge transfer is the most complicated stage requiring a significant volume of preliminary systematic studies. In this work, the effect of this factor is not considered. In other words, the ratios of the calculated activation energy values for a number of the outer-sphere cations of Na-K-Cs presented below actually correspond to homogeneous charge transfer. However, due to proportionality of the reorganization energies of homogeneous and electrochemical charge transfer [34] and with account for the dominating contribution of this component to the overall Marcus formula, one may assume that the ratios of activation energies in the series of OS cations of Na-K-Cs will be close in the case of homogeneous and electrochemical charge transfer.
2.2.2 Calculation Methods
optimized geometry was accompanied by the control calculation of vibrational frequencies and thus, all the presented data correspond to the true minima on the potential energy surface (there are no imaginary frequencies).
3. RESULTS AND DISCUSSION
3.1 Electrode reactions and kinetic parameters of chromium ions in the chloride melts
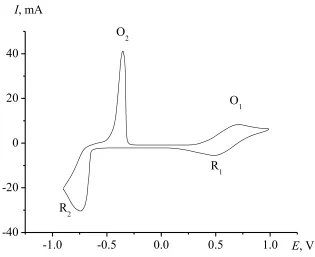
The cyclic voltammogram of the NaCl–KCl–CrCl3 melt is presented in Fig. 1. It is characterized by two electroreduction peaks R1 and R2 corresponding to processes (1) and (2) and two peaks of electrooxidation of Cr to Cr(II) and Cr(II) complexes to Cr(III): peaks O2 and O1.
The typical cyclic voltammograms for the Cr(III)/Cr(II) redox couple obtained in the CsCl– CrCl3 melt on a glassy carbon electrode at different polarization rates are presented in Fig. 2.
-1.0 -0.5 0.0 0.5 1.0
-40 -20 0 20 40
I, mA
E, V O1
R1 O2
[image:6.596.145.460.332.589.2]R2
Figure 1. Voltammogram of the NaCl–KCl–CrCl3 melt. Concentration of CrCl3=0.039 mmol cm-3, T = 973 K. Electrode area: 0.698 cm2. Sweep rate: 1.5 V s-1. Reference electrode: Ag/NaCl–KCl– AgCl (2 wt.%).
electrolysis at the potentials of the cathodic peak did not result in formation of any solid phase on the electrode and the electrode underwent no noticeable changes.
-0.4 0.0 0.4
-12 -6 0 6 12
R1
О1 I, mA
[image:7.596.151.460.141.388.2]E, V
Figure 2. Cyclic voltammogram of the CsCl–CrCl3 melt. Concentration of CrCl3=0.042 mmol cm-3, T = 973 K. The potential sweep rates (V s-1): 1.0 (inner curve); 1.2; 1.4; 1.6; 1.8; 2.0 (outer curve). Electrode area: 0.698 cm2. Quasi-reference electrode: glassy carbon.
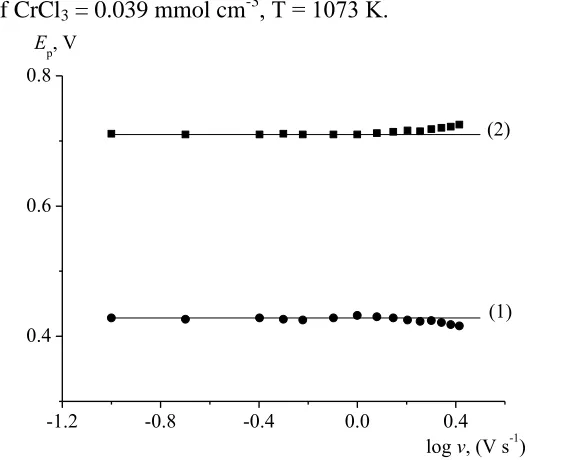
According to the cyclic voltammetry theory [37], the electrode process is controlled by the diffusion rate up to the polarization rate of v = 1.0 V s-1 resulting in formation of a product soluble in the melt. At v > 1.0 V s-1, a deviation of the experimental points is observed from the straight line passing through the origin of coordinates, which evidences a transition from a reversible process to a quasi-reversible process. To prove the quasi- reversibility of the process at v > 1.0 V s-1, additional diagnostic criteria were used (Figure 4). A curvilinear dependence of the peak potential on log v (a linear dependence is characteristic of an irreversible process in the given coordinates) and also a higher difference between the potentials of the anodic and cathodic peaks as compared to the calculated value in the case of the reversible reaction point to quasi-reversibility of process (1).
RT nFv D
D D k
ox red ox s
/ ) (
) /
( 2
(3)
where α = 0.5 is the electrokinetic transfer coefficient.
The α=0.5 value was used in equation (3) because it is for this a value that in the original work [38] a relationship between the ψ function and ΔEp was established. Besides, for the ψ values, experimentally determined in this work, the ΔEp values are practically independent of α, if α =0.3 - 0.7 [39].
Figure 3. Dependence of the peak current on the potential sweep rate in the KCl–CrCl3 melt. Concentration of CrCl3 = 0.039 mmol cm-3, Т = 1073 K.
-1.2 -0.8 -0.4 0.0 0.4
0.4 0.6 0.8
Ep, V
[image:8.596.173.424.242.389.2]log v, (V s-1) (1) (2)
[image:8.596.163.453.431.661.2]
For determining of the standard constant of charge transfer rate, the data ΔEp and ψ cited in work [38] for the 298 K should be recalculated for the working temperature. Recalculation was made by using the following equations [40]:
T E
Eп) ( п)T298
( 298 (4)
298 298 T T
(5)
The values of function ΨT obtained according to equations (4) and (5) allowed calculating the standard rate constants of charge transfer for the Cr(III)/Cr(II) redox couple using dependence (3) and the values of diffusion coefficients of Cr(III) and Cr(II).
Dependences of the standard rate constants of charge transfer for alkali chlorides at different polarization rates on a glassy carbon electrode are presented in Fig. 5. The plots of the dependence of ks on the polarization rate show that ks do not change with increasing of v in the region of quasi-reversibility of the recharging process.
The ks values in molten KCl and CsCl we obtained (Figs. 5, 6) proved to be lower than the standard rate constants of charge transfer determined in [16, 17]. In our opinion, this is related to using the same working electrode for studying processes (1) and (2) in [16, 17]. As pointed out above, carbides are formed on a glassy carbon electrode under discharge of Cr(II) and surface “loosening” occurs as a result of the processes of their formation and dissolution. Herewith, the electrode roughness level may already be comparable to the double layer thickness. Besides, the deposition/dissolution processes caused formation a great number of “defects”. A strong interaction between the chromium complexes and electrode “defects” probably also resulted in an increase of ks, same as in [21]. This assumption concerning the effect of the electrode surface on ks was confirmed. Indeed, after the electrode treatment by formation/dissolution of carbides, ks for the Cr(III)/Cr(II) redox couple proved to be much higher than the data for the electrode that was not processed.
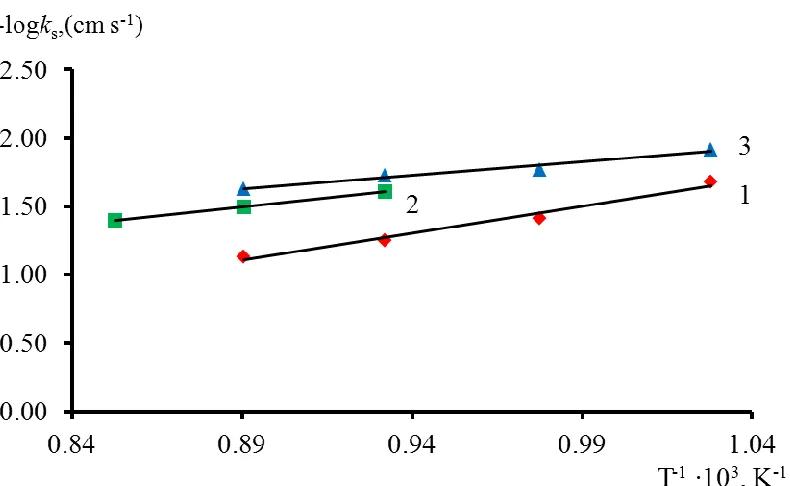
Figure 6 shows that the standard rate constants of charge transfer increase with increasing temperature and this is due to a decrease in the potential barrier height for electron transfer process [34].
As seen in Fig. 6, the following series of variation of the standard rate constants of charge transfer was found: ks (NaCl–KCl) > ks (KCl) > ks (CsCl).
According to the study of Matsuda-Ayabe [41], the electrochemical process is quasi-reversible, if:
10-2(1+α) < ks / (DnFv/RT)1/2 < 15 (6)
Figure 5. Dependences of the standard rate constants of charge transfer on the potential sweep rate: (1) – NaCl–KCl–CrCl3, concentration of CrCl3 = 0.039 mmol cm-3; (2) – KCl–CrCl3,concentration of CrCl3 = 0.037 mmol cm-3); (3) – CsCl–CrCl3, concentration of CrCl3 = 0.042 mmol cm-3; T = 1073 K.
Figure 6. Dependences of log ks vs. the inverse temperature. (1) – NaCl-KCl-CrCl3, concentration of CrCl3 = 0.039 mmol cm-3; (2) – KCl-CrCl3, concentration of CrCl3=0.037 mmol cm-3, (3) – CsCl-CrCl3, concentration of CrCl3 = 0.042 mmol cm-3; v = 2.0 V s-1.
3.2 Quantum-chemical calculations
[image:10.596.105.500.375.618.2]
Having the quantum–chemical estimate of the system reorganization energy values in the electron transfer process, one can further estimate electron transfer activation energies Еa according to the Marcus theory [42-44]:
Ea = (Es + ΔGr)2/4Es (7)
Here, a system means complex particles (M+)n[Cr(III)Cl6]3- or (M+)n[Cr(II)Cl6]4- together with their outer-sphere shell consisting of alkali cations; ΔGr – Gibbs energy of electron transfer model reaction, the reorganization energy Es in this case is the difference of the initial (M+)n[Cr(III)Cl6] 3-particle’s energies in the equilibrium geometry of the final particle (M+
)n[Cr(II)Cl6]4- and in its intrinsic equilibrium geometry. Chromium in such complexes is in a high-spin state: s = 3/2 for Cr(III) and s = 2 for Cr(II).
Let us first present the data characterizing the relative stability of particles with a different composition of the OS shell. Figure 7 shows the dependences of the energy of the outer-sphere shell formation Eos on its composition for particles (M+)n[Cr(III)Cl6]3- and (M+)n[Cr(II)Cl6]4- (M = Na, K, Cs). The Eos values were calculated according to the formula:
Eos = E{(M+)n[Cr(III)Cl6]3-} - E{[Cr(III)Cl6]3-} - nE(M+), (8)
where the compositions of particles for which the calculated energies were used are shown in brackets. Energies Eos for Cr(II)-particles are computed relative to the energy of the Cr(III) free complex as the free complex [Cr(II)Cl6]4- does not exist. As seen from Fig. 7, the maximum stability is characteristic of Cr(III)-particles at n = 5 for OS sodium and potassium cations and at n = 4 for cesium. The compositions closest by energy to the most stable particles are those with n = 4 for Na and K with the energies by 9 and 16 kJ mol-1 higher, accordingly. For cesium, the composition closest to the most stable one has n = 5 (the energy difference is 26 kJ mol-1).
Fig. 8 shows the particle structures for the most stable states of chromium (III) and the corresponding structures for chromium (II). As seen from this figure, considerable lengthening of one of the Cr–Cl bond occurs in the course of electron transfer, which reflects the Jahn–Teller effect, but no complete dissociation is observed. For control, calculations were performed in the systems of type
II, (M+)n[Cr(III)Cl6]3-+ 18 MCl and (M+)n[Cr(II)Cl6]4-+ 18 MCl (M = Na, K, Cs), where a distortion of complex chromium groups was also observed, though to a lesser degree, while the first coordination number remain equal to six.
Under the conditions of electrochemical experiment, the charge transfer occurs near the equilibrium state when the Gibbs energy of electron transfer (∆Gr) can be thought of as zero. As a result, the Marcus general formula (7) can be simplified [45]:
Ea = (Es + ΔGr)2/4Es ≈ Es/4 (9)
the MP2 method. Assuming that electroactive particles are the most thermodynamically stable ones, i.e., particles (Na+)5[CrCl6]3- – (K+)5[CrCl6]3- – (Cs+)4[CrCl6]3-, we have from Table 1 a monotonously changing series of activation energies: 39 (Na) – 46 (K) – 70 (Cs) kJ mol-1, which corresponds to the character of variation of experimental charge transfer rate constants. The same series was also obtained for Ea in the calculation using the MP2 method. The ratio of activation energies at n = 1, 2, 3, and 6 not only disagrees with the experimental value, but in a number of cases, their values even become negative, which explicitly points to incorrectness of calculation of activation energy at the given n values.
[image:12.596.92.513.222.436.2]
Figure 7. Energies of outer-sphere shell formation (Eos, kJ mol-1) against the number of outer-sphere cations for particles (a) (M+)n[Cr(III)Cl6]3-, (b) (M+)n[Cr(II)Cl6]4-: (1) Na, (2) K, (3) Cs.
At the same time, a lower activation energy value (47 kJ mol-1) is observed for the particles with an outer-sphere cesium cation at n = 5 as compared to n = 4. As the stability of Cs-particles with n = 5 (characterized by the Eos value) is not much lower than that for the most stable particles, a question arises, as to which of these particles is characterized by the highest electron transfer rate.
Table 1. Computed electron transfer activation energies (Ea, kJ mol-1) for the particles (M+)n[Cr(III)Cl6]3-
M+ Number of outer sphere cations (n)
1 2 3 4 5 6
Na 1 3 16 52 39 (40) 20
K -9 8 41 66 46 (55) -21
[image:12.596.117.482.647.729.2]
Here, one must take another consideration into account. The fact is that relative recharging potentials of particles (Cs+)4[CrCl6]3- and (Cs+)5[CrCl6]3- depend on the ratio of the energies of the corresponding recharging reactions: Cr(III)→Cr(II). If the potential corresponding to electron transfer per particle (Cs+)5[CrCl6]3- is much less negative (more positive), then the contribution of recharging of this particle may be predominant in the experiment, and not that of (Cs+)4[CrCl6]3-. This model system level obviously does not allow even a rough quantitative estimate of the ratio of recharging potentials, but the effect of this factor may be estimated at the qualitative level.
Table 2 presents the values of calculated energies En0 and standard potentials Eo (Eo =-0
n
E
/zF) for the recharging reaction:
(M+)n[Cr(III)Cl6]3- + e- → (M+)n[Cr(II)Cl6]4- || En0 , (10)
n n n
c n
n
C C RT zF
E
E0 0 ( ) ln (11)
Here En0 – electrochemical potential, c(n)– cathode potential, Cnand Cn – concentrations of the initial and final particles. As seen from this table, an increase in n results in a monotonous growth of the Eo value for all M, hence it follows particularly that the recharging process of the (Cs+)5[CrCl6] 3-particle as compared to the (Cs+)4[CrCl6]3- particle must start at more positive/less negative potentials. Unfortunately, in the case of this model system level, the differences between the Eo values for the neighboring n are much overstated, so that this assumption is only a qualitative characteristic. In this case, the activation energy values cannot be calculated anymore according to the simplified Marcus formula (9), assuming the ΔGr value equal to zero, as the rates of recharging of two different particles in the same process are compared. It is necessary to introduce the dependence on cathode potential ϕ in an explicit form to the ΔGr value and to use the obtained relation at a deduction of the equation for the ratio of recharge rates of particles with different OS compositions.
a b
[image:14.596.85.524.67.410.2]
e f
Figure 8. Structure of initial particles (M+)n[Cr(III)Cl6]3- (a, c, e) and final particles (M+)n[Cr(II)Cl6] 4-(b, d, f): n=5 for M – Na (a, b) and K (c, d); n=4 for M – Cs (e, f)
The given level of model specificity of quantum chemical calculations requires the use of the thermodynamics of a separate electrode process, which has some features. Such analysis was made in our previous work [46].
Table 2. Calculated energies En0 (kJ mol-1) and standard potentials Eo (V) of recharging of Cr(III) → Cr(II) for reaction (10) (M = Na, K, Cs)
n ΔEn Eo
Na K Cs Na K Cs
1 332.4 294.5 243.6 -3.44 -3.05 -2.52 2 -9.2 33.0 127.3 0.10 -0.34 -1.32 3 -382.6 -232.2 -197.4 3.96 2.41 2.04 4 -599.2 -395.3 -304.2 6.21 4.10 3.15 5 -884.9 -658.1 -567.8 9.17 6.82 5.88 6 -1223.4 -1162.5 -812.6 12.68 12.05 8.42
concentration of electroactive particles and use the following, rather obvious relationships for the electron transfer rate of reaction (10) v(n):
E n RT
C n k C n k n v nv( ) ( ) ( ) n 0( ) nexp a( ) (12)
where k+(n), Ea(n)are, accordingly, the electron transfer rate constant and the activation energy of charge transfer for the forward process. Then, we have for the ratio of electron transfer rates for two particles with n=p and n=q:
E q E p RT
C p k C q k p v q v a a p q ) ( ) ( exp ) ( ) ( ) ( ) ( 0
0
(13)
According to Marcus theory, activation energy of charge transfer for the forward and reverse processes can be calculated by the following expressions:
) ( 4 ) ( ) ( 2 n E E n E n E s n s a (14)
) ( 4 ) ( ) ( 2 n E E n E n E s n s a ( 15)where Es(n) and Es(n) are reorganization energies of forward and reverse processes.
Based on [46], we write the necessary relations for the two cases when a cathode potential is equal to an equilibrium potential of recharging c(n) 1) p-particles, that isc c(p), or 2) q-particles with c c(q), where
E n E n
zFEn s s
n c ) ( ) ( 4 1 0 ) ( (16)
Table 3 presents the results of calculation of the ratio of recharging rates v(5) v(4) for particles (M+)4[CrCl6]3- and (M+)5[CrCl6]3- at the equilibrium values of the potentials of these particles c(4) andc(5) , respectively. The final value of the activation energy Ea was calculated by expression (9) using the average reorganization energy based on the expression in [47]:
2
Table 3. Comparative characteristics of the (M+)4[CrCl6]3- and (M+)5[CrCl6]3- particles' recharge at their equilibrium values of the potential c(4) and c(5), respectively
М n
a
E Ea Ea v(5) v(4)
Na 4 52 51 52 2.48∙104
(c(4) ) 5.19∙104
( (5) c ) 5 38 29 33
K 4 66 29 42 1.79∙105
(c(4) ) 1.27∙106 ( (5)
c ) 5 46 31 37
Cs 4 70 23 38 8.76∙105
( (4) c ) 2.16∙106
(c(5) ) 5 47 31 38
As follows from this table (columnv(5) v(4)), the contribution of recharging of (M+)5[CrCl6] 3-particles is predominant at all temperatures in the range of potentials from φ = (5)
c
to φ = (4) c
, despite the lower stability of these particles (lower value of Eos). Therefore, the determined activation energies must also correspond to recharging of these particles. For this variant, we have the following ratio of the average activation energies Ea: Na : K : Cs = 33 : 37 : 38 (kJ mol-1), which reflects more exactly the experimentally observed closeness of the Ea values for the K and Cs systems.
In conclusion, let us return once more to Table 2. One can see that recharging at a given composition of particles occurs most easily in the case of Na particles; K particles follow, and then Cs particles (to the exclusion of compositions at n = 1). This regularity corresponds to the experimental data [18]. It is of interest that the energy of outer sphere shell formation Eos (Fig. 7) decreases in the same series: from Na particles to Cs particles. In other words, Na particles with stronger bonds are more easily recharged as compared to K and Cs particles. There is nothing strange about that, as the recharging potential is determined not by the stability of particles as such, but by the value of energy
0 n
E
characterizing the recharging reaction (10). The value of this energy is determined by the difference in the energies of the initial and final particles.
In the case of qualitative consideration, the concept of outer sphere cations with regards to their effect on the bonds between the complex central ion and ligands of the first coordination shell is often used. It is assumed here that the more polarizing cation, Na+, produces in this case a more weakening (counter-polarizing) effect on these bonds and, accordingly, the stability of the complex consisting of only the central ion and ligands in a Na+ environment is lowest. It is easy to see that this approach leads to the same conclusions as the En0 energy series.
4. CONCLUSIONS
following series of the standard rate constants of charge transfer: ks (NaCl–KCl) > ks (KCl) > ks (CsCl) was obtained by cyclic voltammetry. It was shown that charge transfer between the complexes of Cr(III) and Cr(II) occurs quasi-reversibly. The calculations carried out using the Firefly quantum– chemical software by means of the DFT method showed that the values of the charge transfer activation energy change monotonously in the series of Na–K–Cs in accordance with the ratio of reorganization energies. In its turn, this leads to monotonous variation of the charge transfer rate constants.
ACKNOWLEDGMENTS
The work was financially supported by the Russian Foundation for Basic Research (project 11-03-00280-a).
References
1. S. A. Kuznetsov, Russ. J. Appl. Chem., 72 (1999) 1804
2. S. N. Shkol’nikov, PhD thesis. Leningrad Polytechnic Institute. Leningrad (1966) 3. M. Volkov, PhD thesis. Leningrad Polytechnic Institute. Leningrad (1970)
4. V. G. Gopienko, PhD thesis. Leningrad Polytechnic Institute. Leningrad (1970) 5. S. A. Kuznetsov, and P.T. Stangrit, Rasplavy, 4 (1990) 100
6. S. A. Kuznetsov, and P.T. Stangrit, Rasplavy, 4 (1990) 44
7. E. B. Freidina, PhD thesis. Saint-Petersburg State Technical University. Saint-Petersburg (1997) 8. S. A. Kuznetsov, High Temp. Mat. Proc., 5 (2001) 583
9. S. A. Kuznetsov and M. Gaune-Escard, Electrochim. Acta, 46 (2001) 1101
10. S. A. Kuznetsov, L. Rycerz and M. Gaune-Escard, Z. Naturforsch., A: Phys. Sci., 56a (2001) 741 11. S. A. Kuznetsov and M. Gaune-Escard, Z. Naturforsch., A: Phys. Sci., 57a (2002) 57
12. S. A. Kuznetsov and M. Gaune-Escard, J. Electroanal. Chem., 595, (2006) 11
13. S. A. Kuznetsov, and M. Gaune-Escard, Proc.VII Intern. Symp. on Molten Salts, Chemistry and Technology. Toulouse: Univ. P. Sabatier, 2 (2005) 855
14. V. Popova, and S. A. Kuznetsov, Russ. J. Electrochem., 44 (2008) 921
15. V. Popova, V. G. Kremenetskii, V. V. Solov’ev, L. A. Chernenko, O. V. Kremenetskaya, A. D. Fofanov and S.A. Kuznetsov, Russ. J. Electrochem., 46 (2010) 671
16. R. Elizarova, Russ. J. Electrochem., 45 (2009) 870 17. R. Elizarova, Russ. J. Inorg. Chem., 54 (2009) 1804
18. P. J. Tumidajski and S. N. Flengas, J Electrochem. Soc., 138 (1991) 1659 19. M. Potapov, PhD thesis. IHTE URO RAN. Sverdlovsk, (1991)
20. Yu. V. Stulov and S. A. Kuznetsov, Rasplavy, 24 26 (2010) 21. Ding, W. Sai, and Q. Wang, Russ. J. Electrochem., 46 (2010) 180 22. R. Elizarova, Russ. J. Electrochem., 45 (2009) 862
23. G. J. Janz, and N. P. Bansal, J. Phys. Chem. Data, 11 (1982) 505
24. V. E. Komarov, N. P. Borodina, and I. A. Pakhnutov, Russ. J. Electrochem., 22 (1986) 478 25. V. I. Shapoval, V. V. Solov’ev, E. D. Lavrinenko-Ometsinskaya and Kh. B. Kushkhov, Ukr.
Khim. Zh., 50(9) (1984) 917
26. F. Bouyer and G. S. Picard, AIP Conf. Proc, 364 (1996) 532
27. V. Voit, E. I. Voit and V. I. Sergienko, Zh. Strukt. Khim., 40 (1999) 1037
31. V. G. Kremenetsky, S. A. Kuznetsov, V. V. Solov’ev, L. A. Chernenko, O. V. Kremenetskaya and A. D. Fofanov, Z. Naturforsch, A: Phys. Sci., 65a (2010) 1020
32. V. G. Kremenetsky, O. V. Kremenetskaya, A. D. Fofanov, Rus. Metallurgy (Metally), 8 (2011) 748
33. S. A. Kuznetsov, V. G. Kremenetsky, A. V. Popova, O.V. Kremenetskaya and V. T. Kalinnikov, Doklady Physical Chemistry, 428 (2009) 209
34. Krishtalik, Elektrodnye reaktsii. Mekhanizm elementarnogo akta (Electrode Reactions. Mechanism of Elementary Act), Moscow: Nauka, (1982)
35. Alex A. Granovsky, Firefly, http://classic.chem.msu.su/gran/firefly/index.html 36. W. Schmidt, K. K. Baldridge, J. A. Boatz et al, J. Comput.Chem., 14 (1993) 1347 37. R. S. Nicholson, and I. Shain, Anal. Chem., 36 (1964) 706
38. R. S. Nicholson, Anal. Chem., 37 (1965) 1351
39. Z. Galus, Fundamentals of Electrochemical Analysis, Ellis Horwood, London (1994)
40. S. A. Kuznetsov, S. V. Kuznetsova, and A. L. Glagolevskaya, Russ. J. Electrochem., 32 (1996) 981
41. H. Matsuda, and Y. Ayabe, Z. Elektrochem., 59 (1955) 494 42. R. A. Marcus, J. Chem. Phys., 24 (1956) 966
43. R. A. Marcus, Ann. Rev. Phys. Chem., 15 (1964) 155 44. R. A. Marcus, J. Chem. Phys., 43 (1965) 679
45. V. A. Seredyuk and V.F. Vargalyuk, Russ. J. Electrochem., 44 (2008) 1105
46. Yu. V. Stulov, V. G. Kremenetsky, S. A. Kuznetsov, ECS Transactions, 50 (2012) 135 47. R. R. Nazmutdinov, Russ. J. Electrochem., 38 (2002) 111

![Table 1. Computed electron transfer activation energies (Ea, kJ mol-1) for the particles (M+)n[Cr(III)Cl6]3-](https://thumb-us.123doks.com/thumbv2/123dok_us/1912354.149848/12.596.92.513.222.436/table-computed-electron-transfer-activation-energies-particles-iii.webp)
![Figure 8. Structure of initial particles (M)n[Cr(III)Cl6] (a, c, e) and final particles (M(b, d, f): n=5 for M – Na (a, b) and K (c, d); n=4 for M – Cs (e, f)](https://thumb-us.123doks.com/thumbv2/123dok_us/1912354.149848/14.596.85.524.67.410/figure-structure-initial-particles-iii-final-particles-na.webp)