Int. J. Electrochem. Sci., 7 (2012) 5581 - 5595
International Journal of
ELECTROCHEMICAL
SCIENCE
www.electrochemsci.org
High Pressure Solidification: An Effective Approach to Improve
the Corrosion Properties of Mg-Y Based Implants
Qiuming Peng*, Shuangshuang Zhao, Hui Li, Ning Ma, Xuejun Li, Yongjun Tian
State Key Laboratory of Metastable Materials Science and Technology, Yanshan University, Qinhuangdao, 066004, P.R China.
*
E-mail: [email protected]
Received: 22 April 2012 / Accepted: 14 May 2012 / Published: 1 June 2012
High pressure technology was employed to improve the corrosion properties of Mg-Y based alloys. The microstructures, corrosion rate and corrosion mechanisms were investigated. The results revealed the yttrium concentration in magnesium matrix was increased and the secondary dendrite arm spacing was reduced as the temperature of high pressure was increased. The corrosion performances in both simulated body fluid and Hank’s solution were evaluated by the immersion and electrochemical tests. Remarkably difference in the electrochemical impedance spectroscopy was encountered between as-cast and high pressure samples. Compared with the as-as-cast specimen with a simple inductive loop in high frequency region, the high pressure samples mostly consist of both a capacitive loop and an inductive loop. The improvement of corrosion properties was mainly associated with the continuous secondary dendrite boundaries and the accumulated oxide film on the surface. It was demonstrated that the high pressure solidification was an effective method to improve the corrosion properties of Mg based degradation implants.
Keywords: Corrosion properties; Electrochemical impedance spectroscopy; Weight loss; High pressure
1. INTRODUCTION
problem as orthopedic biomaterials. Therefore, to develop new alloy has become an urgent issue for the application of Mg based implants. Recently, it has been reported that hydrogen evolution has hardly observed during the degradation process in MgZnCa glasses implants, which provided a new method to develop biodegradable implants [9]. Thereafter, it was found that the Mg-6wt.%Zn alloy exhibited suitable mechanical strength, good biocompatibility and moderate corrosion rate [10]. In addition, the effects of Ca element on the bio-degradation behaviour and cyto-compatibility of Mg have been studied, and it was suggested that Mg-1wt.% Ca alloy was one of the promising orthopedic biodegradable materials [11]. More attractively, the binary Mg-RE (RE: rare earth element) alloys were introduced as the novel biomaterials for fine implants or degradation stents in terms of the toxicity and strength [12]. It is believed that these novel alloys offer high mechanical strength by suitable structural design[13].
However, the high corrosion rate still remains a bottleneck to impede the application of Mg based biomaterials. Generally, the coating, such as micro-arc oxidation[14], hydroxyapatite [15], acid treatment [16] and the composite layer[17], have been performed to improve the corrosion properties. On the one hand, these coatings increase the potential toxicity owing to the released other ions. More cyto-compatibility experiments should be added before the clinic test. On the other hand, the corrosion rate is out of control because the corrosion rate is accelerated as soon as the coatings have been destroyed. Therefore, it is very stimulating to improve the corrosion properties of the implants by means of other methods.
High pressure (especial higher than 5 GPa) has been confirmed as an important technology to prepare some new materials, such as diamond [18], B-N-C [19] etc. Up to now, several researchers have focused on the effects of the pressure on the microstructure and phase transition of Al-based and Cu-based alloys [20, 21]. Schilling [22] reported that high pressure can refine the microstructures of Al-based materials by promoting the formation of nucleus. Wang et al [23] found the glass forming ability of the alloy can be enhanced by high pressure. In the present work, high pressure technology is performed to improve the corrosion properties of Mg-Y based biomaterial, which could offer outstanding mechanical strength in combination of high biocompatibility.
2. MATERIALS AND METHODS 2.1 Materials preparation
Mg-7Y-0.5Zn alloy (wt.%, all compositions given thereafter in wt.%) was prepared by zone solidification purifying method. This method was specially developed to prepare high pure Mg based biomaterials in our previous literature [24]. The alloys were prepared in a steel crucible protected by a mixture of CO2 and SF6. After mixing at 720 °C for 1 hour, the alloy was cast to the mold preheated at
diameter and 180 mm in length was obtained (named AC-Mg-Y). The chemical composition was studied by X-ray fluorescence spectroscopy, and the detailed composition was Mg-6.32Y-0.43Zn.
The ingot was machined into 30 mm in diameter and the gauge length of 8 mm for high pressure sintering (HP). The samples were wrapped with Ta foil, and then they were inserted into a pure BN crucible. The pressure and time were 6 GPa and 60 min, respectively. The sintering temperatures were 650℃(HP-650-Mg-Y), 750℃(HP-750-Mg-Y)and 850℃(HP-850-Mg-Y), respectively. The pressure of 6 GPa was added before increasing the temperature. The heating rate was 40 ℃/min. In the end of the HP process, samples were quenched to room temperature prior to releasing the applied pressure. Finally, the HP samples were then heated slowly (5 K/min) to 473 K and reserved at the temperature for 5 min to release the residual stress under Ar protection.
2.2 Microstructure and microhardness
The microstructural investigations were performed using optical microscopy (OM) and scanning electron microscopy (SEM). For SEM observation, the standard metallographic procedures were applied, including grinding, polishing and etching. The samples were etched in a picral solution to reveal grain boundaries. The secondary dendrite arm spacing (SDAS) were measured using the linear intercept method. The Y content in the matrix was investigated by SEM equipped with energy dispersive X-ray analysis. The microhardness test was carried out on the Vickers hardness tester, the test load and dwelling time were 100 g and 15 s, respectively. The hardness was measured on the surface perpendicular to the high pressure direction. The average value is obtained based on ten spots.
2.3 Corrosion properties 2.3.1 Immersion test
The corrosion rate was tested in simulated body fluid (SBF) and Hank’s solution at 37±2℃ (the ratio of surface area to solution volume was 100 mm2:20 ml). The composition of SBF is shown in previous literature [25]. Hank’s buffered salt solution was purchased from Gibco-invitrogen (Grand Island, USA). The diameter and the height of tested samples were 5 mm and 5 mm, respectively. The tested time was two weeks. The corrosion reaction of Mg-based alloys was calculated by the following chemical equation [26]:
2
H
2O
Mg
(
OH
)
2H
2Mg
(1)
ACR =(K×W)/(A×t×D) (2)
where the coefficient K=8.76×10⁵
, W is the weight loss (g), A is the sample area exposed to solution (mm2), t is the exposure time (h) and D is the density of the material (g mm–3). Five samples have been performed to calculate the average result and the standard deviation.
2.3.2 Corrosion rate by Tafel measurement
Electrochemical tests were carried out using a Bio-logic VSP potentiostat/frequency response analysis system to evaluate the corrosion behaviors of the specimens at 37±2℃. A saturated Ag/AgCl (saturated with KCl) was used as the reference electrode. A platinum mesh and the investigated specimen were used as the counter electrode and the working electrode (3.96 mm2 exposed area), respectively. The electrochemical tests were conducted in both SBF and Hank’s solutions at a scan rate of 0.25 mV/s. The polarization curves were used to estimate the corrosion and pitting potentials (Ecorr,
Epp), and corrosion current density (Icorr) at corrosion potential (Ecorr) by the Tafel extrapolation of the
cathodic branch. Four samples have been performed to obtain the average result and the standard deviation. The Icorr, is related to the ACR (mm/y) using the conversion equation [28]:
ACR=22.85 Icorr. (3)
2.3.3 Electrochemical impedance spectroscopy
The instrument and three electrodes were the same as the above electrochemical test. Electrochemical impedance spectroscopy (EIS) studies were performed at open circuit potential with the amplitude of 10 mV over the frequency range of 10.000-0.1Hz on specimens exposed to the corrosive electrolyte for different durations viz., 2, 4, 6, 8 and 12 h to investigate the corrosion mechanism. All the tests were performed at 37±2℃ with stirring in the bottom, and the tests were performed in triplicate to ascertain reproducibility.
3. RESULTS AND DISCUSSION 3.1 Microstructural characterization
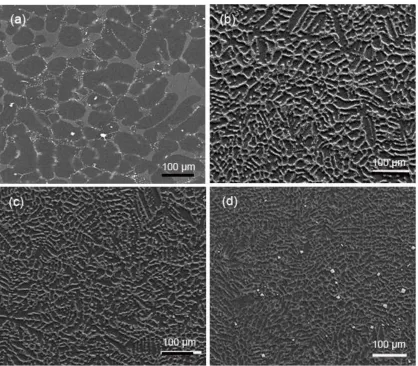
Fig. 1 shows the microstructures of different state Mg-Y based alloys. It can be seen that four samples are mainly composed of the dendrites, precipitate and the matrix. The river-shaped eutectic phase is mostly segregated along the dendrite boundaries in the AC-Mg-Y sample. According to previous results [29, 30], the white river-shaped precipitate is ascribed to Mg24Y5 compound.
Figure 1. SEM micrographs of the different state Mg-Y alloys, (a) AC-Mg-Y; (b) HP-650-Mg-Y; (c) HP-750-Mg-Y; (d) HP-850-Mg-Y.
B
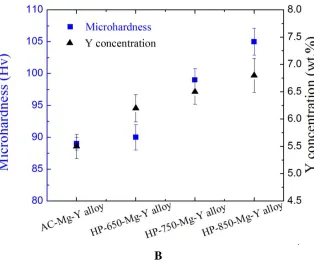
Figure 2. (A) SDAS of the different state Mg-Y alloys; (B) microhardness and Y concentration in matrix of the different state Mg-Y alloys.
The SDAS value of as-cast sample is 118 μm, which is about five times as high as that of the HP-850-Mg-Y specimen. Both solid solution Y concentration and microhardness dependence of the HP temperature are also shown Fig. 2b. It is shown that Y concentration in the matrix is enhanced with the increased temperature. The maximum Y content is 6.8 wt.% in the HP-850 sample, which is 1.24 times as high as that in as-cast one. At the same time, as the HP-temperature is increased, the corresponding microhardness is also improved.
3.2 Corrosion properties
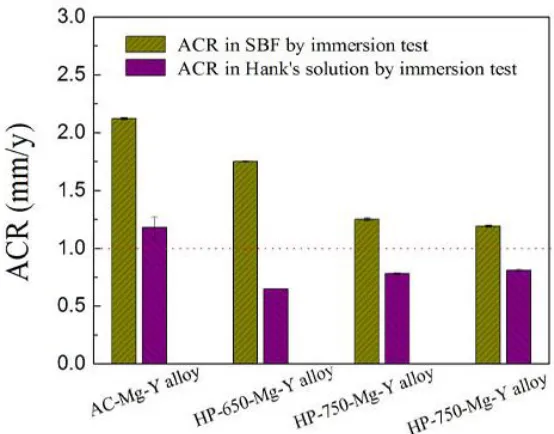
The ACR of the samples immersed in both SBF solution and Hank’s solution was studied by use of weight loss. In general, compared with the as-cast sample, the ACR is decreased after high pressure treatment (Fig. 3).
[image:6.596.140.454.74.337.2]
Figure 3. ACR of the different state Mg-Y alloys in both SBF and Hank’s solutions calculated by weight loss.
Table 1. Electrochemical parameters of the samples derived from polarization tests in the SBF (standard deviation).
Alloys Ecorr (mV) Icorr (mA/mm2) Epp (mV) ACR(mm/y)
AC-Mg-Y -1607±71 8.19±0.21 ×10⁻⁴ -1194±61 2.02±0.05
HP-650-Mg-Y -1549±52 6.02±0.11 ×10⁻⁴ -1215±25 1.37±0.03
HP-750-Mg-Y -1508±45 5.35±0.11 ×10⁻⁴ -1145±21 1.22±0.03
HP-850-Mg-Y -1459±52 3.60±0.03 ×10⁻⁴ -1250±42 0.81±0.01
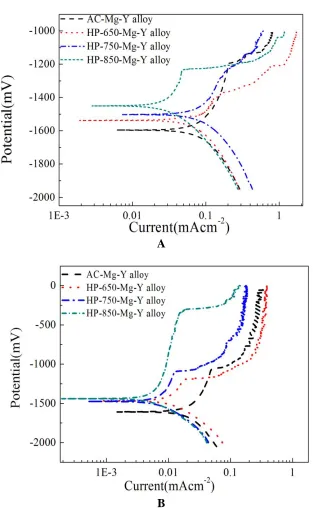
The Tafel curves of different alloys in SBF at 37 ℃ are shown in Fig. 4a. The detailed values obtained from the Tafel curves are summarized in Table 1. The polarization curves shift toward positive direction as the high pressure temperatures are increased, and the Ecorr is improved
monotonically.
For instance, the Ecorr of the AC-Mg-Y alloy is -1607 mV (Ag/AgCl), and it changes to -1459
mV(Ag/AgCl) in the HP-850-Mg-Y alloy. In addition, the Icorr is reduced with the increment of
HP-temperature. The maximum Icorr of the AC-Mg-Y alloy is 8.19 ×10⁻⁴ mA/mm2, which is 2.28 times as
high as that of the HP-850-Mg-Y alloy. The obvious passivation potentials are observed in four specimens.
Moreover, the passivation plateau (the passive potential region, ∆E=Epp−Ecorr) is also shortened
[image:7.596.155.432.80.297.2] [image:7.596.53.548.416.494.2]
Table 2. Electrochemical parameters of the samples derived from polarization tests in Hank’s solution (standard deviation).
Alloys Ecorr (mV) I corr (mA/mm2) EPP (mV) ACR(mm/y) AC-Mg-Y -1600±82 2.6±0.02 ×10⁻⁴ -1061±11 0.60±0.02 HP-650-Mg-Y -1471±52 1.1±0.02 ×10⁻⁴ -1208±21 0.25±0.02 HP-750-Mg-Y -1470±20 7.9±0.01 ×10⁻⁵ -1113±52 0.18±0.01 HP-850-Mg-Y -1466±80 6.9±0.01 ×10⁻⁵ -350±12 0.16±0.01
A
B
[image:8.596.137.450.210.725.2]
Fig. 4b shows the Tafel curves of different alloys in Hank’s solution at 37 ℃. The detailed values deduced from the polarization curves are listed in Table 2. The same trend that the polarization curves alter toward positive direction is detected with the increment of high pressure temperature. Meanwhile, the Icorr is reduced with the increment of high pressure temperature. Additionally, all four
samples reveal the passivation behaviour. However, compared with the results in the SBF, there are several different aspects as following. Firstly, the similar Ecorr of -1470 mV is observed in Hank’s
solution after high pressure treatment. Secondly, the lower Icorr is detected in contrast to the
corresponding one in SBF, which is in agreement with above immersion results. Finally, the “V-shaped” trend of passivation plateau is confirmed in Hank’s solution. Namely, the minimum value of 270 mV is observed in the HP-650-Mg-Y alloy.
3.3 Electrochemical impedance spectroscopy
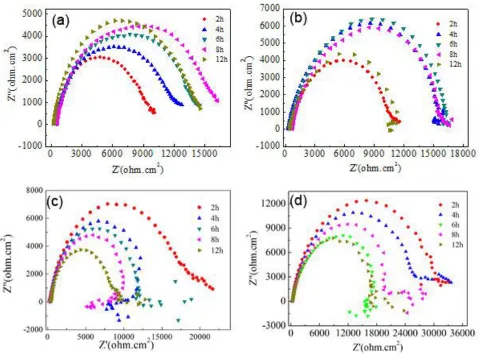
The Nyquist plots for the studied alloys after immersion in SBF solution for several times up to 12 hours are shown in Fig. 5.
[image:9.596.60.539.356.710.2]
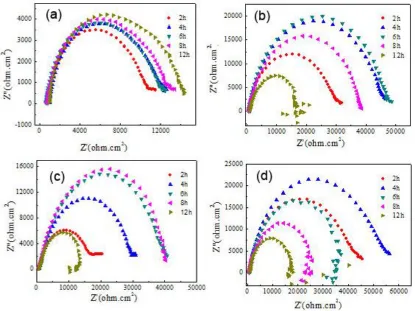
Figure 6. EIS curves in Hank’s solution after different immersion time, (a) AC-Mg-Y; (b) HP-650-Mg-Y; (c) HP-750-HP-650-Mg-Y; (d) HP-850-Mg-Y.
For the AC-Mg-Y alloy, an inductive loop in high frequency (HF) region for all the immersion times is observed, which indicating that this corrosion layer was not very protective. On the contrary, for other high pressure samples, it is mainly characterized by a capacitive loop at high and medium frequencies (HF and MF) and an inductive loop in the low-frequency (LF) region (Fig. 4b-4d).
In addition, the effects of the immersion time in Hank’s solution on the Nyquist plots of the studied alloys are shown in Fig. 6. Similarly, an inductive loop in HF region during the whole immersion time is observed in the AC-Mg-Y alloy. However, the EIS is mainly composed of a capacitive loop (HF and MF) and an inductive loop in the LF region for high pressure samples. Furthermore, with increasing the immersion time, the inductive loop in the LF region is more obvious (Fig. 5d).
4. DISCUSSION
[image:10.596.78.493.74.385.2]
of solid solution concentration (c-1/2)[32]. Namely, the solid solution strengthening increases strength of the material by increasing critical resolved shear stress to dislocation movement. Simultaneously, as solid solution of Y element is increased, the fraction of coarse second eutectic phase is reduced, which will effectively eliminated the stress concentration. The similar results have been also observed in Al alloys and Cu alloys [20, 22]. Secondly, the super high pressure shortens the space between the atoms and decreases the diffusion coefficient, and restrains the growth of the grain. The solidification of metals under super-high pressure can result in fine and non-equilibrium microstructures owing to the high super-cooling. The high pressure can cause crystal lattice distortion and a good deal of dislocation in grains, resulting in more nucleation sites being provided. Thus, some nano-grained structure and metallic glass have been prepared under high pressure [23, 33]. The homogeneous microstructure is attributed to the increment of mechanical properties. Thirdly, the high pressure can effectively reduce the porosity and increase the density of the alloys. It is elucidated that the defects and gases can be significantly eliminated during the solidification. The microstructure is more compact, and the microhardness is higher [21].
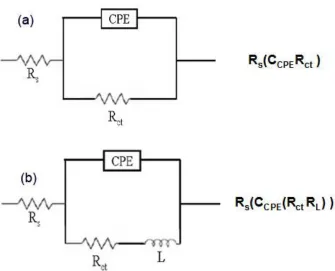
Figure 7. Fitting equivalent circuits in both SBF and Hank’s solutions, (a) AC-Mg-Y alloy; (b) HP- 850-Mg-Y alloy.
[image:11.596.145.480.334.605.2]
to formation of a corrosion layer. Two equivalent circuits are shown in Fig. 7. For the AC-Mg-Y alloy (Fig. 7a), the fitting Nyquist plots can be represented as Rs(CCPERct). On the contrary, for another
HP-850-Mg-Y sample (Fig. 7b), the fitting Nyquist plots is characterized as Rs(CCPE(Rct RL), where CCPE
and RL standa constant phase element (CPE) and an inductance (L), Rs and Rct are solution resistance
and charge transfer resistance, respectively. Meanwhile, Rct includes both the cathodic and anodic
resistance. CPE was used instead of a pure capacitance due to non-uniform distribution of the surface reaction.
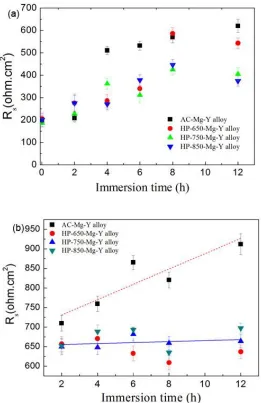
Figure 8. Rs dependence of different immersion time, (a) in SBF solution; (b) in Hank’s solution.
The Rs dependence of the immersion time in both SBF and Hands solution is shown in Fig. 8. It
can be seen that the fluctuation of Rs in the SBF is decreased after high pressure treatment. Namely,
the AC-Mg-Y alloy shows the largest ∆Rs of 410 ohmin the SBF solution. This trend is more obvious
that the largest ∆Rs of the AC-Mg-Y alloy is 190 ohm in Hank’s solution. Nevertheless, the constant
[image:12.596.154.415.220.623.2]
It is indicated that the majority of corrosion products are mostly dissolved in the SBF for the AC-Mg-Y alloy. The decomposed products are accumulated on the surface, which hardly affect the resistance of solution.
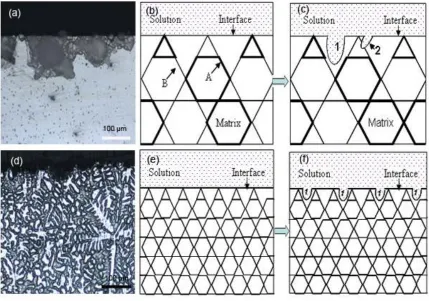
The morphologies after immersion in the SBF and schematic diagrams of different corrosion mechanisms are shown in Fig. 9.
Figure 9. Morphologies after immersion in SBF for 2 days and corrosion mechanisms of the different state Mg-Y alloys, (a)-(c) AC-Mg-Y; (d)-(f) HP-850-Mg-Y.
[image:13.596.80.509.183.484.2]
fraction of second Mg24Y5 precipitate recently. Davenport et.al. [35] revealed that the heat treatment
and the redistribution of the Y-rich regions in WE43 can improve corrosion resistance. Yao et.al. [36] reported that the alloying of Mg with RE elements allowed the RE elements to be incorporated into the passive film, which can impede corrosion. Those results also demonstrated that the high cooling rate and fine and well-distributed second phase are of benefit to improve the corrosion properties of Mg-RE alloys.
In addition, the value measured by immersion test is higher than that calculated by the Tafel curve. It is mainly because that the irregular pits formed readily at the beginning of corrosion. These pits act differently comparatively to those formed on the Al alloys [37]. They spread laterally covering the entire surface instead of the growth of the depth. As a result, it provokes the undermining of grain. When enough mass has been lost around them, the particles would fall away. Therefore, the falling particles during corrosion are overestimated compared with that calculated from Tafel curve [38].
5. CONCLUSIONS
High pressure technology was introduced to improve the corrosion properties of Mg-Y based biomaterials. On the base of microstructure, corrosion rate and corrosion mechanisms of the alloys, the following conclusions can be drawn:
The secondary dendrite arm spacing is decreased greatly after high pressure solidification.
The microhardness is improved owing to the solid solution strengthening, homogeneous non-equilibrium microstructure and the reduction of defects.
The improvement of corrosion properties of high pressure samples is mostly associated with the continuous dendrite boundaries and the formation of oxide layer on the surface.
Compared with the results calculated from Tafel curve, the higher corrosion rate is observed by immersion test owing to the isolated particles during the corrosion process.
ACKNOWLEDGEMENTS
This research is financially supported by National Natural Science Foundation of China (Grant Numbers: 51101142 and 51121061). The authors thank Dr. Hanwu Dong and Dr. Xiuli Hou for stimulating discussion.
References
1. X. Gu, W. Zhou, Y. Zheng, Y. Cheng, S. Wei, S. Zhong, T. Xi and L. Chen, Acta Biomater., 6 (2010) 4605.
2. F. Witte, J. Fischer, F. Beckmann, M. Störmer and N. Hort, Scripta Mater., 58 (2008) 453. 3. R. Zeng, W. Dietzel, F. Witte, N. Hort and C. Blawert, Adv. Eng. Mater., 10 (2008) B3.
4. F. Witte, J. Fischer, J. Nellesen, C. Vogt, J. Vogt, T. Donath and F. Beckmann, Acta Biomater., 6 (2010) 1792.
6. G. Song, Adv. Eng. Mater., 7 (2005) 563.
7. R. Beals, C. Tissington, X. Zhang, K. Kainer, J. Petrillo, M. Verbrugge and M. Pekguleryuz, J. Miner. Met. Mater. Soc., 59 (2007) 39.
8. A. Luo, J. Miner. Met. Mater. Soc., 54 (2002) 42.
9. B. Zberg, P. Uggowitzer and J. Löffler, Nature Mater., 8(2009) 887
10. S. Zhang, X. Zhang, C. Zhao, J. Li, Y. Song, C. Xie, H. Tao, Y. Zhang, Y. He, Y. Jiang and Y. Bian, Acta Biomater., 6 (2010) 626.
11. X. Gu, N. Li, W. Zhou, Y. Zheng, X. Zhao, Q. Cai and L. Ruan, Acta Biomater., 7 (2011) 1880. 12. N. Hort, Y. Huang, D. Fechner, M. Störmer, C. Blawert, F. Witte, C. Vogt, H. Drücker, R.
Willumeit, K.U. Kainer and F. Feyerabend, Acta Biomater., 6 (2010) 1714.
13. D. Gastaldi, V. Sassi, L. Petrini, M. Vedani, S. Trasatti and F. Migliavacca, J. Mech. Behav. Biomed. Mater., 4 (2011) 352.
14. L. Zhao, C. Cui, Q. Wang and S. Bu, Corros. Sci., 52 (2010) 2228.
15. J. Li, Y. Song, S. Zhang, C. Zhao, F. Zhang, X. Zhang, L. Cao, Q. Fan and T. Tang, Biomaterials, 31 (2010) 5782.
16. A. Witte, E. De Maeyer and R. Verbeeck, Biomaterials, 24 (2003) 1995. 17. H. Duan, K. Du, C. Yan and F. Wang, Electrochim. Acta, 51 (2006) 2898. 18. G. Demazeau, Diamond Rel.Mater., 4 (1995) 284.
19. S. Nakano, M. Akaishi, T. Sasaki and S. Yamaoka, Chem. Mater., 6 (1994) 2246. 20. R. Xu, Mater. Lett., 59 (2005) 2818.
21. J. Zhao, L. Liu, J. Yang, G. Peng, J. Liu, R. Zhang and G. Xing, Rare Met., 27 (2008) 541. 22. J. Schilling, J. Phy. Chem. Sol., 59 (1998) 553.
23. W. Wang, P. Wen, D. Zhao, M. Pan, T. Okada and W.Utisumi, App. Phy. Lett., 83 (2003) 5202. 24. Q. Peng, Y. Huang, L. Zhou, N. Hort and K.U. Kainer, Biomaterials, 31 (2010) 398.
25. Q. Peng, X. Li, N. Ma, R. Liu and H. Zhang, J, Mech, Behav, Biomed. Mater., 10 (2012) 128. 26. G. Song and A. Atrens, Adv. Eng. Mater., 5 (2003) 837.
27. ASTM-G31-72, Standard practice for laboratory immersion corrosion testing of metals. In: Annual Book of ASTM Standards. Philadelphia, 2004.
28. M. Zhao, M. Liu, G. Song and A. Atrens, Corros. Sci., 50 (2008) 3168. 29. Q. Peng, J. Wang, Y. Wu and L. Wang, Mater. Sci. Eng. A, 433 (2006) 133.
30. A. Sudholz, K. Gusieva, X. Chen, B. Muddle, M. Gibson and N. Birbilis, Corros. Sci., 53 (2011) 2277.
31. M. Staiger, A. Pietak, J. Huadmai and G. Dias, Biomaterials, 27 (2006) 1728. 32. R. Arsenault, S. Patu and D. Esterling, Mater. Tran. A, 20A (1989) 1411.
33. B. Straumal, B. Baretzky, A. Mazilkin, F. Phillipp, O. Kogtenkova, M. Volkov and R. Valiev, Acta Mater., 52 (2004) 4469.
34. P. Miller, B. Shaw, R. Wendt and W. Moshier, Corros., 51 (1995) 922.
35. A. Davenport, C. Padovani, B. Connolly, N. Stevens, T. Beale, A. Groso and M. Stampanoni, Electrochem. Sol. Sta. Lett., 10 (2007) C5.
36. H. Yao, Y. Li and A. Wee, Electrochim. Acta, 48 (2003) 4197.
37. N. Birbilis, M. Easton, A. Sudholz, S. Zhu and M. Gibson, Corros. Sci., 51 (2009) 683. 38. S. Bender, J. Goellner, A. Heyn and E. Boese, Mater. Corros., 58 (2007) 977.