Int. J. Electrochem. Sci., 9 (2014) 618 - 632
International Journal of
ELECTROCHEMICAL
SCIENCE
www.electrochemsci.orgDevice for Testing the Performance of a Hydrogen Sensor
Modified from the Morris Prototype.
M.C. Ivan X. García Pérez, Dr. Jesús G. Godínez Salcedo, Dr. Jorge L. González Velázquez.
Instituto Politécnico Nacional, Departamento de Ingeniería Metalúrgica Escuela Superior de Ingeniería Química e Industrias Extractivas, México D. F. CP 07738
Teléfono 55 5729 6000, Ext. 54210 y 55274, Fax 55270
*
E-mail: [email protected] - [email protected] [email protected] Received: 29 May 2013 / Accepted: 30 October 2013 / Published: 8 December 2013
A hydrogen permeation sensor based on the Morris prototype was designed, constructed and tested in this work. The cylinder was changed from a disc shape to a parallelepiped shape to facilitate the adhesion of the Nafion membrane and to decrease the potential H leakage on the edges of the cylinder. To test the ability of the sensor to detect hydrogen permeation, a device was designed that comprised two interconnected cells operating simultaneously. This device detects the permeation of H by the sensor and the potential reduction of a passive film. The sensor was calibrated, and the calibration curve was shown to be consistent with the Nernst equation.
Keywords: hydrogen sensor, permeation, passive film, potential reduction, hydrogen induced cracking, pipeline, steel.
1. INTRODUCTION
Sour corrosion is a highly relevant technological issue that affects the vast infrastructure of the oil and natural gas industry, such as the process equipment in refineries, separator tanks and pipelines. Damage caused by sour corrosion is very costly due to the required inspection, repair and replacement for the steel components that suffer its effects.
HIC cracks are difficult to assess quantitatively.
HIC is an irreversible process that can propagate without an external load.
HIC can occur in a wide range of environmental conditions, even in steel made specifically for use in acidic conditions.
Other than blistering, HIC does not produce visible changes in the external surface of the components; therefore, it can appear without warning.
Because HIC results from the absorption of H, mechanical properties of steel including ductility and fracture toughness can be reduced.
An alternative method to estimate the magnitude of the damage caused by the absorption of H is to monitor the amount of H that infiltrates the walls of steel components during the transport, processing and storage of sour hydrocarbons. This method can be performed by installing electrochemical cells in the external walls of the steel components. The cells can act as sensors to detect and quantify the H that diffuses from the internal walls to the external walls.
1.1. Methods to monitor hydrogen in steel.
Currently, several electrochemical methods to monitor the concentration of H infiltrated in steel are reported in the literature. The sensors in these methods can be the amperometric type, similar to those proposed by Hay [1-2] and Christensen [3], which use an aqueous electrolyte and measure the equivalent number of H atoms that flow through the steel. They can also be of the potentiometric type, which use solid electrolytes and measure the equivalent hydrogen (H2) pressure in the specimen’s
surface using the Nernst [4-5] equation.
Potentiometric sensors, which use a solid electrolyte, are easier to install, operate and require less maintenance than amperometric sensors, which use an aqueous electrolyte. Several potentiometric sensor prototypes [6-13], such as the those disclosed by Childs et al. (1978), Howe et al. (1980), Lundsgard et al. (1982), Shoonman et al. (1982) and others by Lyon and Fray (1983), Eagles and Fray (1984), Lyon and Fray (1984) and Hultquist (1986) have been used in practical applications. Initially, these devices used a solid electrolyte of hydrogen uranyl phosphate because of the excellent performance and protonic conductivity at high ambient temperatures. As shown by Lyon and Fray and Eagles and Fray [11] and disclosed [5], sensors with reference electrodes comprised of WO3 have been
developed. [5]
A study of the sensor proposed by R. V. Kumar and D. J. Fray [14] showed that the voltage stability and reproducibility under long measurement periods was unsatisfactory due to the high diffusion rate of the H through the interface between the solid electrolyte and the cylinder used as the cell container. The stability of the voltage was found to improve by adding a special joint that prevented H2 from accessing the interface. Ultimately, Kumar and Fray [14] designed sensors using a
mixture of PbO2 y PbSO4 as reference electrodes. The advantage provided by the potentiometric solid
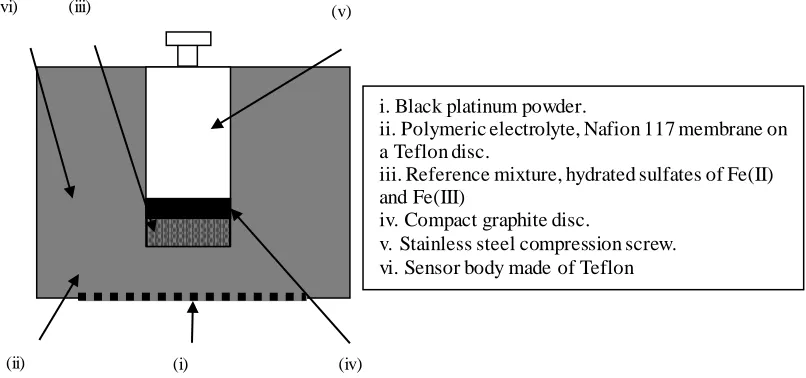
insulator. A commercial polymer known as Nafion has been tested in electrochemical cells, and it has advantages such as improved safety, ease of handling during the construction of the cell, good conductivity, a wide range of operating temperatures, high chemical resistance and high adherence to platinum. Its only disadvantage is the high cost potentiometric sensor developed by Morris [4-5] that uses a polymer membrane as the electrolyte is shown in Figure 1. This sensor, which can measure the equivalent pressure of the diffused H2 exiting a steel wall, is easy to install and handle in the field with
very low maintenance costs.
(iv) (i)
(ii)
(iii) (v)
(vi)
i. Black platinum powder.
ii. Polymeric electrolyte, Nafion 117 membrane on a Teflon disc.
iii. Reference mixture, hydrated sulfates of Fe(II) and Fe(III)
iv. Compact graphite disc.
[image:3.596.105.508.212.401.2]v. Stainless steel compression screw. vi. Sensor body made of Teflon
Figure 1. Schematic representation of the potentiometric sensor by Morris.
1.2. Fundamental electrochemistry of the Morris potentiometric sensor.
The Morris potentiometric sensor can be schematically represented by the following phase sequence:
H2 (g), H2O (g), Pt / solid electrolyte / reference mixture, graphite, stainless steel
I II
The left half-cell of the sensor is termed Fe (H), Pt for its application in monitoring the H content in steel. A Nafion membrane functions as the solid electrolyte, and the Fe (II) and Fe (III) sulfates act as the reference mixture. Therefore, the scheme can be rewritten as follows (Figure 2):
Fe (H), Pt / Nafion membrane / Fe (II) and Fe (III) sulfates, graphite, stainless steel I II
The equilibrium between phases I and II of the sensor is discussed in the following section. I. Hydrogen gas (H2)
1 2H+ ions dissolve in the membrane.
II. Equation 2 shows the reaction of the reference mixture:
2
Equation 3 shows the reaction of interest:
3
Equation 4 is the sum of reactions I and II (equations 1 and 2):
4
Pt H2
Fe(H) 2H+
2Fe++++2e → 2Fe++
V Stainless steel compression screw
Compact graphite disc
Reference mixture
Polymeric electrolyte
Black platinum powder
Steel
Figure 2. Schematic representation of the hydrogen sensor cell proposed in this work.
The Gibbs free energy for phase I and II reactions is given by the following (equation 5): 5
The total potential of the sensor cell can be determined using equation 6: 6
is the partial hydrogen pressure;
H
a
is the activity of hydrogen ions in the membrane; R is the ideal gas constant (8.314 J/mol-K);
T is the absolute temperature (K);
F is the Faraday constant (96,500 C/mol);
Standard potential = +0.771; Standard potential = ±0.000.
Replacing the variables in equation 6 with numerical values and considering that the [Fe3+] and [Fe2+] concentrations and the H+ activity in the membrane are equal to unity, the equation that describes the sensor behavior can be rewritten as equation 7:
7
At a temperature of 25 °C (278 K), the equation can be further simplified to (equation 8): 8
2. EXPERIMENTATION.
2.1 Design of the potentiometric sensor cell.
[image:5.596.89.501.421.598.2]The potentiometric sensor cell was designed according to the prototype developed by Morris [4-5]. The stages of construction are described in the following paragraphs.
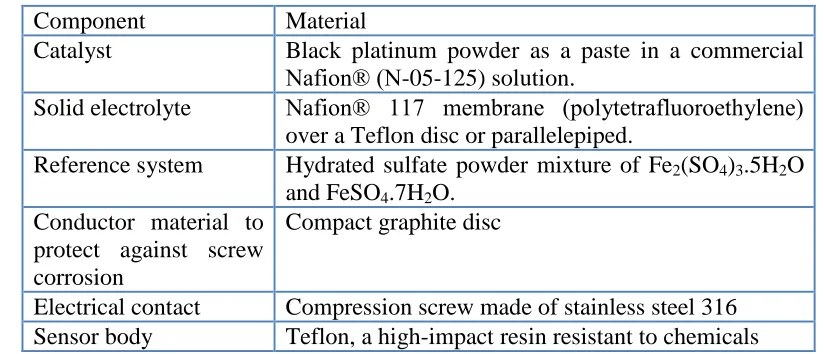
Table 1. Materials used to fabricate the sensor
Component Material
Catalyst Black platinum powder as a paste in a commercial Nafion® (N-05-125) solution.
Solid electrolyte Nafion® 117 membrane (polytetrafluoroethylene) over a Teflon disc or parallelepiped.
Reference system Hydrated sulfate powder mixture of Fe2(SO4)3.5H2O
and FeSO4.7H2O.
Conductor material to protect against screw corrosion
Compact graphite disc
Electrical contact Compression screw made of stainless steel 316 Sensor body Teflon, a high-impact resin resistant to chemicals
The sensor cell had the following components, as shown in Figure 1:
1. an electrical conductor (i) on a Teflon disc to monitor the H emerging from the absorbed H2 gas by the steel;
2. a solid electrolyte (ii) in contact with the electrical conductor (i) that transports the H+; 3. a reference (iii) that is in contact with the solid electrolyte (ii), connected by a graphite disc (iv) and a screw (v);
6. the sensor body (vi).
The materials needed to fabricate the sensor are given in Table 1.
The selection criteria of these materials are based on their properties, safety and availability in the market.
To optimize the ionic transport of the Nafion 117 membrane, the membrane was activated according to the following procedure:
Soak the membrane in a 5% solution of oxygen peroxide.
Heat the solution to boiling for one hour to dissolve the organic impurities. Rinse the membrane with deionized water to eliminate the peroxide. Soak the membrane in sulfuric acid to dissolve any metallic impurities.
Finally, rinse the membrane several times with deionized water to remove the acid.
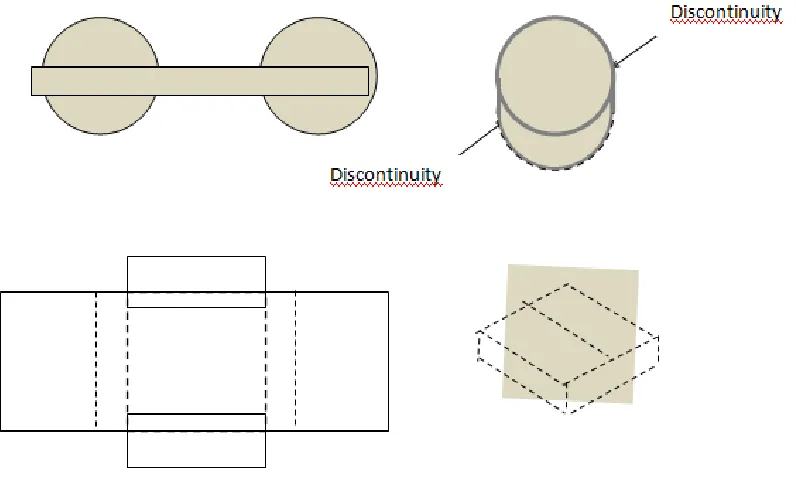
The sensor proposed by Morris could not fully capture the Teflon disc with the Nafion membrane, and the results of our first tests were not repeatable with this prototype. The disc was changed to a parallelepiped to facilitate a complete coverage (Figure 3) and avoid possible discontinuities in the conduction of H by coating the vertices of the cylinders.
Figure 3. The disc was changed to a parallelepiped, which allowed a complete coating and avoided possible discontinuities in the conduction of H by coating the vertices of the cylinder.
[image:6.596.110.508.373.612.2]
Figure 4. Photographs of the model A and B sensors.
2.2 Preliminary tests with the model A sensor.
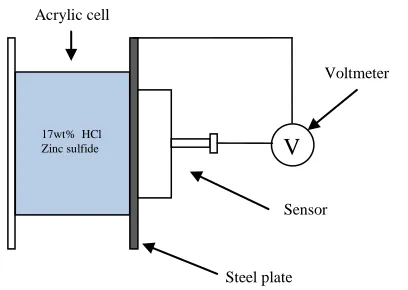
The model A sensor with the cylindrical cap and Nafion membrane was constructed with an activation treatment. To verify the electrical functions of the sensor, it was placed on the surface of a 1/8”-thick AISI/SAE 1080 steel plate. A thin layer of silicon grease was applied around the sensor to prevent the entry of air. The plate was placed in a beaker that was then filled with a 17wt% HCl solution with zinc sulfide to prevent the formation of H2. Finally, the voltmeter was connected between
the surface of the steel plate and the sensor connector [4]. Figure 5 illustrates this setup.
As the HCl corrosion advanced in one face of the plate, the potential difference between the plate and the sensor was measured.
Figure 5. Setup to test the electrochemical function of the model A sensors.
2.3 Preliminary tests with model B sensor.
The objective of the test was to verify the correct operation of the Morris sensor by simultaneously detecting hydrogen permeation and reducing the passive film by the diffusion of hydrogen through a stainless steel barrier [15].
17wt% HCl
Zinc sulfide V
Acrylic cell
Steel plate
Voltmeter
Sensor
[image:7.596.84.514.71.226.2] [image:7.596.201.405.480.625.2]
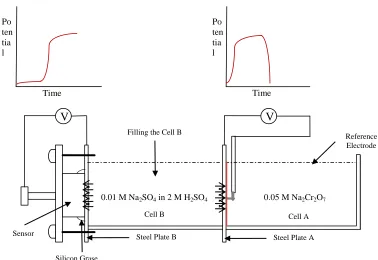
The experimental setup to verify the proper functions of the model B sensors is shown in Figure 6. The setup consists of two identical acrylic cells glued to 1/8” thick AISI/SAE 1080 steel plates by an epoxy adhesive. The sensor is placed on the test surface of plate B, and a thin layer of silicone grease is applied on the external surface to prevent the entry of air. A second plate, plate A, is glued between the two cells.
Figure 6. Test setup for model B sensor.
Once the cells are completely glued to the plates, cell A is filled with a 0.05 M Na2Cr2O7
solution. Using a digital voltmeter (Fluke 289/FVF with recording and data acquisition capabilities) connected to plate A and a Calomel reference electrode, the potential change is recorded as a function of time. When the potential reaches a maximum and stabilizes, the surface of plate A is assumed to have been passivated. Cell B is then filled with a solution of 0.1 M Na2SO4 in 2 M H2SO4. The
solution in cell B will cause simultaneous corrosion of the surfaces of plates A and B by promoting the diffusion of H through both plates. At this point, the sensor will detect the H exiting plate B, and the voltmeter connected between the sensor and plate B will be reading a potential. At the same time, plate A will begin to depassivate, and the voltmeter between plate A and the reference electrode will record a drop in potential. Over time, the potential reading between the sensor and plate B will increase up to a maximum while the potential between plate A and the reference electrode remains relatively constant. When both potential readings begin to change at the same rate, the flux of H is assumed to have begun in both cells, indicating that the sensors are functioning properly.
Time Po
ten tia l
Time Po
ten tia l
Figure 5. Test set up for Model B sensor.
V V
Reference Electrode
Sensor
Silicon Grase
Cell B Cell A
Steel Plate B Steel Plate A Filling the Cell B
[image:8.596.104.482.174.434.2]
2.4 Repeatability tests of model B sensor.
To independently determine the repeatability of the model B sensor, a cell was constructed, as shown Figure 7, based on the diagram of Figure 5 [4]. The permeation tests were conducted with a 0.062”-thick AISI/SAE 1018 steel plate polished with grade 600 paper in a solution of 2 M H2SO4 .
[image:9.596.180.416.193.328.2]The potential drop generated was measured and recorded with a digital voltmeter (Fluke 289/FVF).
Figure 7. Cell designed to check the repeatability of the model B sensor.
2.5 Calibration.
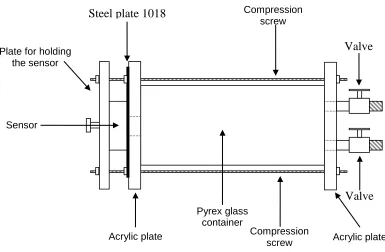
Figure 8. Sensor calibration device.
The sensor was calibrated using high purity H2 gas (99.999%). We used a calibration device in
which the sensor was fixed on a steel plate with an orifice that allows the direct exposure of the Nafion membrane to H2 gas (Figure 8). The pressures used for calibration (pH2) were as follows: 0.025 at,
Sensor
Plate for holding the sensor
Steel plate 1018
Acrylic plate Acrylic plate Pyrex glass
container
Compression screw
Valve Valve Compression
[image:9.596.93.478.412.664.2]
0.06 at, 0.20 at and 1 atm. The potential drop generated was measured and recorded with a Fluke 289/FVF.
3. RESULTS AND DISCUSSION.
3.1 Model A sensor tests.
The results of tests conducted with the model A sensor using the setup shown in Figure 5 were not reproducible, as that different saturation potential values were obtained. In addition, the saturation voltage was determined to be 250 V after 2000 minutes, which is lower than the expected value.
In a similar test, D. R. Morris, R. V. Kumar and D. J. Fray [4], working with the same solution (17 wt% HCl, pH ~ 0) and an unspecified steel obtained a maximum potential of 740 mV after 1140 minutes.
Table 2.Comparison of the results obtained with the sensor model A and those obtained by Morris, Kumar and Fray [4].
Reference Emax [mV] pH Diffusion
[image:10.596.68.528.376.519.2]Time tb
[minutes]
Thickness L [mm]
Thickness L [inches]
Model A Figure 5 Steel AISI/1080
This work
250 in2000 minutes
~ 0 --- 3.17 1/8 (.125)
Model A Reference 4 Unreported steel
≈740 in1140 minutes
~ 0 --- --- ---
3.2. Model B sensor tests.
To form a passive layer on the surface of plate A in contact with cell A (Figure 6), Na2Cr2O7
H2O was added to cell A. This produced an incremental change in the potential due to the passivation
layer, which later reached [15] a constant value, as shown in Figure 9. This was termed the first stage. After 623 minutes, in the second stage, cell B was filled with a solution with 0.01M Na2SO4in 2M
H2SO4, which caused hydrogen to be produced from a corrosion reaction. The hydrogen diffused
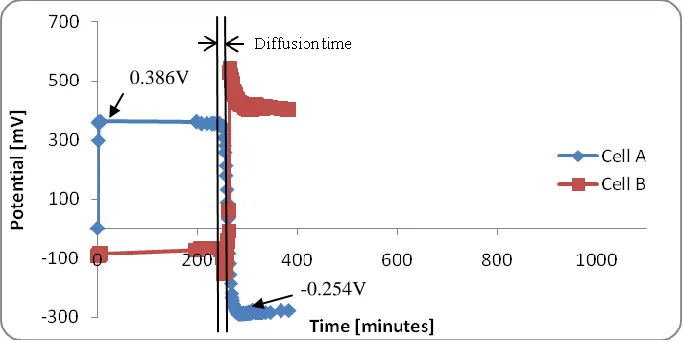
Figure 9.Potential response of cells A and B in the test for the model B sensor.
The repeatability of the sensor was examined, as shown in Figure 10. Cell plate A was passivated with Na2Cr2O7 H2O, and cell B was filled with a solution of 0.01 M Na2SO4 in2M H2SO4
solution after 246 minutes. The potential values in cell A reduced as a result of H diffusion in plate A, as shown in Figure 10. The sensor concurrently detected H exiting the outer surface of plate B. The potential in both cells changed 7 minutes after cell B was filled. The experiment was considered to be reproducible because the potential developed in both experiments were similar.
Figure 10.Potential response of cells A and B in the repeatability test for the model B sensor.
As can be seen in Figures 9 and 10, the depassivation of steel AISI/SAE 1018 (1.6 mm), in contact with 0.05 M Na2Cr2O7 in cell A (Figure 6) shows a variation of 400 - 300 mV and a hydrogen
diffusion time of 7 minutes. Furthermore R. T. Davis and T. J. Butler [15 (Fig. 2)] obtained a depassivation response with a similar variation with a hydrogen diffusion time of approximately 10 minutes using the same solution and ~ 2.54-mm-thick H-1235 steel, C 0.20.
The hydrogen sensor responses induced by acid corrosion in cell B are given by the graphs of potential versus time in Figures 9 and 10. Similar behavior to that reported by LixiangWan and David R. Morris [5, (Figures 4,5)]; D. R. Morris, V. S. Sastri, M. Elboujdani, and R. W. Revie [16, (Figure 6)]; and D.R. Morris and L. Wan [17, (Figures 7, 8 and 12)]is observed. The sensor responses
0.360V
-0.284V
0.386V
[image:11.596.128.470.402.573.2]
generally show a rapid increase in potential followed by a slight decrease. The maximum potential and diffusion times of atomic hydrogen, according to the literature, mainly depend on the type of steel, iron status and pH of the corrosive solution (Table 3).
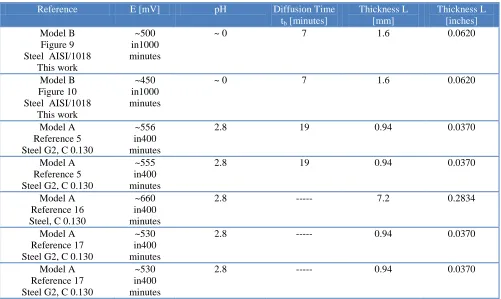
Table 3. Comparing the results obtained with the model B sensor using the double cell (Figure 6) with those reported by Lixiang Wan and David R. Morris [5, (Figures 4,5)]; D. R. Morris, V. S. Sastri, M. Elboujdani and R. W. Revie [16, (Figure 6)]; and D.R. Morris and L. Wan [17, (Figures 7, 8 and 12)].
Reference E [mV] pH Diffusion Time
tb [minutes]
[image:12.596.49.550.216.515.2] [image:12.596.118.483.571.731.2]Thickness L [mm] Thickness L [inches] Model B Figure 9 Steel AISI/1018
This work
~500 in1000 minutes
~ 0 7 1.6 0.0620
Model B Figure 10 Steel AISI/1018
This work
~450 in1000 minutes
~ 0 7 1.6 0.0620
Model A Reference 5 Steel G2, C 0.130
~556 in400 minutes
2.8 19 0.94 0.0370
Model A Reference 5 Steel G2, C 0.130
~555 in400 minutes
2.8 19 0.94 0.0370
Model A Reference 16 Steel, C 0.130
~660 in400 minutes
2.8 --- 7.2 0.2834
Model A Reference 17 Steel G2, C 0.130
~530 in400 minutes
2.8 --- 0.94 0.0370
Model A Reference 17 Steel G2, C 0.130
~530 in400 minutes
2.8 --- 0.94 0.0370
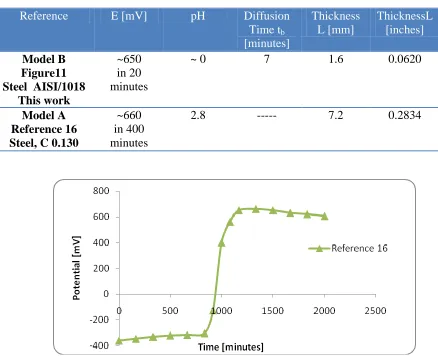
3.3 Repeatability tests of the cell in Figure 7.
By comparing the H permeation test results (shown in Figures 9 and 10) of the model B sensor obtained with the double cell shown in Figure 6 with the results (shown in Figure 11) obtained with the cell shown in Figure 7 the results were seen to be repeatable.
Regarding the repeatability of tests conducted with the special cell shown in Figure 7, the sensor response graphs (Figure 11) were very similar to the sensor response graph obtained in reference [16, (Figure 6)], Table 4 and Figure 12.
Table 4.Comparison of the results obtained with the model B sensor using the unit cell shown in Figure 7 with those published by R.W.Revie [16, (Figure 6)].
Reference E [mV] pH Diffusion
[image:13.596.82.520.251.607.2]Time tb
[minutes]
Thickness L [mm]
ThicknessL [inches]
Model B Figure11 Steel AISI/1018
This work
~650 in 20 minutes
~ 0 7 1.6 0.0620
Model A Reference 16 Steel, C 0.130
~660 in 400 minutes
2.8 --- 7.2 0.2834
Figure 12.Potentialresponse of the model A sensor with steel, C 0.130[16].
3.4 Calibration results.
Table 5. H2 pressures employed in the sensor calibration tests and their corresponding potentials. H2 pressure [atm] E Theoretical[mV] E Fray – Morris[17][mV] E Experimental [mV]
0.025 0.7241 0.5300 0.6080
0.06 0.7350 0.5600 0.6056
0.2 0.7503 0.5920 0.6107
1.0 0.7710 0.6350 0.6469
The sensor calibration results were correlated with the Nernst equation, as shown in Figure 12.
Figure 12.Sensor calibration results.
By comparing the sensor voltages between the calibration curve and those of the Nernst equation, a difference of approximately 100 mV was observedat the various H2pressures.However, the
calibration using the Fray-Morris model [5, 7] showed a between 130 to approximately 200 mV depending on the pressure used. Thetheoretical slope of the Nernst equationwas 0.0128, the slope of the experimental results was 0.0107 and the slope of the Fray-Morris model was 0.0284.
4. CONCLUSIONS
An electrochemical sensor to measure the partial pressure of hydrogen that diffuses out of a steel plate was designed and built based on a prototype proposed by Morris. The design incorporates Teflon, a high-impact resin resistant to chemicals as the sensor body and a Nafion 117 membrane.
The shape of the Nafion membrane for the sensor prototype proposed by Morris was changed from a disc to a parallelepiped to eliminate leakages of hydrogen and to simplify the fabrication process.
[image:14.596.116.480.233.411.2]
The potential readings of the sensor were stable and the values obtained were consistent with those reported in the literature.
The prototype developed in this work can detect the transferred hydrogen effectively, which allows the sensor to be used in the laboratory and in the field.
The calibration curves of the sensor showed a linear behavior similar to the Nernst equation and the calibration curve using the Fray-Morris model.
ACKNOWLEDGMENTS
The authors wish to thank the Group of Ducts Integrity Analysis (GAID) for their economic support and for providing experimental materials, laboratory equipment and scholarship funding. The authors are grateful to Concejo Nacional de Ciencia y Tecnologia (CONACYT) for the grants associated with this work. The authors express their gratitude for the use of the Corrosion Laboratory of the Metallurgical Engineering Department of the Instituto Politécnico Nacional (DIM-ESIQIE-IPN).
References
1. M. G. Hay, An Electrochemical Device for Monitoring Hydrogen Diffusing Through Steel, CIM Conference, Edmonton, Alta., Canada (CIM, 1983).
2. M. G. Hay, Sour Gas Linepipes – The Need for HIC Resistance, CIM Conference, Calgary, Canada (CIM, 1988).
3. C. Christensen, H. Arup, R. T. Hill, Corrosion Monitoring in Wet, Sour Gas by Use of Hydrogen Permation Probes, CORROSION/89, New Orleans, LA, 1989 (Houston, TX: NACE, 1989). 4. D. R. Morris, R. V. Kumar, D. J. Fray, Iron and Steel Making 16(1989) 429-493.
5. Lixiang Wan and David R. Morris, Development of Solid State Potentiometric Sensor for Monitoring Hydrogen in Commercial Pipeline Steels, Fredericton, NB, Canada E3B 5A3, 1993 6. P. E. Childs, A. T. Howe, and M. G. Shilton; Journal Power Sources. 3 (1978) 105-114.
7. A. T. Howe, S. H. Sheffield, P. E. Childs, and M. G Shilton: Thin Solid Films, 67 (1980) 365-370. 8. J. S. Lundsgaard, J. Malling, and M. L. S. Birchall: Solid State Ionics, 7 (1982) 53-56.
9. J. Schoonman, D. R. Franceschetti. And J. W. Hanneken: Ber. Bunsenges. Phys. Chem.. 86 (1982) 701 - 703.
10.S. B. Lyon and D. J. Fray: Solid State Ionics. 9 (1983) 1295 - 1298.
11.K. A. Eagles and D. J. Fray: in Proc. Conf. UK Corrosion 1984, Birmingham. Institution of Corrosion Science and Technology. 199.
12.S. B. Lyon and D. J. Fray: Br. Corrosion Journal. 19 (1984) 23-29. 13.G. Hultquist: Corros. Sci., 26 (1986) 173 - 175.
14.R. V. Kumar and D. J. Fray: in Proc. 2nd Int. Meeting on Chemical Sensors. Bordeaux, July (1986) 306.
15.R. T. Davis, Jr., and T. J. Butier, Journal of the Electrochemical Society, 5 (1958) 562-568. 16. D. R. Morris, V. S. Sastri, M. Elboujdani, and R. W. Revie, Corrosion 50 (8) (1994) 641 – 647. 17. D. R. Morris and L. Wan, Corrosion 51 (4) (1995) 301 – 311.
![Table 2.Comparison of the results obtained with the sensor model A and those obtained by Morris, Kumar and Fray [4]](https://thumb-us.123doks.com/thumbv2/123dok_us/1895701.147373/10.596.68.528.376.519/table-comparison-results-obtained-sensor-obtained-morris-kumar.webp)