Int. J. Electrochem. Sci., 9 (2014) 1812 - 1826
International Journal of
ELECTROCHEMICAL
SCIENCE
www.electrochemsci.org
New Chemically Modified Screen-Printed Electrode for Co(II)
Determination in Different Water Samples
Tamer Awad Ali1,*, Refat F. Aglan2, Gehad G. Mohamed3, Mai A. Mourad3
1
Egyptian Petroleum Research Institute (EPRI), 11727, Cairo, Egypt. 2
Hot Laboratories Center, Atomic Energy Authority, 13759, Cairo, Egypt 3
Chemistry Department, Faculty of Science, Cairo University, 12613, Giza, Egypt. *
E-mail: [email protected]
Received: 9November 2013 / Accepted: 22 December 2013 / Published: 2 February 2014
Modified screen-printed electrode (SPE) with magnesium alumino-silicate ionophore was fabricated for the determination of Co(II). The modified electrode reveals linear response over wide concentration range of 3.1×10⁻⁷ - 1×10⁻¹ mol L-1 of Co(II) at 25 oC with a divalent cationic slope of 30.33 ± 0.75 mV decade-1 and exhibit detection limit of 3.1×10⁻⁷ mol L-1. Moreover, the selectivity coefficient was measured by matched potential and fixed interference methods. The modified SPE sensor shows high selectivity and sensitivity for determination of Co(II) and also shows stable and reproducible response over a period of four months. This method can be used for determination of Co(II) in water, soil and fish tissue samples and the results obtained agreed with those obtained with atomic absorption spectrometer (AAS). The proposed potentiometric method was validated according to the IUPAC recommendation.
Keywords: Screen-printed ion-selective electrode, magnesium alumino-silicate, cobalt determination, water samples.
1. INTRODUCTION
prevention of pernicious anemia [4-5]. Insufficient natural levels of cobalt in feed causes co-deficiency diseases characterized by pernicious anemia, loss of weight or retarded growth and is one of the main risk factors for cardiovascular diseases [6]. However, at high concentrations, cobalt is toxic and has been reported to produce pulmonary disorders, dermatitis, nausea, vomiting, diarrhea, blood pressure, slowed respiration, giddiness cardiomyopathy, hyperglycemia and so on [7]. The maximum recommended concentration of toxic ions such as cobalt in drinking water for livestock is 1.0 mg [8]. So determination of this element is very important. So far a number of sophisticated methods of cobalt determination have been applied, including flame atomic adsorption [9], atomic adsorption spectrometry [10], vis spectrophotometry [11-12], stripping voltammetry [13-14] and chemilumnescence [15]. These methods are characterized by good accuracy but they require time-consuming sample preparation and are relatively expensive. Therefore, new methods are being developed, including potentiometric methods with ion-selective electrodes (ISEs). Potentiometry with ISEs offers advantages such as selectivity, sensitivity, good precision, simplicity, low cost and short time of analysis. So far number of cobalt-selective sensors has been described in the literature on the topic [16-24]. Moreover, most of these electrodes suffer a lack of stability, a limited concentration range with theoretical response, and exhibit low lifetime and high response time. Furthermore almost all electrodes have an internal filing solution, which requires some operation and vertical position. The purpose of the present work is to obtain a modified screen-printed electrode with magnesium alumino-silicate ionophore to make a highly selective and sensitive electrode for potentiometric determination of cobalt(II) ion in different water samples. The different experimental parameters are optimized according to the IUPAC recommendation. The method is validated and the data obtained are compared with those obtained using atomic absorption spectrometry.
2. EXPERIMENTAL
2.1. Reagents and chemicals
Analytical grade reagents are used in this study. Bidistilled water was used throughout all experiments. Cobalt chloride was supplied from Merck. Sodium metasilicate (GRG, UK), magnesium chloride and aluminum chloride (El-Nasr Company, Egypt) were used. o-Nitrophenyloctylether (o -NPOE) was supplied from Fluka while dioctylphthalate (DOP), dibutylphthalate (DBP) and dioctylsebacate (DOS) were supplied from BDH. Tricresylphosphate (TCP), polyvinyl chloride (PVC, relative high molecular weight) and graphite powder (synthetic 1–2 μm) were supplied from Aldrich. Hydrochloric acid and sodium hydroxide were supplied from BDH. Chloride salts of metal cations are used as interfering ions.
2.2. Apparatus
selective electrode was used. Digital burette was used for the measurement of Co(II) ion under investigation. pH measurements were done using Thermo-Orion, model Orion 3 stars, USA. Prior to analysis, all glasswares used were washed carefully with bidistilled water and dried in the oven before use. A Perkin Elmer model 3100 atomic absorption spectrophotometer (AAS) with a graphite furnace was used to determine the concentration of Co(II) ion in the standard solutions and water samples.
2.3. Preparation of magnesium alumino-silicate ionophore
This composite was synthesized by dropwise addition of 0.5 mol L-1 aqueous solutions of magnesium chloride and aluminum chloride mixture (1:1) (200 mL) to 0.5 mol L-1 aqueous solution of sodium metasilicate (200 mL) with continuous stirring in a water bath adjusted at 60±1 ºC. The mixed solution was immediately hydrolyzed in demineralized water. The precipitate was formed by addition of diluted ammonia solution to the mixture. After an overnight standing, the precipitate was separated and washed several times with bidistilled water. Then, it washed with 0.1 mol L-1 HNO3 to remove the impurities and Cl− ions. The precipitate was rewashed by bidistilled water to remove NO3− ions. After drying at 60±1ºC, solid was poured in bidistilled water heated at 80±1 ºC to broken the solid and remove air trapped inside the solid, then redried at 60±1 ºC. The obtained solid was ground, sieved and stored at room temperature [25].
2.4. Preparation of modified screen-printed electrode
SPE was prepared by using a manual screen-printer and an array of 12 electrodes was printed on a flexible X-ray film by forcing the prepared conductive ink to penetrate through the mesh of a screen stencil. A screen consisting of a heavy duty polyester fabric (I 003 M Sefar Pet 1000 with mesh count of 36) was pre-tensioned to ca 30×40 cm wooden frame. For the stainless-steel template, steel sheet were pre-tensioned to a steel frame and contain grooves with the same electrode dimensions [26-33]. The home-made printing ink was prepared by thoroughly mixing the cyclohexanone:acetone mixture 1:1, as a solvent for the binding material with 450 mg of plasticizer, 1.25 g polyvinyl chloride, 0.75 g of the carbon powder and then 12.5 mg of magnesium alumino-silicate was added after stirring for 15 min. The ink was sonicated and applied for printing of the electrodes [26-33]. The influence of the plasticizer choice on the electrode performances has been studied as the electrode plasticized with
o-NPOE is compared with those plasticized with DBP, DOP, DOS and TCP. The SPEs were stored in a dry state at room temperature [26-33].
2.5. Potential measurements
of the extrapolated linear segments of the calibration curve. The selectivity coefficients (KpotCo,J) were measured using the fixed interference and matched potential methods using 1×10⁻³ mol L-1 Co(II) and interfering ions. The pH of Co(II) solution was adjusted by adding an appropriate amount of 0.1 mol L -1
of either HCl or NaOH. Cobalt chloride solutions were prepared with the concentration range 1×10⁻¹ to 3.1×10⁻⁷ mol L-1 by serial dilution of 0.1 mol L-1 Co(II) solution. The concentrations of the standard solutions were also confirmed by atomic absorption spectrophotometry.
2.6. Determination of Co(II) in water samples
The proposed sensor has been used for determining cobalt ions in different water samples. These samples were collected (Table 1), filtered, stored and their pH was adjusted according to the working pH range of the sensor by using 0.1 mol L-1 HCl or NaOH. Cobalt(II) is determined potentiometrically as described above [34, 35].
2.7. Determination of Co(II) in soil samples
About 10 g of aerobically dried soil samples (Table 1) is treated with diethylene triamine pentaacetic acid [DTPA] solution, stirred for 2 hours, filtrated with Whatman filter paper No. 42 [34, 35]. Take 10 mL of the prepared soil solution and treat it as mentioned before.
[image:4.596.34.563.492.719.2]2.8. Determination of Co(II) in fish tissue samples
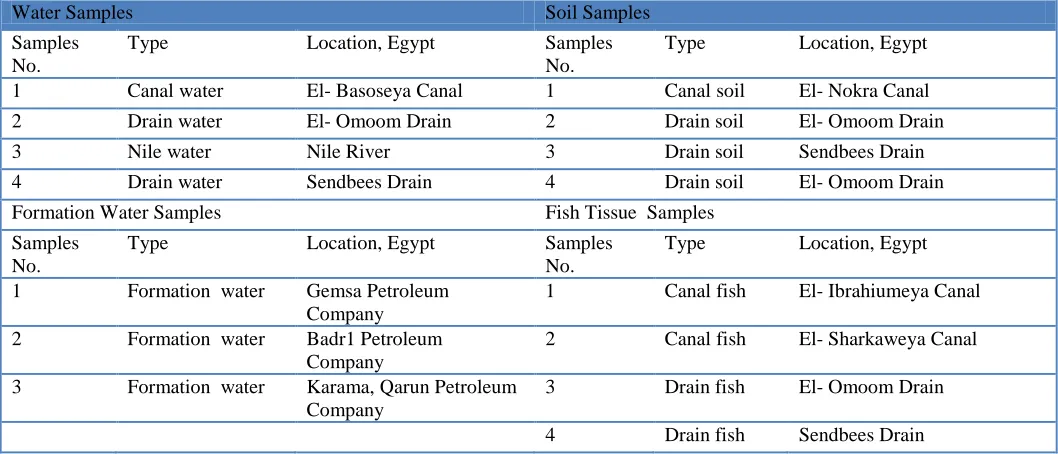
Table 1. Types and location of water, soil and fish tissue samples
Water Samples Soil Samples Samples
No.
Type Location, Egypt Samples No.
Type Location, Egypt
1 Canal water El- Basoseya Canal 1 Canal soil El- Nokra Canal 2 Drain water El- Omoom Drain 2 Drain soil El- Omoom Drain 3 Nile water Nile River 3 Drain soil Sendbees Drain 4 Drain water Sendbees Drain 4 Drain soil El- Omoom Drain Formation Water Samples Fish Tissue Samples
Samples No.
Type Location, Egypt Samples No.
Type Location, Egypt
1 Formation water Gemsa Petroleum Company
1 Canal fish El- Ibrahiumeya Canal
2 Formation water Badr1 Petroleum Company
2 Canal fish El- Sharkaweya Canal
3 Formation water Karama, Qarun Petroleum Company
3 Drain fish El- Omoom Drain
4 Drain fish Sendbees Drain
1 mL acetate buffer and adjusted to pH (4). Cobalt is determined potentiometrically as described above.
3. RESULTS AND DISCUSSION
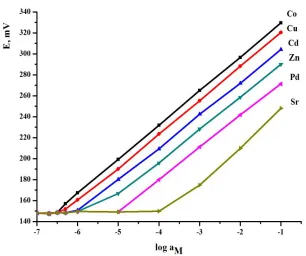
In preliminary experiments, magnesium alumino-silicate was used as an electroactive material to prepare SPEs for a wide variety of metal ions, including alkali, alkaline earth, transition and heavy metal ions. The potential responses of various SPEs based on magnesium alumino-silicate were obtained separately for each ion and the results are shown in Figure (1). As seen from this figure, the Co(II)-SPE has shown the most sensitive response, which indicates that the paste electrode based on magnesium alumino-silicate could be suitable for determination of Co(II).
Figure 1. Potential response of modified SPEs based on magnesium alumino-silicate for various metal ions.
[image:5.596.137.443.304.560.2]
The response characteristics of the magnesium alumino-silicate SPE were systematically evaluated according to IUPAC recommendation [37,38]. The calibration plot obtained, Figure (1), shows a linear response over the concentration range of 3.1×10⁻⁷ - 1×10⁻¹ mol L-1 Co(II) ion with a cationic slope of 30.33±0.75 mV decade-1. The lower limit of detection was approximately 3.1×10⁻⁷ mol L-1 Co(II) ion. Table (2) summarizes the response characteristics of the proposed SPE sensor.
3.1. Effect of ionophore content
[image:6.596.99.495.333.536.2]The paste composition is a significant parameter for an electrode, when the amount of the magnesium alumino-silicate as an electroactive material in the matrix is sufficient to achieve reasonable ionic exchange (selective extraction of the target ion), chemical equilibrium at the paste will be responsible for the electrode potential.
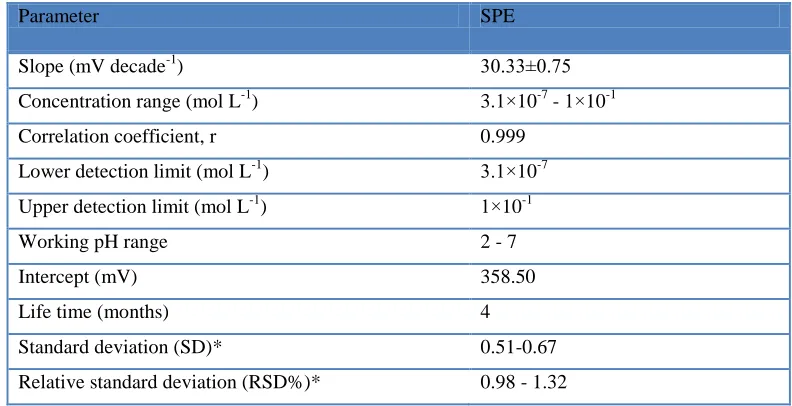
Table 2. Response characteristics of modified SPE sensor with magnesium alumino-silicate ionophore.
Parameter SPE
Slope (mV decade-1) 30.33±0.75 Concentration range (mol L-1) 3.1×10⁻⁷ - 1×10⁻¹ Correlation coefficient, r 0.999
Lower detection limit (mol L-1) 3.1×10⁻⁷ Upper detection limit (mol L-1) 1×10⁻¹ Working pH range 2 - 7
Intercept (mV) 358.50 Life time (months) 4 Standard deviation (SD)* 0.51-0.67
Relative standard deviation (RSD%)* 0.98 - 1.32
* Average of four determinations
Table 3. Effect of ionophore content on the performance characteristics of modified SPE sensor.
No. of electrodes
Ion Pair Content (mg)
Concentration rang (mol L-1)
Slope
(mV decade-1)
Recovery %
Total potential change, mV
[image:6.596.55.542.607.730.2]
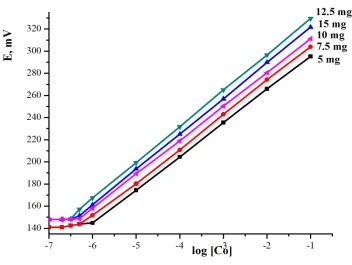
Figure 2. Effect of ionophore content on calibration of the modified SPE sensor.
The influence of the sensing material on the electrode performance was studied. For this purpose, five electrodes were prepared containing different amounts of the magnesium alumino-silicate ionophore (5-15) mg. It was obvious that, the optimum ionophore content was found to be 12.5 mg, as indicated in Table (3) and Figure (2). As the ionophore content increases, the slope of calibration curve increases till certain point then decreases for all studied electrodes.
3.2. Effect of plasticizer type
Figure 3. Effect of plasticizer type on calibration of the modified SPE sensor.
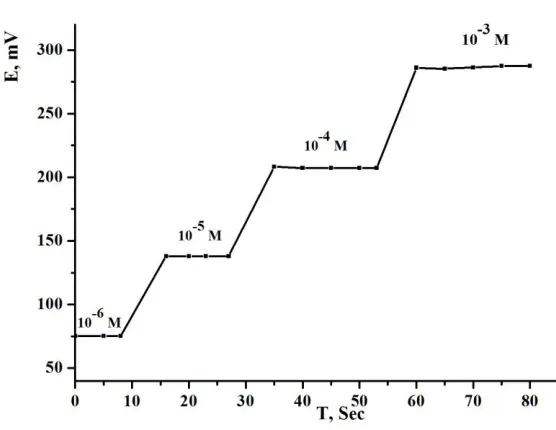
3.3. Dynamic response time
Figure 4. Dynamic response time of cobalt(II) modified SPE sensor.
[image:8.596.147.425.445.660.2]
L-1). The measurements of potential versus time were carried out with Co(II) solutions from lower to higher concentrations (Figure 4). It was found that the static response time for the proposed sensor was 7 s over all linear concentration ranges and the potentials remained constant for about 15 s.
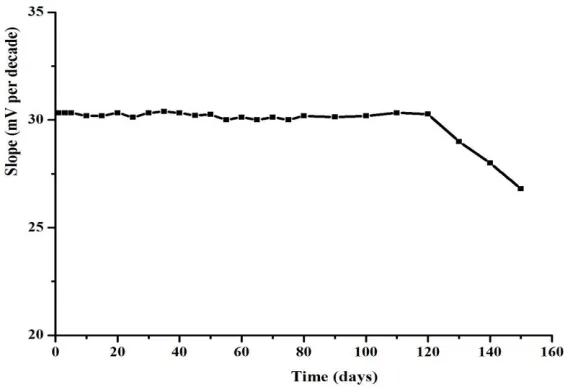
3.4. Lifetime
The average lifetime for most of the reported SPE sensors is in the range of 4–5 months. After this time the slope of the sensor will decrease, and the detection limit will increase. The modified SPE sensor was tested for five months, during which time, the performance of the SPE sensor was extensively studied. The proposed sensor can be used for four months. First, there is a slight gradual decrease in the slopes (from 30.33 to 26.10 mV decade-1) and, second, an increase in the detection limit (from 3.1×10⁻⁷ to 2×10⁻⁵ mol L-1). It is well established that the loss of plasticizer, carrier, or ionic site from the polymeric film due to leaching into the sample is a primary reason for the limited lifetime of the SPE sensor (Figure 5).
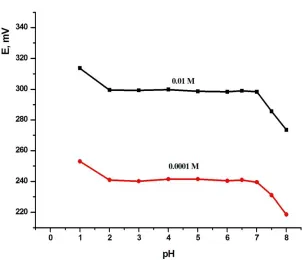
3.5. Effect of pH
[image:9.596.154.436.541.735.2]The potentiometric response of the electrode was found to be sensitive to pH changes. Hence, the pH dependence of the potentials of the proposed SPE sensor was investigated in the pH range of 1– 8 for 1×10⁻² and 1×10⁻⁴ mol L-1 Co(II) ion solutions, and the results are shown in Figure 6. The pH of the test solution was adjusted by the addition of 0.1 mol L-1 sodium hydroxide or hydrochloric acid. The results show that the potential response of the SPE sensor remains constant over the pH range of 2–7. However, beyond this range, relatively drastic drifts were observed in the potential response. At pH < 2, the observed increase in potential could be ascribed to the competitive binding of proton to the carrier in addition to Co(II) ion at the surface of the electrode whereas formation of hydroxide complexes of Co(II) ion at higher pH (>7) may result in the sharp decrease in potential response.
Figure 6. Effect of pH of the test solution on the potential readings of modified SPE sensor
3.6. Effect of temperature
Calibration graphs (electrode potential (Eelec) versus p[Co(II)]) were constructed at different test solution temperatures at 10-60 °C. For the determination of the isothermal coefficient (dEº/dT) of the SPE sensor, the standard electrode potentials (Eº) against the normal hydrogen electrode at the different temperatures were obtained from calibration graphs as the intercepts at p[Co(II)] = 0 (after subtracting the values of the standard electrode potential of the silver/silver chloride electrode at these temperatures) and were plotted versus (t-25), where t was the temperature of the test solution in ºC (Figure 7). A straight-line plot is obtained according to Antropov’s equation [32-35].
Eºcell = Eºcell (25 ºC) + [(dEº)cell ⁄dt] (t-25)
[image:10.596.138.440.93.353.2]
Figure 7. Variation of the cell e.m.f. with the temperature for the modified SPE sensor.
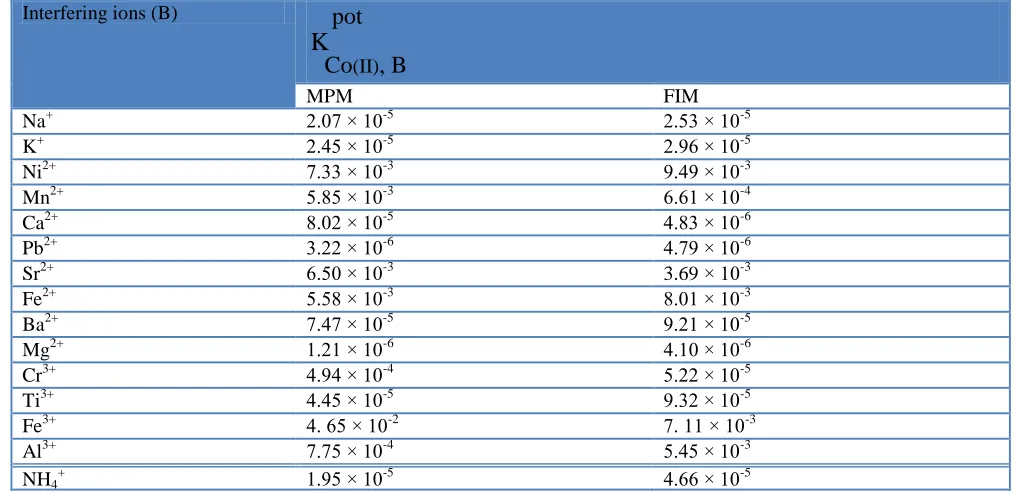
[image:11.596.168.438.91.325.2]3.7. Selectivity and interference
Table 4. Potentiometric selectivity coefficients of some interfering ions using the modified SPE sensor
Interfering ions (B)
K
pot
Co(II), B
MPM FIM
Na+ 2.07 × 10⁻⁵ 2.53 × 10⁻⁵ K+ 2.45 × 10⁻⁵ 2.96 × 10⁻⁵ Ni2+ 7.33 × 10⁻³ 9.49 × 10⁻³ Mn2+ 5.85 × 10⁻³ 6.61 × 10⁻⁴ Ca2+ 8.02 × 10⁻⁵ 4.83 × 10⁻⁶ Pb2+ 3.22 × 10⁻⁶ 4.79 × 10⁻⁶ Sr2+ 6.50 × 10⁻³ 3.69 × 10⁻³ Fe2+ 5.58 × 10⁻³ 8.01 × 10⁻³ Ba2+ 7.47 × 10⁻⁵ 9.21 × 10⁻⁵ Mg2+ 1.21 × 10⁻⁶ 4.10 × 10⁻⁶ Cr3+ 4.94 × 10⁻⁴ 5.22 × 10⁻⁵ Ti3+ 4.45 × 10⁻⁵ 9.32 × 10⁻⁵ Fe3+ 4. 65 × 10-2 7. 11 × 10-3 Al3+ 7.75 × 10⁻⁴ 5.45 × 10⁻³ NH4+ 1.95 × 10⁻⁵ 4.66 × 10⁻⁵
[image:11.596.43.551.438.685.2][image:12.596.82.516.270.619.2]
evaluated by fixed interference method (FIM) [32] and matched potential method (MPM) [35] at 1×10⁻³ mol L-1 of the interfering ions. MPM is recommended by IUPAC to overcome the difficulties associated with the methods based on the Nicolsky–Eisenman equation. According to this method, the specified activity of the primary ion (A) is added to a reference solution, and the potential is measured. In a separate experiment, interfering ion (B) is successively added to an identical reference (containing primary ion) solution until the measured potential matches to that obtained only with the primary ions. The results showed in Table (4) indicate that the modified SPE is highly selective for Co(II) ion and there is no interference from the studied cations.
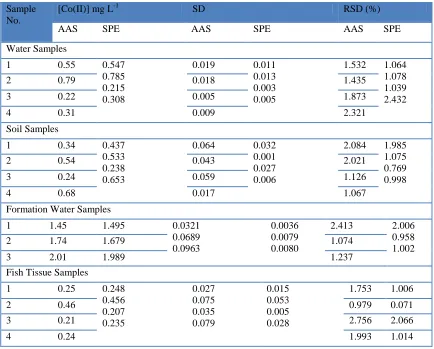
Table 5. Potentiometric determination of Co(II) in water, soil and fish tissue samples using modified SPE sensor.
Sample No.
[Co(II)] mg L-1 SD RSD (%) AAS SPE AAS SPE AAS SPE
Water Samples
1 0.55 0.547 0.785 0.215 0.308
0.019 0.011 0.013 0.003 0.005
1.532 1.064 1.078 1.039 2.432
2 0.79 0.018 1.435
3 0.22 0.005 1.873
4 0.31 0.009 2.321
Soil Samples
1 0.34 0.437 0.533 0.238 0.653
0.064 0.032 0.001 0.027 0.006
2.084 1.985 1.075 0.769 0.998
2 0.54 0.043 2.021
3 0.24 0.059 1.126
4 0.68 0.017 1.067
Formation Water Samples
1 1.45 1.495 0.0321 0.0689 0.0963
0.0036 0.0079 0.0080
2.413 2.006 0.958 1.002
2 1.74 1.679 1.074
3 2.01 1.989 1.237
Fish Tissue Samples
1 0.25 0.248 0.456 0.207 0.235 0.027 0.075 0.035 0.079 0.015 0.053 0.005 0.028
1.753 1.006
2 0.46 0.979 0.071
3 0.21 2.756 2.066
4 0.24 1.993 1.014
3.8. Analytical applications
relative standard deviation of Co(II) ion, which are also in satisfactory agreement with those obtained by AAS method.
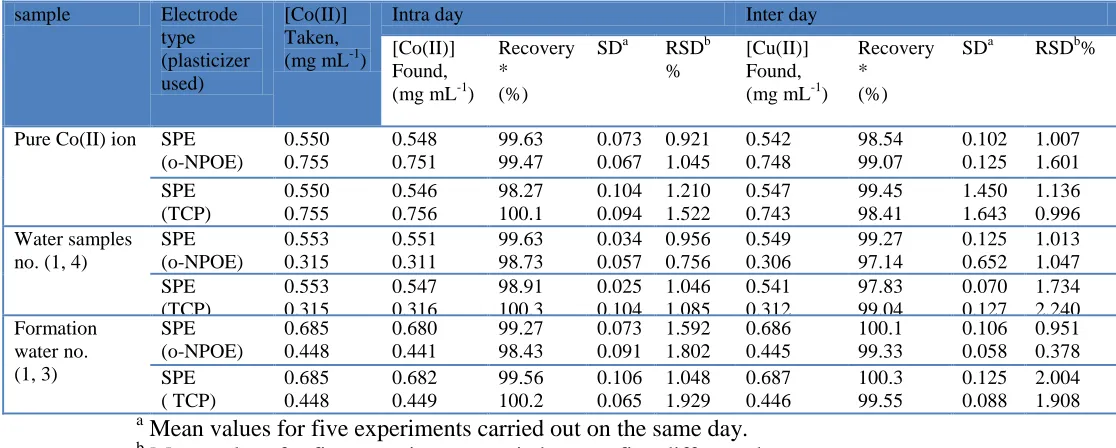
3.9. Repeatability and reproducibility
[image:13.596.18.576.297.521.2]The repeatability and reproducibility of the SPE was studied by performing successive calibrations using two different concentrations of pure Co(II) solution and two different concentrations of two formation water and two water samples in the same day (intra-day) (n = 5) and in different days (inter-day) (n = 5). The low values of the relative standard deviation (RSD%) and standard deviation (SD) indicate the high precision and the good accuracy of the proposed method (Table 6).
Table 6. Evaluation of intra- and inter-day precision and accuracy of modified SPE sensors
sample Electrode type (plasticizer used)
[Co(II)] Taken, (mg mL-1)
Intra day Inter day [Co(II)]
Found, (mg mL-1)
Recovery * (%)
SDa RSDb %
[Cu(II)] Found, (mg mL-1)
Recovery * (%)
SDa RSDb%
Pure Co(II) ion SPE (o-NPOE) 0.550 0.755 0.548 0.751 99.63 99.47 0.073 0.067 0.921 1.045 0.542 0.748 98.54 99.07 0.102 0.125 1.007 1.601 SPE (TCP) 0.550 0.755 0.546 0.756 98.27 100.1 0.104 0.094 1.210 1.522 0.547 0.743 99.45 98.41 1.450 1.643 1.136 0.996 Water samples
no. (1, 4)
SPE (o-NPOE) 0.553 0.315 0.551 0.311 99.63 98.73 0.034 0.057 0.956 0.756 0.549 0.306 99.27 97.14 0.125 0.652 1.013 1.047 SPE (TCP) 0.553 0.315 0.547 0.316 98.91 100.3 0.025 0.104 1.046 1.085 0.541 0.312 97.83 99.04 0.070 0.127 1.734 2.240 Formation water no. (1, 3) SPE (o-NPOE) 0.685 0.448 0.680 0.441 99.27 98.43 0.073 0.091 1.592 1.802 0.686 0.445 100.1 99.33 0.106 0.058 0.951 0.378 SPE ( TCP) 0.685 0.448 0.682 0.449 99.56 100.2 0.106 0.065 1.048 1.929 0.687 0.446 100.3 99.55 0.125 0.088 2.004 1.908 a
Mean values for five experiments carried out on the same day. b
Mean values for five experiments carried out on five different days. *
Average of five determinations
4. CONCLUSION
In this paper, we have constructed a novel screen-printed electrode for the determination of Co(II) ions using magnesium alumino-silicate ionophere for the first time. The results of this study indicated that the electrode exhibited linear response over a wide concentration range (3.1×10⁻⁷ - 1×10 -1
References
1. E.R. Pereira-Filho, C. Mello, P.A. Costa Filho, M.A.Z. Arruda, R.J. Poppi, Anal. Chim.Acta, 433 (2001) 111.
2. G.H. Ellis, J.F. Thompson, Ind. Eng. Chem., 17 (1945) 254.
3. G.L. Donati, C.C. Nascentes, A.R.A. Nogueira, M.A.Z. Arruda, J.A. Nóbrega, Microchem. J., 82 (2006) 189.
4. B.L. Finley, A.D. Monnot, S.H. Gaffney, D.J. Paustenbach, J. Toxicol. Environ. Health - Part B: Critical Rev., 15 (2012) 493.
5. C. Bor Fuh, Y.S. Su, H.Y. Tsai, J. Chromatog. A, 1027 (2004) 289. 6. G.E.J. Fisher, A. MacPherson, Br. Veterinary J., 146 (1990) 120.
7. M.G. Angelova, A. Alexiev, M. Petkova-Botzova, Bulg. Med., 12 (2004) 19.
8. R.A. Gil, J.A. Gásquez, R. Olsina, L.D. Martinez, S. Cerutti, Talanta, 76 (2008) 669. 9. E. Kenduzler, A.R. Turker, Int. J. Environ. An. Ch., 86, (2006) 843.
10.M. Felipe-Sotelo, A. Carlosena, E. Fernandez, P. Lopez-Mahia, S. Muniategui, D. Prada, Talanta, 63 (2004) 735.
11.H. Eskandari, G.H.I. Karkaragh, Anal. Sci., 19 (2003) 1549. 12.M.J. Ahmed, M.N. Uddin, Chemosphere, 67 (2007) 2020.
13.C.J. Horng, P.-H. Horng, J.W. Hsu, J.-L. Tsai, Archives of Environ. Health, 58 (2003) 104. 14.M. Korolczuk, M. Grabarczyk, A. Moroziewicz, Electroanal., 19 (2007) 2155.
15.P. Campins-Falco, L.A. Tortajada-Genaro, S. Meseguer- Lloret, F. Bosch-Reig, Anal. Bioanal. Chem., 374 (2002) 1223.
16.M. Shamsipur, T. Poursaberi, S. Rouhani, K. Niknam, H. Sharghi, M.R. Ganjali, Anal. Sci., 17 (2001) 1049.
17.M.H. Mashhadizadeh, A. Moment, R. Razavi, Anal. Chim. Acta, 462 (2002) 245. 18.V.K. Gupta, A.K. Singh, S. Mehtab, B. Gupta, Anal. Chim. Acta, 566 (2006) 5. 19.A.K. Jain, V.K. Gupta, L.P. Singh, U. Khurana., Analyst, 122 (1997) 583. 20.M.H. Mashhadizadeh, I. Sheikhshoaie, Anal. Bioanal. Chem., 375 (2003) 708. 21.S.M. Ashtamkar, N.V. Thakkar, J. Indian. Chem. Soc. 79 (2002) 90.
22.A.K. Singh, R.P. Singh, P. Saxena, Sens. Actuator B, 114 (2006) 578.
23.M.R. Ganjali, F. Mizani, M. Emami, M. Darjezini, M.R. Darvich, M. Yousefi, Anal. Sci., 20 (2004) 531.
24.T.V. Velikanova, A.N. Titov, S.G. Mityashina, O.V. Vdovina, J. Anal. Chem., 56 (2001) 56. 25.I.M. El-Naggar, M.M. Abou-Mesalam, J. Hazard. Mater., 149 (2007) 686.
26.Gehad G. Mohamed, M.F. El-Shahat, A.M. Al-Sabagh, M.A. Migahed, Tamer Awad Ali, Analyst, 136 (2011) 1488.
27.Gehad G. Mohamed, Tamer Awad Ali, Mohamed F. El-Shahat, M.A. Migahed, A.M. Al-Sabagh, Drug Test. Anal., 4 (2012) 1009.
28.E.Y.Z. Frag, Tamer Awad Ali, Gehad G. Mohamed, Y.H.H. Awad, Int. J. Electrochem. Sci., 7 (2012) 4443.
29.Gehad G. Mohamed, Tamer Awad Ali, M. F. El-Shahat, A. M. Al-Sabagh, M. A. Migahed,
Electroanalysis, 22 (2010) 2587.
30.Gehad G. Mohamed, Tamer Awad Ali, M. F. El-Shahat, A. M. Al-Sabagh, M. A. Migahed, E. Khaled, Anal. Chim. Acta, 673 (2010) 79.
31.E. Khaled, Gehad G. Mohamed, T. Awad, Sens. Actuators B, 135 (2008) 74.
32.Tamer Awad Ali, Gehad G. Mohamed, E.M.S. Azzam, Ali A. Abd-elaal, Sens. Actuator B, 191 (2014) 192.
33.Tamer Awad Ali, Ahmed A. Farag, Gehad G. Mohamed, J. Ind. Eng. Chem. (2013).
35.Tamer Awad Ali, Gehad G. Mohamed, Maher M. El-Dessouky, Salwa M. Abou El Ella, Rabab T.F. Mohamed, Int. J. Electrochem. Sci., 8 (2013) 1469.
36.a) L. Guczi, D. Bazin, Appl. Catal. A 188 (1999) 163. b) Q. Tang, Q. Zhang, H. Wu, Y. Wang, J. Catal. 230 (2005) 384. c) P.A. Robles-Dutenhefner, K.A. de Silva Rocha, E.M.B. Sousa, E.V. Gusevskaya, J. Catal. 265 (2009) 72.
37.Y. Umezawa, K. Umezawa, H. Sato, Pure Appl. Chem., 67 (1995) 507.
38.F.A. Nour El-Dien, Gehad G. Mohamed, E.Y.Z. Frag, M.E. Mohamed, Int. J. Electrochem. Sci., 7 (2012) 10266.