International Journal of
ELECTROCHEMICAL
SCIENCE
www.electrochemsci.orgEffects of Synthesis Methods on the Performance of
LiNi
0.4Co
0.2Mn
0.4O
2Yang Wei, Zhang Hai-Lang*
School of Chemical and Material Engineering, Jiangnan University, Wuxi Jiangsu 214122,China;
*E-mail: [email protected]
Received: 9 July 2013 / Accepted: 27 July 2013 / Published: 20 August 2013
The layered cathode material LiNi0.4Co0.2Mn0.4O2 has been synthesized by sol-gel method ,solid-state
method and carbonate co-precipitation method, respectively. XRD, SEM, CV, EIS and electrochemical measurements were used to characterize the samples synthesized via different synthetic routes. The results show that the difference in preparation methods results in the difference in the structure, morphology of the prepared materials and electrochemical performance. LiNi0.4Co0.2Mn0.4O2 prepared
by the sol-gel method exhibited higher discharge capacity than LiNi0.4Co0.2Mn0.4O2 prepared by the
other two methods, its initial specific discharge capacity was 191.8 mAh/g (2.3-4.6V, 0.1C rate). However, the sample prepared by carbonate co-precipitation method showed better capacity retention when compared to the sample prepared by the other two methods, it exhibited the capacity retentions of 93.0% at 0.2C after 50 cycles.
Keywords: lithium batteries, LiNi0.4Co0.2Mn0.4O2, synthesis method, electrochemical performance
1. INTRODUCTION
LiCoO2 is the most widely used commercial cathode material for lithium secondary batterie,
but its application is limited because of the scarce cobal resources, high prices and a certain degree of toxicity. Therefore, the researchers put their attention to the other transition metal oxides,such as LiNiO2, and LiMn2O4. However, LiNiO2 suffers from safety and stability problems[1], LiMn2O4 has
serious capacity fading problem during cycling, especially under high temperature[2]. Layer-structured
LiNixCoyMn1-x-yO2 cathode material has attracted much attention for it integrates the features of
LiCoO2, LiNiO2, and LiMn2O4 with structural stability, high capacity, low cost, safety, and so on.
Thus, it became one of the most commercialization potential cathode material[3,4].LiNi1/3Co1/3Mn1/3O2
less expensive Co content can reduce the material cost and environmental pollution caused by production process. Ni contributed to more for the capacity, the higher the relative concentration of nickel in the material,the higher the specific capacity. While the increase of Mn concentration elevates the safety performance .Thus it is a cathode material that deserves more research works. However, this kind of material suffers from such drawbacks as shortage of cycling performance and poor rate capacities[5-7].
The microstructure, surface morphology and electrochemical properties of the cathode materials are fairly closely linked with the synthesis methods. The methods of preparing LiNixCoyMn 1-x-yO2 powders include co-precipitate method[8], hydrothermal method[9], solid-state method[10],
sol-gel method[11], spray drying process[12], rheological phase method[13], etc. In this paper, we synthesized LiNi0.4Co0.2Mn0.4O2 powders via three different methods, solid-state method, sol-gel
method and carbonate co-precipitation method. In addition, the morphological and electrochemical differences of LiNi0.4Co0.2Mn0.4O2 prepared by different methods were investigated.
2. EXPERIMENTAL
2.1. Synthesis of LiNi0.4Co0.2Mn0.4O2 powders by solid-state method
A stoichiometric amount of LiCH3COO·2H2O, Ni(CH3COO)2·4H2O, Mn(CH3COO)2·4H2O,
Co (CH3COO)2·4H2O were mixed with the citric acid used as a fuel, and then grind them fully in an
agate mortar. The initial product was dried at 120oC for 8h and then heated at 500oC for 6h to eliminate the organic residues. The final powders (denoted as SP) were gained by a thorough grounding step, a final calcining at 850oC for 20h in air and followed by quenching to room temperature.
2.2. Synthesis by sol–gel method
LiNi0.4Co0.2Mn0.4O2 powders were prepared via a sol-gel process using citric acid as chelating
agent. A stoichiometric amount of LiCH3COO·2H2O, Ni(CH3COO)2·4H2O, Mn(CH3COO)2·4H2O and
Co (CH3COO)2·4H2O were dissolved in distilled water, and then added the aqueous solution of citric
acid into the mixture metal solution. The molar ratio of citric acid to total metal ions was unity. The pH of the solution was adjusted in the range 7–8 by adding ammonium hydroxide. The reagent solution was stirred continuously at 80oC until form homogeneous sol and gel. The resulting gel was dried at 120oC for 8h and then heated at 500oC for 6h to eliminate the organic residues. The final powders (denoted as SG) were gained by a thorough grounding step, a final calcining at 850oC for 20h in air
and followed by quenching to room temperature.
2.3. Synthesis by carbonate co-precipitation method
For preparing transition metal carbonate powder Ni0.4Co0.2Mn0.4CO3, we used LiOH·H2O,
materials. The stoichiometric amounts of Ni(CH3COO)2·4H2O, Mn(CH3COO)2·4H2O,
Co(CH3COO)2·4H2O were dissolved together in distilled water in beaker A (Solution A). The proper
amount of Na2CO3 also dissolved in distilled water in beaker B (Solution B). Each solution was slowly
poured into another beaker (Solution A+ B) with heating at 80℃ until sediment formed. The pH value of the coprecipitation solution was maintained via carefully adding ammonia. The obtained Ni0.4Co0.2Mn0.4CO3 complex after washing and drying was mixed with LiOH·H2O and calcined at
500℃ for 6 h in air. The final powders (denoted as CP) were gained by a thorough grounding step, a final calcining at 850oC for 20h in air and followed by quenching to room temperature.
The X-ray diffraction (XRD) with Cu Kα radiation operated at 40kV and 40mA was used to
analyze the crystalline structure of samples. The scan data were in the 2θ range from 10o to 90o in step
of 4o/min. The size and morphology of the sample were visualized using SEM performed on S4800 microscope with 5 kV.
Electrochemical experiments were performed using two-electrode coin cells. The composite cathodes were made by dispersing active material (80 wt.%), acetylene black (12 wt.%), and PVDF (8 wt.%) to form a slurry, The slurry was pasted onto Al foil then pressed at 10MPa and dried at 120°C for 10h in a vacuum oven. The CR2032 coin cells were assembled in an argon-filled glove box using lithium metal as the counter electrode, Celgard 2325 as the separator, and 1 M LiPF6 in 1:1 EC:DMC solution as the electrolyte. Charge–discharge performance of the cells was evaluated within different cut-off voltages and at different discharge rates at room temperature using LAND CT2001A electrochemical test instrument.
The cyclic voltammogram (CV) curves were obtained between the cut-off voltage ranges of 2.5-4.8V on an IM6 Electrochemical workstation at a scan rate of 0.1mV/s.
Electrochemical impedance spectroscopy (EIS) was measured with IM6 Electrochemical workstation. The ac perturbation signal was ±5mV and the frequency range was from 0.05Hz~ 100 kHz.
3. RESULTS AND DISCUSSION
Fig. 1 shows XRD patterns of LiNi0.4Co0.2Mn0.4O2 (SG, CP and SP). All of the peaks can be
indexed on the basis of a layered structure of α-NaFeO2 structure (space group: R-3m). The clear split
of the (006)/(102) peaks and(018)/(110) peaks for SG and CP samples manifest the formation of well hexagonal layered ordering structure[14]. However, careful examination of the diffraction pattern for the SP sample shows the absence of splitting for (006)/(012) reflections indicating lack of a perfectly layered structure. The lattice parameters of LiNi0.4Co0.2Mn0.4O2 (SG, CP and SP) cathode materials are
illustrated in Table 1. The integrated intensity ratio of the (003) to (104) in the XRD patterns is sensitive to the degree of cation mixing in lattice[15] and a value of I(003)/I(104) <1.2 is an indication of
c/a, the better well-defined layered structure [16]. The same conclusion have been obtained by comparing the value of c/a of SG, CP and SP samples.
0 20 40 60 80 100
0 200 400 600 800 1000
In
te
n
s
it
y
/
a
.u
.
2 θ / (°)
SP CP SG
(1
1
3
)
(1
0
8
)/
(1
1
0
)
(1
0
7
)
(1
0
5
)
(1
0
4
)
(0
0
6
)/
(1
0
2
)
(1
0
1
)
(0
0
3
[image:4.612.193.418.124.296.2])
Figure 1. XRD patterns of LiNi0.4Co0.2Mn0.4O2 prepared by different methods.
Table 1. Lattice parameters of LiNi0.4Co0.2Mn0.4O2 prepared by different methods
sample a(Å) c(Å) c/a I(003)/I(104)
SG 2.87509 14.26794 4.963 1.24 CP 2.87212 14.26661 4.967 1.25 SP 2.87504 14.25867 4.959 1.04
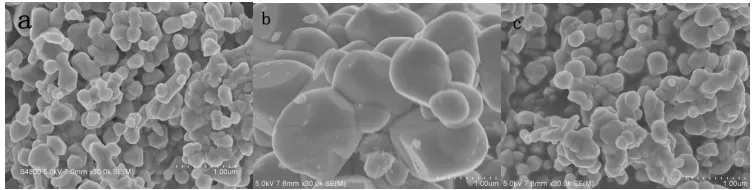
SEM micrographs of the three samples of LiNi0.4Co0.2Mn0.4O2 (SP, SG and CP) are illustrated
in Fig.2. The particle prepared by sol-gel method is composed of very uniform and small nano-crystallites with particle size about 200–400 nm. SG powder with a high surface area would have high surface reactivity.
Figure 2. SEM micrographs of LiNi0.4Co0.2Mn0.4O2 samples: (a) sol-gel method, (b) co-precipitation
[image:4.612.117.495.561.656.2]SP-sample consists of particles with no characteristic morphology and most grains are badly aggregated, unfortunately, this can lead to descend of electrochemical capability of the sample. The size of the particle prepared by carbonate co-precipitation methods is about 1-2µm, Dahn and
co-workers [17] recently reported that larger particles result in a higher tap density. As is well known, the distinctions of SP, SG and CP in size, morphology and surface area would lead to differences in their electrochemical performance.
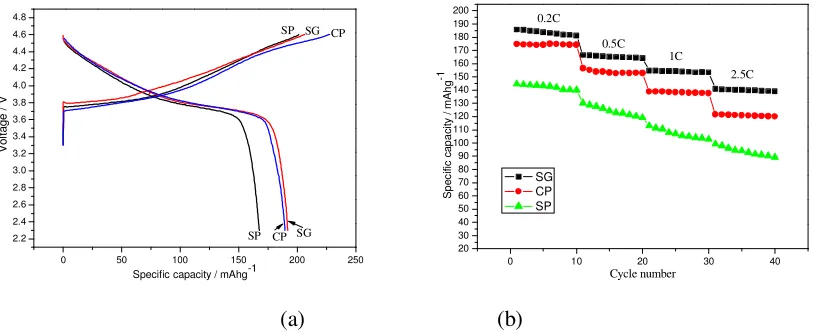
Fig.3 (a) shows the initial charge-discharge curves of LiNi0.4Co0.2Mn0.4O2 (SG, CP and SP) in
the range of 2.5–4.6V at 0.1C rate at room temperature. As can be seen from the figures, the obtained SG, CP and SP cathodes can deliver discharge capacities of 191.8, 189.5 and167.6mAh/g, respectively, with initial coulombic efficiencies of 92.93%、83.33% and 83.25%.As we can see, for all of the samples, at the beginning of the charging process, the voltage suddenly increases to about 3.7V and holds at 3.7-4.0V, and then significantly rises to 4.6 V in the case of sample SG. However, in the case of sample CP and SP, it increases at first to 4.5V rapidly, and then gradually climbs up to 4.6V, accompanied a narrow plateau around 4.5V. Fig.3 (b) shows the discharge curves and cycling performance of LiNi0.4Co0.2Mn0.4O2 (SG, CP and SP) in the range of 2.0-4.6V at various rates from 0.2
C to 2.5C. The as seen in Fig.3 (b), the rate was increased from 0.2 to 2.5C stepwise, the sample SG shows higher discharge capacity than the other two samples. That is because the nano-sized particles synthesized by sol–gel method can greatly reduce the diffusion paths for Li ions, the insertion and de-insertion of the Li+ in this material are expected to be faster thus enhancing the discharge capacity of this sample.
0 50 100 150 200 250
2.2 2.4 2.6 2.8 3.0 3.2 3.4 3.6 3.8 4.0 4.2 4.4 4.6 4.8 V o lt a g e / V
Specific capacity / mAhg-1
SG
SP CP
SG SP CP
0 10 20 30 40
20 30 40 50 60 70 80 90 100 110 120 130 140 150 160 170 180 190 200 S p e c if ic c a p a c it y / m A h g -1 Cycle number SG CP SP 2.5C 1C 0.5C 0.2C
(a) (b)
Figure 3. (a)Initial charge-discharge curves of LiNi0.4Co0.2Mn0.4O2 samples synthesized by different
methods; (b)Cycle performance of LiNi0.4Co0.2Mn0.4O2 electrode prepared by different methods
at different discharge rates.
[image:5.612.105.513.408.575.2]attribute to the oxidation of Ni2+/Ni4+ and Co3+/Co4+ couple, and the corresponding anodic peaks center around 3.6 and 4.5 V, respectively[18]. But, compared with SG sample, a large irreversible anodic peak above 4.5V can be found for the CP and SP samples. Not coincidentally, the irreversible anodic peak correspond to the plateau around 4.5V in the initial charge-discharge curves. That is why, the sample SG shows higher initial coulombic efficienciey than the other two samples. The reason for the existence of the irreversible anodic peak above 4.5V may have something to do with the preparation method, we think that its origin is in fact correlated to the true chemical composition of sample. CP sample and SP sample should be considered as a solid solution of a layered compound of Li-Ni-Mn-Co-O with Li2MnO3[19], such as LiNi0.4Co0.2Mn0.4O2-Li2MnO3 since the plateau around 4.5V was
usually observed in the solid solution of LiNi1/3Co1/3Mn1/3O2-Li2MnO3 [20]. On the other hand, this
smaller potential difference indicates the weaker electrode polarization is, which ensures reduced capacity fade during cycling[21]. It is quite clear that the potential difference of the major peak of CP sample is minimal, it would show the best capacity retention.
2.5 3.0 3.5 4.0 4.5 5.0
-0.0015 -0.0010 -0.0005 0.0000 0.0005 0.0010 0.0015 0.0020 C ur en t( A ) Potential(V)vs.Li/Li+ SG
2.5 3.0 3.5 4.0 4.5 5.0
-0.0015 -0.0010 -0.0005 0.0000 0.0005 0.0010 0.0015 0.0020 0.0025 CP C ur en t( A ) Potential(V)vs.Li/Li+
2.5 3.0 3.5 4.0 4.5 5.0
[image:6.612.121.490.310.393.2]-0.0010 -0.0005 0.0000 0.0005 0.0010 SP C ur en t( A ) Potential(V)vs.Li/Li+
Figure 4. Cyclic voltammogram curves of LiNi0.4Co0.2Mn0.4O2 samples prepared by different methods
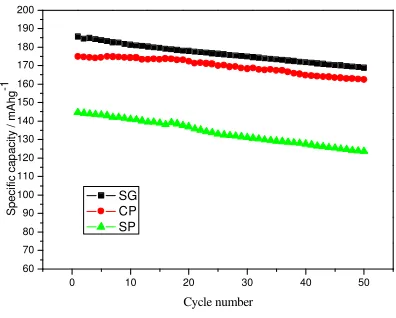
Fig. 5 represented the capacity retention of LiNi0.4Co0.2Mn0.4O2 (SG, CP and SP) at 0.2C
between 2.0 and 4.6 V at room temperature.
0 10 20 30 40 50
[image:6.612.203.401.519.678.2]60 70 80 90 100 110 120 130 140 150 160 170 180 190 200 S p e ci fi c ca p a ci ty / m A h g -1 Cycle number SG CP SP
The first discharge capacities of SG sample, CP sample and SP sample are 185.6, 174.8 and 144.6mAh/g, with the capacity retention ratio of 90.9%、93.0% and 85.5% after 50cycles, respectively. The CP electrode exhibits better cycling performance than SG sample, this is because the increased surface area of the larger particles prepared bysol-gel method, increases the insulating film formation due to increased decomposition reactions with the electrolyte during cycling. This insulating surface film would block the direct interconnections between the active particles and the electrolyte, and this would deteriorate the charge transfer reactions between the active particles and the current collector, causing an increase in charge transfer resistance. The SP sample has maximum cation mixing among all the three methods and shows poor electrochemical performance.
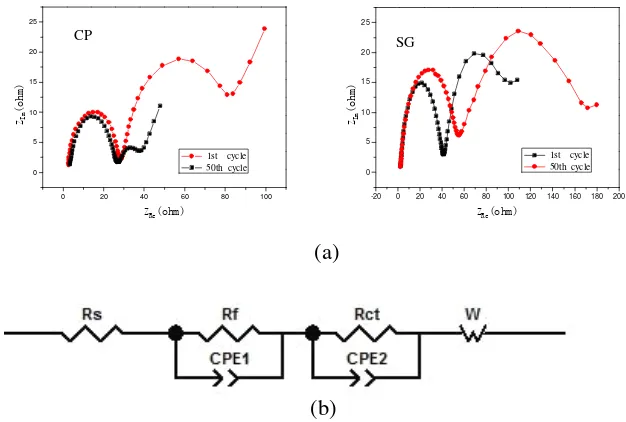
In order to further explain the difference in electrochemical performances of the LiNi0.4Co0.2Mn0.4O2 samples synthesized by different methods, EIS measurements were carried out on
SG sample and CP sample at the terminated voltage of 4.0V after 1 and 50 cycles, respectively. Fig. 6(a) illustrates the EIS curves of the test cells with SG sample and CP sample. The equivalent circuit is also shown in Fig. 6 (b).We can see the EIS curves consist of two semicircles in high frequency range and a quasi-linear line (W) in low frequency range, in which the first semicircle in high frequency range reflects the lithium-ion migration resistance through the interface between the surface layer of the material particles and the electrolyte (Rf); the other arc in intermediate frequency range reflects charge-transfer resistance (Rct).
0 20 40 60 80 100 0
5 10 15 20 25
1st cycle 50th cycle
ZIm
(o
h
m)
ZRe(ohm)
CP
-20 0 20 40 60 80 100 120 140 160 180 200 0
5 10 15 20 25
1st cycle 50th cycle
ZIm
(o
hm
)
ZRe(ohm)
SG
(a)
[image:7.612.144.457.368.579.2](b)
Figure 6. (a) EIS curves of SG sample and CP sample; (b) equivalent circuit of EIS
cycle then enlarges drastically to 110Ω at the 50th cycle. By contrast, the diameter of the second
semicircle of CP sample only increase from 10.6 Ω at the first cycle to 52.3Ω at the 50th cycle. This
showed that the charge transfer resistance of SG sample is higher than that of CP sample. Experimental results have validated the above conclusion that we've got in charge-discharge test.
4. CONCLUSION
LiNi0.4Co0.2Mn0.4O2 has been prepared by three different synthetic routes, sol-gel method ,
solid-state method and carbonate co-precipitation method,respectively. The difference in preparation method leads to the difference in morphology and the difference in the electrochemical performance. The LiNi0.4Co0.2Mn0.4O2 prepared by sol-gel method delivered a higher capacity than electrode
prepared by two other methods owing to shorter diffusion length and higher surface area. whereas CP-sample showed better capacity retention than the other two CP-samples due to lower surface area and hence decreased side reactions with the electrolyte.
References
1. Hajime Arai, Shigeto Okada, and Yoji Sakurai, J Power Sources, 68 (1997) 716. 2. Y.K.Sun, Y.S.Jeon, and H.K.Lee, Electrochem And Solid-State Lett, 3 (2000) 7. 3. T. Ohzuku, Y. Makimura, Chem Lett ,7 (2001) 642.
4. K. M. Shaju, G. V. Subba Rao, and B. V. R. Chowdari, Electrochim Acta, 48 (2002) 145. 5. B. J. Hwang, Y. W. Tsai, D. Carlier, and G. Ceder, Chem. Mater, 15 (2003) 3676.
6. S.H. Park, C.S. Yoon, S.G. Kang, H.-S. Kim, S.-I. Moon, and Y.-K. Sun, Electrochim. Acta, 49 (2004) 557.
7. J.Choi , A. Manthiram, J. Electrochem. Soc., 152 (2005) A1714.
8. C. Deng, S. Zhang, L. Ma, Y.H. Sun, S.Y. Yang, B.L. Fu, F.L. Liu, and Q. Wu, J. Alloys and Compounds, 509 (2011) 1322–1327.
9. F. Wu,M. Wang,Y.F. Su,L.Y. Bao, and S. Chen, J Power Sources, 195 (2010) 2362. 10. A. Mahmoud, M. Yoshita , I. Saadoune, J. Broetz , K. Fujimoto, and S. Ito ,Mater. Res. Bull., 47
(2012) 1936.
11. G. Singh , A. Sil , S. Ghosh , and A. Panwar, Ceramics International, 36 ,(2010) 1831. 12. L.Q. Zhang, D.Ch. Li, X.Q. Wang, H. Noguchi, and M. Yoshio, Mater. Lett., 59 (2005) 2693. 13. X.Y. Han, Q.F. Meng, T.L. Sun, and J.T. Sun, J Power Sources, 195 (2010) 3047.
14. J. Wang, B. Qiu, H.L Cao, Y.G. Xia, and Zh.-P. Liu, J Power Sources, 218 (2012) 128. 15. B.J. Hwang, R. Santhanam, J. Power Sources, 114 (2003) 244.
16. X.Y. Zhang, W.J. Jiang, A. Maugerc, L.Qi, F. Gendron, and C.M. Julien, J. Power Sources, 195 (2010) 1292..
17. S. Jouanneau, K.W. Eberman, L.J. Krause, and J.R. Dahn, J. Electrochem. Soc, 150 (2003) A1637.
18. K. M. Shaju, G. V. Subba Rao, and B. V. R. Chowdari, Electrochim. Acta, 48(2002)145. 19. J. Choi, A. Manthiram, J. Power Sources ,162 (2006) 667.
20. Christopher S. Johnson, Naichao Li, Christina Lefief, John T. Vaughey, Michael M. Thackeray, Chem. Mater 20 (2008) 6095-6106.