Environmental Research Communications
LETTER • OPEN ACCESS
Comparing consumer perceptions of appliances’ electricity use to
appliances’ actual direct-metered consumption
To cite this article: Vedran Lesic et al 2019 Environ. Res. Commun. 1 111002
View the article online for updates and enhancements.
LETTER
Comparing consumer perceptions of appliances
’
electricity
use to appliances
’
actual direct-metered consumption
Vedran Lesic1,6 , Brock Glasgo2 , Tamar Krishnamurti2,3 , Wändi Bruine de Bruin1,2 ,
Matthew Davis4 and Inês Lima Azevedo5
1 Centre for Decision Research, Leeds University Business School, United Kingdom 2 Engineering and Public Policy, Carnegie Mellon University, United States of America
3 General Internal Medicine, University of Pittsburgh School of Medicine, United States of America 4 Socio-Technical Center, Leeds University Business School, United Kingdom
5 Department of Energy Resources Engineering, School of Earth, Energy & Environmental Science, Stanford University, United States of
America
6 Author to whom any correspondence should be addressed.
E-mail:[email protected],[email protected],[email protected],[email protected],[email protected]
Keywords:consumer perceptions, residential, energy efficiency Supplementary material for this article is availableonline
Abstract
Many strategies for reducing residential energy consumption
—
including product labelling programs,
subsidies for the purchase of ef
fi
cient devices, behavioral programs that encourage ef
fi
cient energy
use, and others
—
rely on building owners and end users to make informed investment and operational
decisions. These strategies may be ineffective if consumers are unaware of how much electricity is used
by different devices in their homes and buildings. This study therefore compares consumers
’
perceptions of their appliances
’
electricity use to these appliances
’
actual direct-metered electricity
consumption. Using an online survey, 118 homeowners from Austin, Texas were asked to estimate the
energy consumption of six household devices which were monitored in the participants
’
homes.
Homeowners were randomly assigned to assess their appliance-speci
fi
c electricity use in terms of
energy units
(
kWh
/
month
)
or energy cost units
(
$
/
month
)
for an average summer month. Consistent
with previous studies, participants overestimated the energy consumed by their low energy consuming
devices and slightly underestimated that of their most energy-consuming device. Results also showed
that responses of the experimental groups estimating their consumption in energy units and energy
cost units were similar, the accuracy of the two groups
’
perceptions was similar, and levels of
con
fi
dence in the two groups were similar. These results suggest that targeted information campaigns
focused on air conditioning energy consumption and device power reduction opportunities could
improve consumer decision-making to save energy and reduce demand.
1. Introduction
The Intergovernmental Panel on Climate Change(IPCC)warns that global greenhouse gas emissions from the energy sector must be drastically reduced within the next 50 years to curb the risks of climate change[1]. In the United States and European Union, policy makers are paying increasing attention to residential and commercial buildings as a potential source of major reductions in energy consumption that will help meet that target. These building sectors together account for around 40% of total energy consumption in these nations and are well understood to have huge potential for cost-effective energy savings that can both reduce greenhouse gas emissions and improve the reliability of the electric grid[2–4]. Many existing and proposed strategies for realizing potential savings—including product labelling programs, subsidies for the purchase of efficient OPEN ACCESS
RECEIVED
13 May 2019
REVISED
25 September 2019
ACCEPTED FOR PUBLICATION
3 October 2019
PUBLISHED
21 October 2019
Original content from this work may be used under the terms of theCreative Commons Attribution 3.0 licence.
Any further distribution of this work must maintain attribution to the author(s)and the title of the work, journal citation and DOI.
devices, behavioral programs that encourage efficient energy use, and others—rely on building owners and end users to make informed investment and operational decisions. Such strategies may be ineffective if consumers are unaware of how much electricity is used by different devices in their homes and buildings.
Over the past 50 years, a limited number of previous studies have attempted to better understand consumer perceptions of their utility use and their possible effects on consumer decision making[5]. An even smaller
number of studies compared consumers’perceptions to actual energy use or savings[5]. Those studies
contrasting perceived and actual energy use have predominantly found mismatches between the two. Attariet al provided novel insight on understanding the misperceptions of appliances’energy use by comparing
consumers’perceptions of energy use with estimated energy data from sources such as the US Department of Energy, Alternative Energy Store and others[6]. In that study, participants were provided with a reference point
of a 100 Watt incandescent light bulb and were then asked to estimate the number of energy units typically used in one hour by nine other household appliances, including light bulbs, laptops, stereos, desktop computers, room air conditioners, space heaters, dishwashers, central air conditioners, and electric clothes dryers. Results showed that participants made small overestimations for low-energy appliances(such as light bulbs and laptops) and large underestimations for high-energy appliances(such as air conditioners and dryers). These
misperceptions were attributed to participants’use of an anchoring-and-adjustment heuristic, with the light bulb serving as a natural guide for their numerical estimates. Fredericket alchallenged the validity of those findings by showing that by changing the reference device to lower- and higher-energy consuming devices, estimated energy consumption for the various appliances were, respectively, much lower and higher. Further, varying the units in which participants responded between watts and kilowatts led to large under- and overestimates, respectively[7]. Reporting a similar pattern of misperceptions as Attariet al[6], Baird and Brier
showed that participants’perceptions of appliance-specific energy use may depend on the physical dimensions of the appliances as participants perceived that smaller appliances consumed less energy[8]. Schley and DeKay showed that estimated energy use was larger for appliances that were used more often[9]. In their paper,
appliances that are more frequently interacted with were perceived as consuming more energy than others. Chen et alprovide a unique comparison of surveyed energy consumption estimates of three categories of residential appliances—heating/cooling, plug load, and lighting—to measured energy consumption from participants’ homes[10]. Although that study did not evaluate consumers’perceptions of appliance-level electricity use, it found misperceptions consistent with those reported by Attariet al[6], such that low-use appliance categories
were overestimated and high-use appliance categories were underestimated. These papers and others are summarized in the recent review by Lesicet al[5].
Studies have also examined communications of energy use. In a study on smart meters, consumers preferred that their energy use was presented in monetary units(e.g., dollars)instead of kilowatt-hours or carbon dioxide emissions[11]. Another study on preferences for feedback about household electricity use showed that
consumers wanted to receive monetary cost metrics over specific time periods, appliance-specific energy use breakdowns, and comparisons of their energy use over time[12]. We found no studies that examined whether
consumers would be more accurate when assessing the electricity consumption of specific appliances in monetary units instead of other metrics.
Here, we present thefirst study to evaluate whether consumers have more accurate perceptions of their devices’energy consumption when giving their assessments in energy units or energy cost units. To account for variation in energy consumption between homes, device-level submeter electricity use data from the study participants’homes are combined with results from an online survey administered to these same homeowners. Because our study focused on a diverse set of specific household appliances that are commonly used, our findings will be uniquely actionable for policy and program designers responsible for designing programs and information campaigns aimed at reducing household energy use.
The study explores the following research questions:
1. Do consumers give more accurate estimates of their devices’energy use when they report in energy units versus energy cost units?
2. Do consumers give more accurate ranks of their devices’energy use when they report in energy units versus energy cost units?
3. Are consumers more confident in their perceptions when reporting in energy units versus energy cost units?
The rest of this paper is organized as follows. Wefirst describe our methods and data collection, then present the results, and end with a discussion of their implications.
2. Methods and data
2.1. Participants
Participants in this study were recruited from the Pecan Street Research Institute’s smart grid research project in Austin, Texas[13]. Homeowners from the greater Austin area volunteered to participate in Pecan Street’s research trials, the most prominent of which involves the installation of electrical submeters on individual appliances and circuits in participating homes. As part of their involvement with ongoing Pecan Street research, all active participants were given access to an online feedback platform that summarized and displayed their devices’energy consumption, energy cost, historical energy use, and related summary statistics. A typical dashboard view of one such online report can be seen in appendix A. Approximately 81% of participants reported in this study that they checked their dashboard at most once or twice per month. Participants from the Pecan Street’s smart grid research project were eligible to participate in this study if they had sub-meters for at least four household appliances during the summer of 2014.
2.2. Survey design
A link to an online survey was emailed by the Pecan Street Research Institute to 310 qualifying participants and was open from October 24 through November 28, 2014. The survey posed questions aimed at eliciting homeowners’understanding of their devices’energy consumption. Here, we describe the questions relevant to the presented analyses.
All participants were randomized to estimate—in either energy units(kWh/month)or energy cost units ($/month)—the electricity consumption of their clothes washers, dishwashers, ovens, clothes dryers,
refrigerators, and air conditioners. These six devices were chosen as they are common in American households, they vary significantly in their monthly energy consumption, they are widely submetered in the Pecan Street households, and they account for approximately 50% of total household electricity use. The survey asked participants to consider their usage of these devices during an average summer month as they responded. The summer months were chosen because air conditioning consumption is the highest and does not vary
significantly month-to-month over during this time period.
Following previous work[6], the energy units and energy cost units experimental groups were provided with a reference point which explained that a 100-Watt incandescent light bulb used for one hour per day for 30 days would consume 3 kWh or $0.30 of electricity, respectively. Depending on their randomly assigned experimental group, they were then asked to estimate the electricityconsumptionor electricitycostof those six devices by sliding a bar along an axis to indicate lower or higher energy consumption. End points were chosen to be nearly equivalent in both groups and were labeled 0 and 1000 kWh and $0 and $100 for the energy units and energy cost units groups, respectively. If a participant did not have one of the appliances, they could select‘not applicable’. Next, participants were asked to indicate their level of confidence about the estimates of their devices’energy consumption they provided in the previous task by selecting from four possible options ranging from‘I believe I correctly judged all the appliances’to‘I pretty much had to guess the electricity use of all the appliances’. Participants were then asked to explain the rationale behind their estimates by entering a short description. Finally, participants answered questions about their electricity bills, participation in efficiency programs, and their use of their online energy dashboard displays. Near the end of the survey, participants answered socio-demographic questions about their age, sex, level of income, level of education and number of adults and children in the home. Complete copies of both surveys can be found in appendix B.
2.3. Survey responses
A total of 130 responses were recorded for a response rate of 42%. Homes with incomplete energy use data for June through August of 2014 were excluded, resulting in afinal sample size of 118 responses. All participants gave informed consent, and were offered a $5 Amazon voucher for completing the online survey.
2.4. Electricity use data
Whole-home and device-level electricity use data were downloaded from the Pecan Street Inc.’s online Dataport database[14]. These data were generated by submeters installed in each home and made available to researchers.
Hourly interval data were downloaded and summed to calculate monthly electricity consumption for each appliance.
Annual electricity consumption for the homes and devices in this study are summarized in table1. Also shown are Department of Energy(DOE)estimates of the electricity consumed by standard homes and appliances. Whole-home consumption estimates were taken from the EIA’s Residential Energy Consumption Survey(RECS)and represent similar single-family homes in Texas with central air conditioning, similar to those in the Pecan Street sample.
These values show that Pecan Street consumers used less energy on average than consumers in similar Texas homes, both at the whole-home level and for specific devices. Glasgoet al[18]found similar differences between the energy consumption of the Pecan Street homes, other residential customers served by the same electric utility provider, and Texas homes included in the RECS. The same study[18]also found that Pecan Street homes were on average smaller, had fewer occupants, and had much higher household incomes compared to the regionally representative sample included in the RECS.
3. Results
3.1. Accuracy of estimates
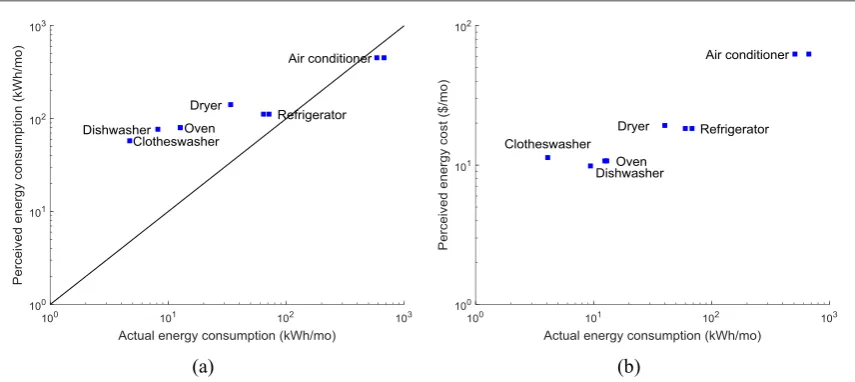
To assess the accuracy of participants’perceptions,figure1compares their perceived electricity use with the actual metered electricity use in their homes. The x-axes show actual energy consumption for individual appliances, and y-axes show perceptions for participants responding in energy units and participants
responding in energy cost units infigures1(a)and(b), respectively. All data points show average values for each experimental group and appliance. Some participants’households have multiple AC condensing units, refrigerators, and ovens. For these devices, two data points are shown: one that reflects the average energy consumption of the primary device, and one that includes the average energy use of all such devices.
The electric utility serving the Pecan Street homes uses a multi-tiered rate structure comprised of bothfixed and variable charges that precludes direct conversion of device-level monitored electricity consumption to an equivalent monthly energy cost. Thus, while the results of the group estimating their energy use in kWh can be compared to metered energy use data in the same units, those who responded in energy cost units cannot.
Figure1(a)shows the results of the energy units group, with the diagonal line corresponding to perfect agreement between perceived and actual energy use. Consistent with Attariet al[6], participants overestimated
the energy consumed by their low energy consuming devices and slightly underestimated that of their most energy-consuming device—their air conditioners. For the overestimated appliances, average perceived energy consumption ranged from around 60 to 140 kWh/month, but actual average consumption ranged from around 5 to 70 kWh per month. While responses were inaccurate relative to actual consumption, participants correctly perceived the variation in energy consumption between these devices.
[image:5.595.191.482.83.206.2]Figure1(b)shows the results of the energy cost units group. Because the exact cost of the energy consumed by individual devices cannot be determined precisely, participants’estimated costs are instead used to rank the six devices from lowest to highest energy cost. These rankings can be compared to each home’s actual ordinal ranking as determined by measured energy consumption. Using this metric,figure1(b)shows that participants on average correctly perceive their air conditioner as the device in the home that consumes the most electricity. The order of the next two most energy-consuming devices—refrigerators and electric clothes dryers—is reversed, but average energy cost estimates for these two varied by less than $1/month.
Table 1.Summary statistics of the annual electricity use of Pecan Street and Department of Energy standard homes.
Pecan street Department of energy Energy use Mean SD Mean Source Whole-home(kWh yr−1) 11,400 7,100 16,500 [15]
AC condensing unit(kWh yr−1) 3,500 2,400 5,400 [15]
Refrigerator(kWh yr−1) 1,300 2,000 1,400 [15]
Electric clothes dryer(kWh yr−1) 490 300 1,000 [16]
Oven(kWh yr−1) 190 140 820 [17]
Dishwasher(kWh yr−1) 120 150 120 [16]
Clothes washer(kWh yr−1) 50 50 110 [16]
Estimated energy consumption and estimated energy costs were compared to actual consumption by calculating Spearman rank correlations which compare the ordinal rankings of devices inherent in participants’ estimates and the actual ordinal rankings of the devices based on metered energy use data. The average Spearman rank correlation in the energy units group wasρ=0.82(SD=0.32), and the average in the energy cost units group wasρ=0.76(SD=0.38). A two-tailed t-test shows no difference in the Spearman rank correlations calculated for the two experimental groups(t(106)=0.86, p>.05). Thus, the format of reporting units did not significantly affect the accuracy of participants’perceptions of their electricity use for different appliances.
When asked to briefly explain how they generated their estimates, many participants mentioned their frequency of interaction with individual devices and the overall amount of time devices are in operation. Far fewer mentioned the power those devices require to operate. Details can be found in appendix C.
Analysis of individual perceptions show skewed distributions with modes at or near zero error for all six devices. Thus, many participants had very accurate perceptions of their energy consumption. The overall average errors seen infigure1are the result of relatively few responses with large, consistent over- or underestimates. Details can be found in appendix D.
3.2. Accuracy of ranks
Using the same Spearman rank-ordering method, average participants’rankings for appliances’energy use were compared to rankings of appliances’actual use for the two experimental groups infigure2. Appliances are listed from left to right in order of increasing rank. Average rankings by the energy units group increased in line with appliances’increasing energy consumption. However, participants in the cost units group typically ranked the three least energy-consuming devices incorrectly. Kendall’s tau tests comparing appliance rankings between the two test groups show no statistically significant differences(p>0.05 for all appliances). The apparent differences between these rankings and those which can be deduced from the scatterplots above are the result of individual misperceptions affecting the averages shown infigure1.
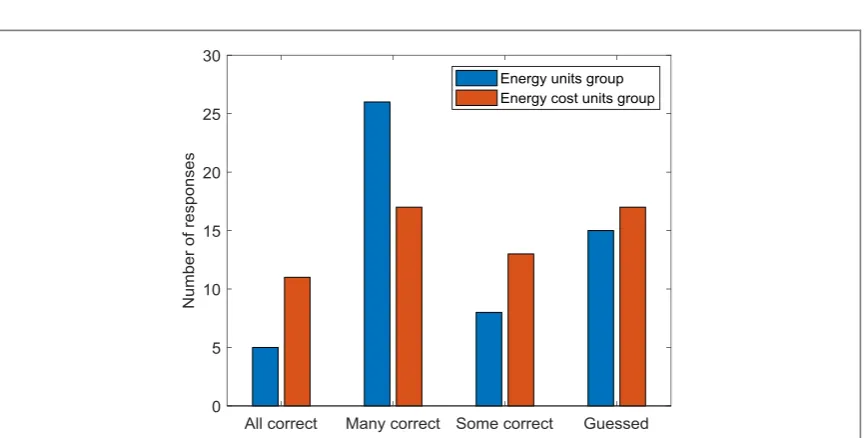
3.3. Confidence in perceptions
Figure3shows participants’reported confidence.
Univariate ANOVA was computed in order to examine the effects of reporting units on participants’ratings of their confidence. The main effect of reporting units conditions, F(1, 115)=0.23, p>.05 was not significant. This means that there was no significant difference in levels of reported confidence among participants.
[image:6.595.123.551.62.253.2]Comparing reported confidence to the Spearman rank correlations for households in each category shows that participants with higher confidence in their responses did indeed have more accurate perceptions as seen in appendix E.
4. Discussion
Using direct-metered device-level electricity use data from participants’homes, this study found that even energy-conscious homeowners with access to reports of their device-level energy consumption have
misperceptions of how much energy their devices consume. Consistent with Attariet al[6], homeowners tended to overestimate the energy consumed by their least energy-consuming devices. Homeowners overestimated the consumption of all but their most energy-consuming device—their central air conditioners. Still, many consumers in our sample had relatively accurate perceptions of the rank order of their devices’energy consumption, with the average results reflecting large over- and underestimates by relatively few homeowners for most devices.
[image:7.595.117.553.60.299.2]We also examined the effects of reporting in energy units versus energy cost units on consumers’perceptions of their energy use, the accuracy of those perceptions, and confidence in those perceptions. While previous studies suggested that consumers prefer more familiar cost units over energy units, our participants’responses
Figure 2.Average ranking of devices by perceived energy consumption. Error bars show±1 standard deviation. Appliances are listed from left to right by average annual energy consumption. A rank of 1 corresponds to the most energy consuming device, and 6 corresponds to the least consuming device.
Figure 3.Participants’reported confidence in their estimates of device-level energy consumption.
[image:7.595.122.555.359.578.2]to the estimation and ranking tasks showed no statistically significant differences in the perceptions, accuracy, or confidence in responses between the two groups[11,12,19].
Participants were generally able to identify the three most and three least energy consuming devices in their homes, but could not accurately quantify the energy consumption or order of these devices beyond the most energy-consuming device—their central air conditioners. While participants seem to recognize the variation in energy consumption between the relatively low energy consuming dishwashers, ovens, and clotheswashers, their perceptions of the absolute consumption of these devices were overestimated.
Participants’focus on the amount of time devices are operating rather than the combination of time and power aligns with thefindings of Attariet al[6], which found that people associated energy savings more with reducing the time that devices were operating than replacing the device with a more efficient version. Both findings suggest that consumers fail to fully appreciate the effect that device power has on energy consumption.
The main limitation of this research design is the use of a convenience sample. All participants in this study are volunteers in the Pecan Street Research Institute’s submetering study that allows them to access detailed online summaries of their whole-home and device-level electricity use. These homeowners represent early adopters of energy services who are highly educated, relatively wealthy, and predominantly white. This population has also undergone several energy-related interventions and studies which make them much more energy-conscious and knowledgeable than average consumers. Most prominently, the surveyed households have access to online portals which provide homeowners the exact information this survey was intending to have participants estimate. Many participants reported checking their online feedback energy reports. Thus some of the responses are a result of direct knowledge of their devices’energy consumption and the overall accuracy of the responses is overestimated.
Our results highlight the difficulty of building and maintaining the kind of consumer energy awareness that would enable efficiency-promoting investment and operational decisions. Even energy-conscious homeowners with access to reports of their devices’energy consumption have misperceptions about their devices’energy consumption. The patterns of these misperceptions confirm the results of previous studies, indicating that data based on estimates from existing data sources and previous literature could be used as a reliable proxy for real-time measured electricity use. That these misperceptions still exist even in a population with access to metered device-level energy consumption data proves how persistent they are.
Understanding consumers’misperceptions can help to inform the design of policies and programs that will allow consumers to make their homes consume less energy. Consistent in this study and Attariet al[6]is an underestimation of the energy consumed by central air conditioning systems. These systems present several behavioral and technological opportunities for homeowners to reduce their energy consumption through measures such as improved controls and setbacks, building envelope improvements, and regular preventive maintenance. Well-designed information campaigns to inform homeowners of their systems’consumption, their options for reducing that consumption, and the expected cost savings from those reductions would likely increase adoption of efficiency and conservation measures. Such campaigns may benefit from segmentation of consumers to target certain populations prone to large misperceptions. More generally, consumers should be made more aware of the concept of power in determining energy consumption as our survey results show this understanding is lacking. Previous behavioral programs have focused on the amount of time that energy-consuming devices are in use—turning off lights, unplugging devices not in use, etc—but fail to address the potential savings that can be had from power-reducing measures. Building this understanding and providing practical information on how to reduce power—by changing device settings, choosing lower-power devices, etc
—would enable more energy-conscious decision-making and allow homeowners to reduce their energy consumption, their energy bills, and their homes’environmental footprint.
Acknowledgments
The authors thank the Pecan Street Research Institute for providing electricity use data and administering the online surveys. We also thank Granger Morgan, Alex Davis, as well as members of the Carnegie Mellon Center for Climate and Energy Decision Making, the Carnegie Mellon University Energy and Behavior group, and the Leeds University Centre for Decision Research for their helpful comments. Funding for this work was provided by Carnegie Mellon University’s Department of Engineering and Public Policy and the Wilton E. Scott Institute for Energy Innovation. Wändi Bruine de Bruin and Tamar Krishnamurti were additionally funded by the UK’s Economic and Social Research Council[grant number ES/L011891/1]and the Swedish Riksbanken
ORCID iDs
Vedran Lesic https://orcid.org/0000-0001-8098-3489
Brock Glasgo https://orcid.org/0000-0002-2192-9279
Tamar Krishnamurti https://orcid.org/0000-0002-3416-2230
Wändi Bruine de Bruin https://orcid.org/0000-0002-1601-789X
Matthew Davis https://orcid.org/0000-0003-1577-7544
Inês Lima Azevedo https://orcid.org/0000-0002-4755-8656
References
[1]Intergovernmental Panel on Climate Change 2014Climate Change 2014 - Synthesis Report(https://www.ipcc.ch/report/ar5/syr/)
[2]Statistical Office of European Communities 2012 EUROSTAT: Consumption of energy.(https://ec.europa.eu/eurostat/ statistics-explained/index.php?title=Archive:Consumption_of_energy)
[3]US Energy Information Administration 2015 Annual Energy Outlook 20151
[4]National Research Council 2010Real Prospects for Energy Efficiency in the United States.National Academies Presshttps://www.nap. edu/catalog/12621/real-prospects-for-energy-efficiency-in-the-united-states
[5]Lesic V, Bruine de Bruin W, Davis M, Krishnamurti T and Azevedo I L 2018 Consumers’perceptions of energy use and energy savings: a literature reviewEnviron. Res. Lett.13(3)033004
[6]Davidson C I, Bruine de Bruin W and Bruin D 2010 Public perceptions of energy consumption and savingsProc. Natl Acad. Sci.107 16054-16059
[7]Frederick S, Meyer A and Mochon D 2011 Characterizing perceptions of energy consumptionProc. Natl Acad. Sci.108E23
[8]Baird J C and Brier J M 1981 Perceptual awareness of energy requirements of familiar objectsJ. Appl. Psychol.6690–6
[9]Schley D R and DeKay M L 2015 Cognitive accessibility in judgments of household energy consumptionJ. Environ. Psychol.4330–41
[10]Chen V L, Delmas M A, Kaiser W J and Locke S L 2015 What can we learn from high-frequency appliance-level energy metering? Results from afield experimentEnergy Policy77164–75
[11]Hargreaves T, Nye M and Burgess J 2010 Making energy visible: a qualitativefield study of how householders interact with feedback from smart energy monitorsEnergy Policy386111–9
[12]Karjalainen S 2011 Consumer preferences for feedback on household electricity consumptionEnergy Build.43458–67
[13]Pecan Street, Inc. 2019(https://pecanstreet.org/)
[14]Pecan Street Dataport 2016(https://dataport.pecanstreet.org)
[15]US Energy Information Administration(EIA)2012Residential Energy Consumption Survey (RECS)(https://www.eia.gov/ consumption/residential/data/2015/)
[16]DOE 2012Buildings Energy DatabookOffice of Energy Efficiency and Renewable Energy(https://openei.org/doe-opendata/dataset/ buildings-energy-data-book)
[17]Wenzel T P, Koomey J G, Rosenquist G J, Sanchez M and Hanford J W 1997Energy Data Sourcebook for the US Residential Sector
Lawrence Berkeley National Laboratory(https://eta.lbl.gov/sites/all/files/publications/lbnl-40297.pdf)
[18]Glasgo B and Hendrickson C 2017 Azevedo IMLA. Using advanced metering infrastructure to characterize residential energy useElectr. J.3064-70
[19]Krishnamurti T, Davis A L, Wong-parodi G, Wang J and Canfield C 2013 Creating an in-home display: experimental evidence and guidelines for designAppl. Energy108448–58