Hepatitis C Virus Strain-Dependent
Usage of Apolipoprotein E Modulates
Assembly Efficiency and Specific
Infectivity of Secreted Virions
Romy Weller,
aKathrin Hueging,
a*
Richard J. P. Brown,
aDaniel Todt,
aSebastian Joecks,
aFlorian W. R. Vondran,
b,cThomas Pietschmann
a,cInstitute of Experimental Virology, Twincore, Centre for Experimental and Clinical Infection Research, Hanover, Germanya; Department of General, Visceral and Transplant Surgery, Hanover Medical School, Hanover,
Germanyb; German Centre for Infection Research, Partner Site Hanover-Braunschweig, Hanover, Germanyc
ABSTRACT
Hepatitis C virus (HCV) is extraordinarily diverse and uses entry factors
in a strain-specific manner. Virus particles associate with lipoproteins, and
apolipo-protein E (ApoE) is critical for HCV assembly and infectivity. However, whether ApoE
dependency is common to all HCV genotypes remains unknown. Therefore, we
com-pared the roles of ApoE utilizing 10 virus strains from genotypes 1 through 7. ApoA
and ApoC also support HCV assembly, so they may contribute to virus production in
a strain-dependent fashion. Transcriptome sequencing (RNA-seq) revealed abundant
coexpression of ApoE, ApoB, ApoA1, ApoA2, ApoC1, ApoC2, and ApoC3 in primary
hepatocytes and in Huh-7.5 cells. Virus production was examined in Huh-7.5 cells
with and without ApoE expression and in 293T cells where individual
apolipopro-teins (ApoE1, -E2, -E3, -A1, -A2, -C1, and -C3) were provided in
trans
. All strains were
strictly ApoE dependent. However, ApoE involvement in virus production was strain
and cell type specific, because some HCV strains poorly produced infectious virus in
ApoE-expressing 293T cells and because ApoE knockout differentially affected virus
production of HCV strains in Huh-7.5 cells. ApoE allelic isoforms (ApoE2, -E3, and
-E4) complemented virus production of HCV strains to comparable degrees. All
tested strains assembled infectious progeny with ApoE in preference to other
ex-changeable apolipoproteins (ApoA1, -A2, -C1, and -C3). The specific infectivity of
HCV particles was similar for 293T- and Huh-7.5-derived particles for most strains;
however, it differed by more than 100-fold in some viruses. Collectively, this study
reveals strain-dependent and host cell-dependent use of ApoE during HCV assembly.
These differences relate to the efficacy of virus production and also to the properties
of released virus particles and therefore govern viral fitness at the level of assembly
and cell entry.
IMPORTANCE
Chronic HCV infections are a major cause of liver disease. HCV is
highly variable, and strain-specific determinants modulate the response to antiviral
therapy, the natural course of infection, and cell entry factor usage. Here we
ex-plored whether host factor dependency of HCV in particle assembly is modulated by
strain-dependent viral properties. We showed that all examined HCV strains, which
represent all seven known genotypes, rely on ApoE expression for assembly of
infec-tious progeny. However, the degree of ApoE dependence is modulated in a
strain-specific and cell type-dependent manner. This indicates that HCV strains differ in
their assembly properties and host factor usage during assembly of infectious
prog-eny. Importantly, these differences relate not only to the efficiency of virus
produc-tion and release but also to the infectiousness of virus particles. Thus,
strain-dependent features of HCV modulate ApoE usage, with implications for virus fitness
at the level of assembly and cell entry.
Received14 March 2017Accepted9 June
2017
Accepted manuscript posted online28
June 2017
CitationWeller R, Hueging K, Brown RJP, Todt
D, Joecks S, Vondran FWR, Pietschmann T. 2017. Hepatitis C virus strain-dependent usage of apolipoprotein E modulates assembly efficiency and specific infectivity of secreted virions. J Virol 91:e00422-17.https://doi.org/10 .1128/JVI.00422-17.
EditorMichael S. Diamond, Washington
University School of Medicine
Copyright© 2017 Weller et al. This is an
open-access article distributed under the terms of theCreative Commons Attribution 4.0 International license.
Address correspondence to Thomas
Pietschmann, [email protected]. *Present address: Kathrin Hueging, Gilead Sciences GmbH, Planegg, Germany.
crossm
on November 7, 2019 by guest
http://jvi.asm.org/
KEYWORDS
ApoE, apolipoprotein, assembly, genotypes, hepatitis C virus
H
epatitis C virus (HCV) is a hepatotropic, plus-strand RNA virus which is
extraordi-narily variable. According to phylogenetic analyses, HCV isolates are classified into
seven distinct genotypes which differ from each other by more than 30% at the
nucleotide level. Moreover, HCV genotypes are further subdivided into 67 confirmed
and 20 provisional subtypes (1, 2). HCV is transmitted mainly parenterally through the
transcutaneous route. Upon contact with the virus, the majority of exposed individuals
progress to a chronically persistent infection, which over the course of decades can lead
to severe liver disease, including hepatitis, cirrhosis, and hepatocellular carcinoma (3, 4).
HCV genotypes and subtypes have a distinct geographical distribution. For example,
HCV infections in industrialized countries are dominated by subtype 1a, 1b, 2a, and 3a
viruses, which were spread by contaminated blood products prior to HCV’s discovery
and which now are transmitted primarily among men who have sex with men and
among people who inject drugs (5–7). The remaining genotypes, whose historical
spread is less well characterized, are frequently observed in West Africa (primarily
genotypes 1 and 2), Central Africa and the Middle East (genotype 4), southern Africa
(genotype 5), South Asia (genotype 3), and Southeast Asia (genotype 6) (5, 8, 9). HCV
genotypes are associated with distinct disease progression and response to therapy.
For example, HCV genotype 3 infection is associated with accelerated fibrosis
progres-sion and a higher risk of developing cirrhosis, steatosis, and hepatocellular carcinoma,
while genotype 2 is associated with less severe fibrosis (10–12). However, the molecular
mechanisms responsible for genotype-dependent differences in the natural course of
HCV infection are poorly understood.
The recent licensing of direct-acting antivirals (DAAs) has revolutionized HCV patient
care (13, 14). However, viral reinfection is possible, and the high costs of these drugs
limit access to therapy, particularly in resource-poor countries. Thus, global control of
the HCV disease burden would benefit from the development of a prophylactic vaccine.
However, the pronounced variability of HCV poses a challenge for development of
vaccination strategies eliciting protective immunity across all major HCV genotypes
(15). Successful vaccine development can therefore be facilitated by a broader
under-standing of virus-host interactions, which can potentially differ between HCV
geno-types.
HCV carries a single open reading frame (ORF) encoding a length of about 3,000
amino acids (16). Individual viral proteins are liberated from the polyprotein by cellular
proteases and two viral peptidases. Multiple steps of the HCV replication cycle are
closely linked with host cell lipid metabolism and membrane-remodeling processes
(17). Moreover, HCV particles are rich in lipids akin to those present in very-low-density
lipoproteins (VLDLs), they have a low buoyant density, and they circulate in close
association with human lipoproteins, including lipoprotein components such as
apo-lipoprotein A (ApoA), ApoB, ApoC, and ApoE (18–24). Due to these features, HCV
particles have been named “lipoviro particles” (LVPs) (24) The association of HCV with
ApoE has been reported to facilitate HCV cell entry through augmented binding of virus
particles to heparin sulfate proteoglycans, which facilitates virus attachment to the cell
surface (25, 26). Furthermore, this interplay was shown to contribute to immune
evasion by protecting glycoprotein target sites from neutralizing antibodies (25, 27–29).
Several independent studies have highlighted the importance of human ApoE for
assembly and release of infectious HCV progeny from infected cells (28, 30–32). Human
non-liver cell lines (e.g., HEK-293T) that lack expression of ApoE are refractory to HCV
production unless ApoE is provided ectopically, thus emphasizing the critical role of
ApoE during HCV particle production (33, 34). It has been shown that ApoE likely
facilitates a late assembly step after membrane envelopment of HCV capsids and that
ApoE is also critical for viral cell-to-cell transmission (33, 35, 36). While it is not fully
understood how ApoE mediates HCV assembly, direct interactions of ApoE with the
glycoproteins E1 and E2 and the nonstructural protein 5A have been described (31, 33,
September 2017 Volume 91 Issue 18 e00422-17 jvi.asm.org 2
on November 7, 2019 by guest
http://jvi.asm.org/
34, 37–39). Intriguingly, alternative structurally related human apolipoproteins,
includ-ing various members of the ApoC and ApoA family, and even a sinclud-ingle
non-lipoprotein-derived amphipathic alpha helix connected with a signal peptide, compensate for the
lack of ApoE expression and partly rescue infectious HCV production in the absence of
ApoE (40–42). These data suggest that structural and functional features of
endoplas-mic reticulum (ER)-targeted amphipathic alpha helices are important for HCV particle
production, possibly in the absence of a direct interaction with viral proteins.
To date, studies dissecting the role of apolipoproteins in the HCV replication cycle
have utilized a restricted panel of isolates which underrepresents the global diversity of
HCV. Therefore, we explored the ApoE dependence of representative HCV isolates from
all major genotypes to identify potential isolate-specific differences in HCV assembly
and secretion pathways.
RESULTS
Comparative analysis of virus production reveals strain-dependent differences
in utilization of human ApoE among HCV chimeras.
To determine whether the
function of human ApoE as a crucial host factor for assembly and release of infectious
HCV particles is conserved across representative isolates of all major HCV genotypes, we
took advantage of HCV JFH1 and nine JFH1-based chimeras that represent the diversity
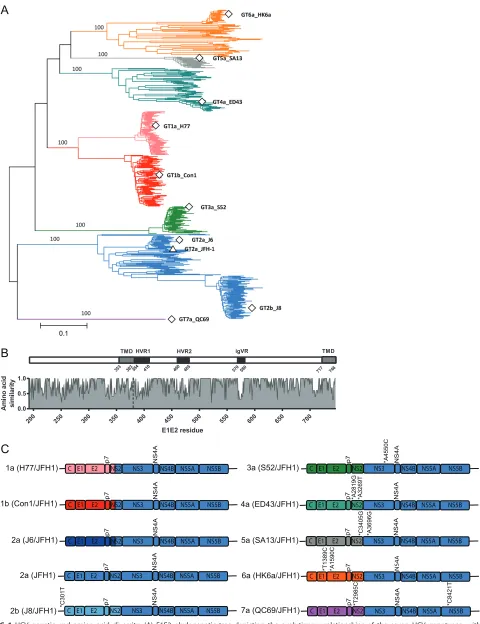
of globally sampled HCV (Fig. 1) (43–47). The sequences utilized in this study were
incorporated into a phylogenetic analysis with globally sampled isolates representing
the major subtypes and genotypes (Fig. 1A). The 10 strains utilized are distributed
throughout the phylogeny and are therefore representative of the breadth of genetic
diversity apparent worldwide. This diversity extends to the amino acid level, as
dem-onstrated by comparison of translated E1E2 proteins for the 10 strains (Fig. 1B). While
extreme diversity is apparent in the 3 hypervariable regions of E2, both functionally
conserved domains and additional variable regions are distributed throughout the
E1E2-coding region (Fig. 1B). An overview of the constructs used, including adaptive
mutations and intra- or intergenotypic fusion sites, is schematically depicted in Fig. 1C.
Since primary human hepatocytes (PPHs) (41) and the human hepatoma cell line
Huh-7.5 express abundant mRNA levels of various exchangeable apolipoproteins (see
Fig. 4A), we first examined HCV infectious particle production in non-liver-derived
293T/miR-122 cells ectopically expressing ApoE3 (33, 41) to specifically assess the role
of ApoE in virus production. As a reference, highly permissive Huh-7.5 cells were
transfected in parallel. Virus RNA translation and replication were determined by
quantification of intracellular HCV core protein expression using a commercial
enzyme-linked immunosorbent assay (ELISA) 48 h after transfection (Fig. 2A), and infectious
virus production was measured by using a limiting-dilution assay (Fig. 2B).
293T/miR-122 cells expressing an empty vector served as a negative control. Furthermore, release
of particles was quantified by assessment of extracellular core protein quantities at this
time point (Fig. 2C). Similar intracellular amounts of core protein were detected for all
HCV constructs in transfected 293T/miR-122/hApoE3 cells, indicating comparable
trans-fection, RNA genome translation, and replication efficiencies. The abundance of HCV
core was also comparable for HCV-transfected Huh-7.5 cells, and it was ca. 2- to 10-fold
higher in Huh-7.5 cells than in 293T/miR122/hApoE3 cells, suggesting higher HCV
transfection and/or replication efficiency in the former cells (Fig. 2A). Huh-7.5
cell-derived virus titers varied between the different chimeras, with genotypes 2a (Jc1) and
5a (SA13) yielding the highest infectivity (1.1
⫻
10
750% tissue culture infective doses
[TCID
50]/ml and
⬃
1.1
⫻
10
6TCID
50/ml, respectively) and the 1a (H77) and 1b (Con1)
chimeras reaching the lowest infectivity (8.2
⫻
10
1TCID
50
/ml and 2.9
⫻
10
3TCID
50/ml,
respectively) (Fig. 2A). This was expected and roughly reflects the fitness of these
chimeras as reported in previous studies (43–47). All chimeras yielded significantly less
infectious virus upon transfection of 293T/miR-122/hApoE3 cells than upon transfection
of Huh-7.5 cells. Nevertheless, relative to infectious virus production in Huh-7.5 cells,
some HCV chimeras produced much less infectivity in 293T/miR-122/hApoE3 cells than
expected. For instance, genotype 5a (SA13) grew to higher titers upon transfection of
on November 7, 2019 by guest
http://jvi.asm.org/
B
2a (J6/JFH1) C E1 E2 p7NS2 NS3 NS4ANS4B NS5A NS5B
p7 NS4A
C E1 E2 NS2 NS3 NS4B NS5A NS5B
3a (S52/JFH1) *A4550C
p7 NS4A
C E1 E2 NS2 NS3 NS4B NS5A NS5B 4a (ED43/JFH1)
*A2819G *A3269T
p7 NS4A
C E1 E2 NS2 NS3 NS4B NS5A NS5B 5a (SA13/JFH1)
*C3405G *A3696G
p7 NS4A
C E1 E2 NS2 NS3 NS4B NS5A NS5B 6a (HK6a/JFH1)
*T1389C *A1590C
p7 NS4A
C E1 E2 NS2 NS3 NS4B NS5A NS5B
7a (QC69/JFH1) *T2985C *C8421T
1a (H77/JFH1)
p7 NS4A
C E1 E2 NS2 NS3 NS4B NS5A NS5B 2b (J8/JFH1)
1b (Con1/JFH1) C E1 E2 p7NS2 NS3 NS4ANS4B NS5A NS5B
2a (JFH1)
p7 NS4A
C E1 E2 NS2 NS3 NS4B NS5A NS5B
p7 NS4A
C E1 E2 NS2 NS3 NS4B NS5A NS5B
A
E1E2 residue
A
m
in
o
aci
d
s
im
ilarity
200 250 300 350 400 450 500 550 600 650 700
0.0 0.5 1.0
HVR1
384 410
HVR2
460 485
igVR
570 580
353 383
TMD TMD
717 746
C
*C301T
FIG 1HCV genetic and amino acid diversity. (A) E1E2 phylogenetic tree depicting the evolutionary relationships of the seven HCV genotypes, with
genotypes color coded (subtypes 1a/1b, pink/red; genotype 2. blue; genotype 3, green; genotype 4, turquoise; genotype 5, gray; genotype 6, orange; genotype 7, purple). The positions of E1E2s derived from the nine chimeric strains utilized in this study are highlighted with open squares. The position of the JFH-1 E1E2 is marked with an open triangle. Branch lengths represent genetic distance measured in nucleotide substitutions per site and are proportional to the scale bar. Bootstrap values are assigned to the branches leading to the seven genotypes and are percentages derived from 1,000
(Continued on next page)
September 2017 Volume 91 Issue 18 e00422-17 jvi.asm.org 4
on November 7, 2019 by guest
http://jvi.asm.org/
[image:4.585.48.528.69.693.2]Huh-7.5 cells, but virus production was below the lower limit of quantification (LLOQ)
upon transfection of 293T/miR-122/hApoE3 cells and was thus reduced by at least
500,000-fold (Fig. 2B and E). In contrast, genotype 2a (Jc1) also yielded relatively high
virus titers upon transfection of 293T/miR-122/hApoE3 cells, which were only ca.
300-fold lower than the ones reached upon transfection of Huh-7.5 cells. Thus, these
results suggest strain-specific differences in utilizing ApoE from non-liver cells. This may
be due to direct or indirect effects caused by other host factors expressed (or not
expressed) in 293T/miR122/hApoE3 cells.
HCV core protein release was detectable in each case and, as expected, was
significantly lower for each chimera after transfection of 293T/miR122/hApoE3 cells
than after transfection of Huh-7.5 cells (Fig. 2C). When comparing the relative efficiency
of core protein release of each of these chimeras between these different cell lines, we
noted major differences (Fig. 2F). In case of Jc1, the difference in core release between
these cell lines was roughly 50-fold, which matches the difference in infectivity. In
contrast, for the genotype 5a chimera (SA13), the difference in core release was more
than 2,000-fold. This observation suggested that HCV chimeras differ in their capacity
to release HCV core protein in these two cell lines. As mentioned above, genotype 5a
(SA13) produced more than 500,000-fold fewer infectious particles upon transfection of
293T/miR-122/ApoE3 cells, but core release was attenuated only ca. 2,000-fold. Thus, for
this chimera also, the specific infectivity (that is, the level of infectiousness associated
with a given quantity of released core protein) was much lower upon transfection of
293T/miR122/hApoE3 cells than upon transfection of Huh-7.5 cells (Fig. 2D). Note that
for the genotype 5a (SA13) chimera, we can only estimate the maximal specific
infectivity of 293T/miR-122/hApoE3-derived viruses because the infectivity
measure-ments were below the lower limit of quantification. Therefore, the true specific
infec-tivity of these particles may be even lower. For JFH1 also, the specific infecinfec-tivity of
293T/miR122/hApoE3-derived particles was lower than that of particles from Huh-7.5
cells. In contrast, many other chimeras, for instance, genotype 2a Jc1, 2b (J8), 3a (S52),
or 7a (QC69), produced particles with comparable specific infectivity upon transfection
of these cell lines, and uniquely the specific infectivity of 6a (HK6a) particles was
significantly higher after transfection of 293T/miR-122/hApoE3 cells than after
trans-fection of Huh-7.5 cells (Fig. 2D). Taken together, this analysis confirms previous reports
indicating different assembly competencies of these chimeras in human liver cell lines
(43–47). Unexpectedly, these differences in fitness are not precisely mirrored in 293T/
miR-122/hApoE3 cells, as some chimeras are much more attenuated in assembly and
release of viral progeny than others (e.g., genotype 5a [SA13] compared to 2a [Jc1]) and
because the specific infectivity of released particles also varied. Collectively, these
results suggested that HCV chimeras differ in host factor requirements, possibly in their
ApoE usage, for infectious particle assembly and release.
Comparable utilization of ApoE isoforms in assembly and virus production by
HCV chimeras.
The human ApoE gene has multiple allelic isoforms (ApoE2, -E3, and
-E4), with the encoded proteins differing at one or two amino acid positions (residues
112 and/or 158) (48). These mutations have an impact on ApoE binding preferences
toward different lipoprotein classes (49) and on low-density lipoprotein (LDL) receptor
binding affinity (50), and these variants are associated with susceptibility to distinct
disorders, including Alzheimer’s disease (51) or type III hypolipoproteinemia (52).
Hishiki et al. previously reported that HCV genotype 2a (JFH1) infectivity is influenced
by association with distinct ApoE isoforms (53). In rescue experiments with
ApoE-FIG 1Legend (Continued)
replications. (B) Amino acid similarity plot of full-length HCV envelope glycoproteins derived from the 10 strains utilized in this study, with relative similarity shown on theyaxis and amino acid position in the encoded proteins presented on thexaxis. For the purpose of positional referencing, a cartoon of the E1E2 protein is located directly above, with the three hypervariable regions of E2 (HVR1, HVR2, and igVR) highlighted in black and the E1 and E2 transmembrane domains (TMD) highlighted in gray. The dashed vertical line represents the E1/E2 boundary. All numbering is relative to the full-length ORF position in the H77 reference strain (accession numberNC_004102). (C) HCV constructs used in this study. The colors of genome portions matches the colors chosen for display of distinct HCV genotypes and subtypes in panel A. Asterisks indicate adaptive mutations.
on November 7, 2019 by guest
http://jvi.asm.org/
depleted Huh-7.5 cells, overexpression of ApoE2 resulted in poor recovery of infectious
particle production, while ApoE3 and -E4 fully sustained infectivity. In contrast, using
HCV
trans
-complemented particles (TCP) in mouse hepatoma cells, Long et al.
demon-strated that all three human alleles of ApoE support HCV assembly with comparable
D
A
B
C
1 2 3 4 5 6
E
1 2 3 4 5 6
Huh-7.5
F
293T/miR-122/hApoE3 Huh-7.5 293T/miR-122/hApoE3
Huh-7.5 293T/miR-122/hApoE3
Huh-7.5 293T/miR-122/hApoE3 Huh-7.5 293T/miR-122/hApoE3
log
10
TCID
50
/mL
log
10
extracellular
core (fmol/ L)
log
10
intracellular
core (fmol/ L)
log
10
specific infectivity
(TCID
50
/ fmol core release)
Infectivity 293T/ Huh-7.5 cells
1a (H77)1b (Con1)2a (Jc1)
2a (JFH1)2b (J8)3a (S52)4a (ED43)5a (SA13)6a (HK6a)7a (QC69)
1a (H77)1b (Con1)2a (Jc1)
2a (JFH1)2b (J8)3a (S52)4a (ED43)5a (SA13)6a (HK6a)7a (QC69)
1a (H77)1b (Con1)2a (Jc1)2a (JFH1)2b (J8)3a (S52)4a (ED43)5a (SA13)6a (HK6a)7a (QC69) 1a (H77)1b (Con1)2a (Jc1)2a (JFH1) 3a (S52)4a (ED43) 2b (J8)
5a (SA13)6a (HK6a)7a (QC69)
Core release 293T/
Huh-7.5 cells
-2 -1 0 1 2 3
-5 -4 -3 -2 -1 0 1 2 3
**** **** **** **** **** **** **** ****
**** **** **** **** **** **** **** **** **** ****
n.s.
n.s. n.s. ** n.s. **** n.s. n.s. *** **** n.s. n.s. *** n.s. **** n.s. n.s.
293T/miR-122 [empty]
0 1 2 3 4 5 6 7 8
n.d.
1a (H77)1b (Con1)2a (Jc1)
2a (JFH1) 3a (S52)4a (ED43) 2b (J8)
5a (SA13)6a (HK6a)7a (QC69)
0 1 2 3 4 5
n.d.
1a (H77)1b (Con1)2a (Jc1)2a (JFH1) 3a (S52) 4a (ED43) 2b (J8)
5a (SA13)6a (HK6a)7a (QC69)
Huh-7.5 293T/miR-122/hApoE3
n.s. ** n.s. n.s. n.s. **** * n.s.
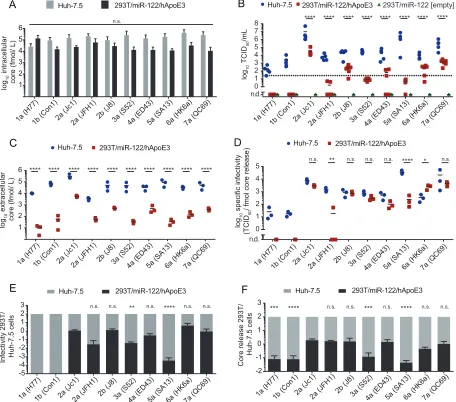
FIG 2Strain-dependent usage of ApoE3 during HCV assembly in 293T/miR-122 cells. (A) Huh-7.5 cells and non-liver-derived 293T/miR-122 cells expressing hApoE3 were transfected within vitro-transcribed RNA of the depicted HCV constructs, and intracellular core protein was quantified 48 h later to compare transfection, translation, and replication efficacy by use of a core-specific ELISA. Depicted are means and standard deviations from three independent experiments (n.s., not significant by 2-way ANOVA followed by Sidak’s multiple-comparison test). (B) Infectious virus production from these transfected cells was quantified by titrating the cell-free culture fluids collected at 48 h posttransfection and by using endpoint dilution assay on Huh-7.5 target cells. Infectivity is given as 50% tissue culture infectious dose per milliliter (TCID50/ml). 293T/miR-122
cells lacking ApoE expression were transfected with each HCV chimera in parallel, and no infectious events were detected. The dotted line represents the lower limit of quantification (LLOQ) of the assay. Displayed are individual results of four to six independent experiments, with the mean presented as a horizontal bar. Mean TCID50s in Huh-7.5 cells were compared to infectivity in 293T/miR-1227hApoE3 cells for each strain
(****,P⬍0.0001; n.d., not detected [by 2-way ANOVA followed by Sidak’s multiple-comparison test]). (C) At 48 h after transfection, secretion of core protein into the cell culture supernatant as an indicator of particle release was additionally quantified by core-specific ELISA. Results from three independent experiments, with the mean presented as a horizontal bar, are given. Mean concentrations of core in Huh-7.5 were compared to detected particles in 293T/miR-122/hApoE3 cells for each strain (****,P⬍0.0001 by 2-way ANOVA followed by Sidak’s multiple-comparison test). (D) Based on the data plotted in panels B and C, the specific infectivity (i.e., the TCID50units per fmol of released core protein) was calculated
in three independent experiments. Mean specific infectivities in Huh-7.5 cells were compared to those in 293T/miR-122/hApoE3 cells for each strain (****,P⬍0.0001;**,P⬍0.01;*,P⬍0.05; n.s., not significant; n.d., not detected [by 2-way ANOVA followed by Sidak’s multiple-comparison test]). (E and F) Efficiencies of infectious virus particle production (E) and core protein release (F) from 293T/miR-122/hApoE3 cells were calculated and displayed, with those observed in Huh-7.5 cells normalized to 100%. Significant differences of relative infectivity and relative core release in 293T/miR-122/hApoE3 cells of different chimeras compared to Jc1 are indicated (****,P⬍0.0001;***,P⬍0.001;**,P⬍0.01; n.s., not significant [by 1-way ANOVA followed by Sidak’s multiple-comparison test]).
September 2017 Volume 91 Issue 18 e00422-17 jvi.asm.org 6
on November 7, 2019 by guest
http://jvi.asm.org/
[image:6.585.43.499.75.477.2]efficiency (32). This discrepancy may be related to use of full-length versus
trans
-complemented particles. However, Long et al. used a Jc1 chimera whereas Hishiki et al.
employed JFH1 wild-type viruses, suggesting that HCV usage of ApoE isoforms may
also be strain specific. If so, viruses that do not effectively use ApoE3 may be attenuated
in non-liver cells such as 293T cells ectopically expressing ApoE3. In Huh-7.5 cells,
which, based on mapping of our transcriptome data (see Fig. 4A), express ApoE3, this
may be less of an impediment for such isolates, as alternative exchangeable
apolipo-proteins (e.g., ApoA and ApoC variants) which are known to also support HCV assembly
(40, 41) are coexpressed (see Fig. 4A) and thus may complement ineffective use of
ApoE3. To address this, we generated stable 293T/miR-122 cell lines that ectopically
express ApoE2, -E3, or -E4. Using an ApoE ELISA, we confirmed that all isoforms are
expressed and secreted at similar levels (Fig. 3A). We did not observe significant
differences in infectivity of the produced particles upon ectopic expression of other
ApoE isoforms in 293T cells (Fig. 3B). Thus, at least in 293T cells, we were unable to
detect strain-specific differences in use of allelic isoforms of ApoE. Moreover, ineffective
use of ApoE3 does not explain why some strains, for instance, genotype 5a (SA13), do
not efficiently produce infectious virus in these cells.
We next explored whether expression of additional host factors modulating lipid
metabolism in human hepatocytes strain-specifically influences infectious virus
pro-duction. The microsomal triglyceride transfer protein (MTTP) mediates triglyceride
B
A
293T/miR-122 Apo E2 E3 E4
Huh-7.5
-0 1 2 3 4log
10
ApoE [ng/mL]
log
10
TCID
50
/mL
2a (Jc1)
2a (JFH1) 2b (J8) 5a (SA13) Huh-7.5
293T/miR-122/hApoE3 293T/miR-122/hApoE3/MTTP
C
0 1 2 3 4 5 6 7 8
log
10
TCID
50
/mL
1a (H77) 1b (Con1) 2a (Jc1) 2a (JFH1) 2b (J8) 3a (S52) 4a (ED43)5a (SA13) 6a (HK6a) 7a (QC69)
Huh-7.5 293T/miR-122/hApoE3
293T/miR-122/hApoE4 293T/miR-122/hApoE2
n.d. n.d.
0 1 2 3 4 5 6 7
n.d. n.d.
n.s. n.s. n.s. n.s. n.s. n.s. n.s. n.s.
n.s.
n.s. 100 kDa
70 kDa 50 kDa
35 kDa
293T/miR-122
hApoE3 +
Huh-7.5
-
+ -MTTP
-
- + -MTTP
PDI Actin
ApoE
D
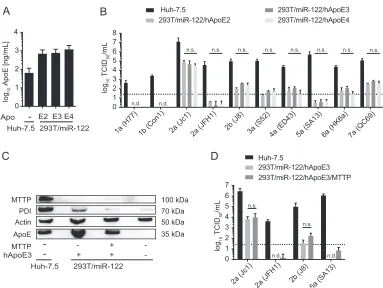
FIG 3Ability of ApoE allelic isoforms and MTTP to support infectious virus production of HCV chimeras in 293T/miR-122 cells. (A) 293T/miR-122 cells were transduced to express the allelic isoforms of ApoE, and secretion of these allelic forms (ApoE2, ApoE3, and ApoE4) was quantified by using an ApoE ELISA. (B) These cell lines were subsequently transfected with RNAs of the indicated HCV constructs, and release of infectious particles was determined by a limiting dilution assay. Differences in infectivity observed among the three cell lines were analyzed by 2-way ANOVA followed by Sidak’s multiple-comparison test (n.s., not significant; n.d., not detected). (C) 293T/miR-122/hApoE3 cells were lentivirus trans-duced to express the additional host factor MTTP. Protein expression of MTTP as well as the protein disulfide isomerase (PDI), which completes the heterodimeric MTTP, was confirmed by immunoblotting using antibodies specific for MTTP, PDI,-actin, and ApoE. (D) Cells were transfected with the indicated HCV constructs. Infectious virus production was assessed by a limiting dilution assay. Differences in means were analyzed by multiplettests, corrected with the Holm-Sidak method (n.s., nonsignificant; n.d., not detected). For all panels, results are shown as means with standard deviations from three independent experiments.
on November 7, 2019 by guest
http://jvi.asm.org/
[image:7.585.41.424.68.356.2]incorporation into nascent ER-luminal lipid droplets and is required for production and
secretion of nascent ApoB-containing very-low-density lipoproteins (VLDLs) (54, 55).
While it has been reported that inhibition of MTTP impedes HCV particle production,
others suggested that HCV assembly is independent of MTTP (28, 56). To investigate
this in the context of other HCV genotypes, we transfected 293T/miR-122/hApoE3/
MTTP cells (33) with a selection of HCV chimeras that either yielded robust titers in
293T/miR-122/hApoE3 cells, such as genotypes 2b (J8) and 2a (Jc1), or failed to
efficiently produce infectious particles, such as genotypes 5a (SA13) and 2a (JFH1).
Protein expression of MTTP and the protein disulfide isomerase (PDI), a functional
subunit of MTTP (57), was confirmed by immunoblotting (Fig. 3C). No significant
differences were observed regarding infectious virus particle formation upon combined
ApoE3/MTTP overexpression (Fig. 3D). Taken together, these data indicate that
over-expression of MTTP in combination with ApoE3 does not modulate infectivity or rescue
particle production of isolates that failed to form infectious particles when ApoE3 was
expressed alone.
ApoC or ApoA family members do not rescue virus production of HCV chimeras
with poor assembly efficiency in 293T/miR-122/ApoE3 cells.
Primary human
hepa-tocytes endogenously express numerous exchangeable apolipoproteins, and when
endogenous ApoE is silenced in in Huh-7 cells, ectopic expression of various
apolipo-proteins boosts HCV assembly (40). Moreover, in non-liver-derived 293T/miR-122 cells,
Jc1 HCV production is rescued by several exchangeable apolipoproteins (41), thus
showing that HCV can use multiple apolipoproteins for virus production. Therefore, we
speculated that some HCV strains may prefer alternative apolipoproteins over ApoE
and because of this may be attenuated in 293T cells expressing ApoE3 compared to
Huh-7.5 cells, where such alternative apolipoproteins are expressed. To address this, we
first determined mRNA expression levels of multiple exchangeable apolipoproteins in
primary human hepatocytes (PHHs) from three different donors and in two divergent
batches of Huh-7.5 cells (i.e., parental Huh-7.5 cells and a population of Huh-7.5 cells
transduced with a lentiviral vector) by transcriptome sequencing (RNA-seq). For control
purposes, expression of housekeeping genes, hepatocyte markers, HCV entry and
replication factors, and proteins of the innate immune sensing pathway is also
pre-sented. As depicted in Fig. 4A, global transcriptomic profiling revealed high mRNA
expression levels of ApoE and ApoB in all samples. Furthermore, among the
ApoE-related exchangeable apolipoproteins, ApoA1, -A2, -C1, -C2, and -C3 were also highly
expressed in primary human hepatocytes and expressed at only slightly lower levels in
the two Huh-7.5 cell batches. The abundance of mRNAs coding for ApoA4, -A5, and -C4
was clearly lower in PHHs and in the case of ApoA4 and -A5 was almost absent in the
Huh-7.5 cell batches. To explore whether some HCV chimeras use ApoA or ApoC
variants in preference to ApoE, we selected four variants highly expressed in both PHH
and Huh-7.5 cells (ApoA1, -A2, -C1, and -C3) and ectopically expressed hemagglutinin
(HA)-tagged variants in 293T/miR-122 cells (41). Comparable expression of these
HA-tagged apolipoproteins was confirmed by an HA tag-specific ELISA (reference 41 and
data not shown). As previously reported, ApoA1, -A2, -C1, and -C3 sustained infectious
HCV particle production of Jc1 and compensated the function of ApoE during HCV
assembly (Fig. 4B) (41). However, genotype 2a JFH1 and the genotype 5a (SA13)
chimera that cannot utilize ApoE3 in 293T/miR-122 cells (Fig. 2B and 3C) were not
rescued by these other exchangeable apolipoproteins (Fig. 4B). Since all these 293T cell
lines expressed comparable levels of these apolipoproteins (41), these results confirm
that genotype 2a (Jc1) preferentially uses ApoE, and they exclude a preference for these
alternative apolipoproteins by other HCV strains. This conclusion was also supported by
core protein measurements (Fig. 4C), since for each chimera, virus core release was
greatest in ApoE-expressing 293T/miR-122 cells. Finally, for genotype 2a Jc1, we
calculated the specific infectivity (Fig. 4D) and confirmed that specific infectivities of Jc1
particles produced in the presence of ApoA1, -A2, -C1, and -C3 are similar to that
for ApoE-expressing 293T/miR-122 cells, albeit lower than that for Huh-7.5-derived
particles.
September 2017 Volume 91 Issue 18 e00422-17 jvi.asm.org 8
on November 7, 2019 by guest
http://jvi.asm.org/
KO of endogenous ApoE expression in Huh-7.5 cells differentially affects virus
production of HCV strains.
Next, we assessed ApoE usage by HCV strains in Huh-7.5
cells. To this end, we knocked out ApoE expression in these cells by clustered regularly
interspaced short palindromic repeat (CRISPR)/Cas9 and examined virus production of
JFH1 and nine HCV chimeras (Fig. 5). First, we characterized several Huh-7.5 ApoE
knockout (KO) subclones regarding secretion of ApoE (Fig. 5A), secretion of ApoB (Fig.
5B), HCV RNA replication (Fig. 5C), and virus production (Fig. 5D) after transient
transfection with a JcR2a
Renilla
luciferase-expressing reporter virus. Among all
sub-clones characterized, we chose clone 1#2 for further analysis, because it displayed a
knockout of ApoE expression but essentially normal ApoB secretion. Moreover, HCV
RNA replication in this subclone was only marginally affected, while secretion of
infectious progeny, as determined by transduction of luciferase activity, was reduced
ca. 22-fold compared to parental Huh-7.5 cells (Fig. 5C and D). To confirm that the
assembly defect of this subclone was caused by lack of ApoE, we rescued ApoE
B
A
2a (JFH1)
RPKM
ALB
GAPDH ACTB PPIA PI4 SCARB1CLDN1 KA
CD81 OCLN DDX58
100 101 102 103 104
10-1 100 101 102
103
104
ApoA1 ApoA2 ApoA4 ApoA5 ApoC1 ApoC2 ApoC3ApoC4 ApoE ApoB
RPKM
2a (Jc1) 5a (SA13)
293T/miR-122
Apo
Huh-7.5
- E A1 A2 C1 C3
n.d. n.d. n.d. n.d. n.d.
log
10
TCID
50
/mL
-1 0 1 2 3 4 5 6
2a (JFH1)
2a (Jc1) 5a (SA13)
C
293T/miR-122 Apo
Huh-7.5
E A1 A2 C1 C3
log
10
fmol core/L
2a (JFH1)
2a (Jc1) 5a (SA13)
D
293T/miR-122 Apo
Huh-7.5
E A1 A2 C1 C3
n.d. n.d. n.d. n.d.
log
10
specific infectivity
(TCID
50
/ fmol core release)
0 1 2 3 4 5 6 7
Huh7.5
Huh-7.5 [empty]
PHH donor A
PHH donor B PHH donor C
0 1 2 3 4 5 6 7
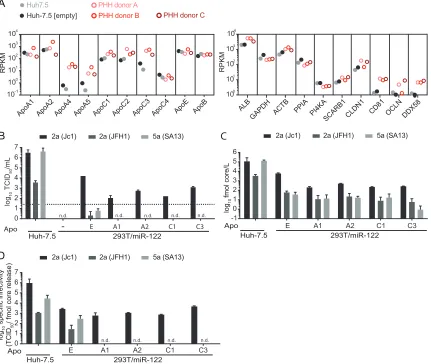
FIG 4Preferential usage of ApoE over ApoA and ApoC during HCV assembly of different HCV constructs in 293T/miR-122 cells. (A) Relative mRNA expression levels are depicted as reads per kilobase per million reads (RPKM) of multiple exchangeable and nonexchangeable apolipoproteins in Huh-7.5 cells, lentivirus-transduced Huh-7.5 cells expressing an “empty” lentiviral vector (Huh-7.5 [empty]), and PHHs from three different donors. For comparison, RPKM values for the liver-specific host factor albumin (ALB), two housekeeping genes (glyceraldehyde-3-phosphate dehydrogenase [GAPDH] and-actin [ACTB]), HCV replication factors cyclophilin A (PPIA) and phosphati-dylinositol 4-kinase alpha (PI4KA), HCV entry factors scavenger receptor class B type 1 (SCARB1), claudin-1 (CLDN1), CD81, and occludin (OCLN), and the innate immune sensor RIG-I (DDX58) are presented on the right. (B) A subset of apolipoproteins that were highly expressed in Huh-7.5 cells/PHHs was selected to evaluate their ability to complement infectious virus production 48 h after HCV RNA transfection. Virus titers were assessed via limiting dilution assay, with the dotted line indicating the lower limit of quantification (LLOQ). (C) Release of core protein into the culture fluids was quantified by core-specific ELISA at 48 h posttransfection. (D) Specific infectivity was calculated based on core protein released into the supernatants and corresponding infectivity. For panels B, C, and D, means and standard deviations from two independent experiments are depicted (n.d., not detected).
on November 7, 2019 by guest
http://jvi.asm.org/
[image:9.585.45.476.75.439.2]B
A
C
0 50 100 150Huh-7.5 CRISPR-Cas9 ApoE KO clones Huh-7.5
- 1#1 1#2 1#3 2#1 2#5 2#7 2#9 3#3 3#5
ApoE [ng/mL] 0 100 200 300 400 500
Huh-7.5 CRISPR-Cas9 ApoE KO clones Huh-7.5
- 1#1 1#2 1#3 2#1 2#5 2#7 2#9 3#3 3#5
ApoB [ng/mL] 0 1 2 3 4 5 6 7 8 log 10 RLU/6-well
Huh-7.5 CRISPR-Cas9 ApoE KO clones Huh-7.5
1#2 2#1 3#5
4h 24h 48h 72h
0 1 2 3 4 5 6 7 log 10 RLU/12-well
Huh-7.5 CRISPR-Cas9 ApoE KO clones Huh-7.5
1#2 2#1 3#5
4h 24h 48h 72h
log
10
TCID
50
/mL
Huh-7.5 Huh-7.5 ApoE KO
1a (H77)1b (Con1)2a (Jc1)2a (JFH1)2b (J8)3a (S52)4a (ED43)5a (SA13)6a (HK6a) 7a (QC69)
D
E
F
Infectivity Huh-7.5 ApoE
KO/ Huh-7.5 cells
0 1 2 3 4 5 6 7 8
Huh-7.5 Huh-7.5 ApoE KO
-1 0 1 2 3 Replication Infectivity **** **** **** **** **** **** *** **** *** *** n.s.
1a (H77)1b (Con1)2a (Jc1)
2a (JFH1) 3a (S52)4a (ED43) 2b (J8)
5a (SA13)6a (HK6a)7a (QC69)
n.s. n.s. n.s. n.s. n.s. * n.s. * n.s.
Infectivity
Huh-7.5 ApoE KO Huh-7.5 log 10 TCID 50 /mL
I
G
0 1 2 3 4 5 6 724h 48h 72h
ApoE [ng/mL]
0 50 100 150
Huh-7.5 Huh-7.5 ApoE KO
H
ApoE
Actin 50 kDa
35 kDa
Huh-7.5 ApoE KO Huh-7.5
+ rescApoE
+ rescApoE + rescApoE
NS5A 55 kDa
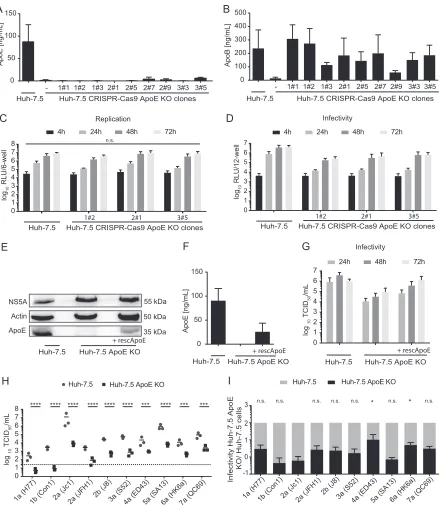
FIG 5HCV replication and virus production in Huh-7.5 cell clones with ApoE knockout. (A and B) Individual Huh-7.5 clones deficient in
endogenous ApoE expression were generated via CRISPR/Cas9-mediated knockout, subcloned, and characterized for ApoE (A) or ApoB secretion (B) into the culture fluids by commercially available ApoE and ApoB ELISAs. Means and standard deviations from at least two independent experiments are shown. (C) Three knockout cell clones were transfected with JcR2A HCV RNA encoding aRenillaluciferase reporter. At 4 h, 24 h, 48 h, and 72 h posttransfection, HCV RNA replication was monitored by luciferase measurements in the cell lysates. Luciferase activity is given in relative light units per well of a 6-well plate (RLU/6-well). Means and standard deviations from at least three independent experiments are depicted. Differences in RLU were compared among KO clones to Huh7.5 at each of the indicated time points (n.s., not significant). (D) Cell-free cell culture supernatants of the cells used for panel C were used to inoculate naive Huh-7.5 cells, and infectivity was determined by luciferase assay at 72 h postinoculation from three independent repetitions. Based on the data sets presented, cell clone 1#2 was selected for further analyses. (E to G) Endogenous ApoE KO was restored by ectopic expression of a C-terminally HA-tagged ApoE3 variant. Intracellular ApoE KO or overexpression of recombinant ApoE was confirmed by immunoblotting (E) and secretion of ApoE into the cell culture supernatant by ApoE-specific ELISA (F). Infectious virus production upon transfection with HCV Jc1 RNA was quantified by a limiting-dilution assay (G). Virus replication after transfection was assessed by immunoblotting of intracellular NS5A protein (E). For panel G, results from three independent experiments are shown. (H) The selected ApoE KO cell clone 1#2 and parental Huh-7.5 cells were transfected with RNA of JFH1 and nine chimeric HCV constructs, and at 48 h posttransfection, cell-free supernatants were used to inoculate naive Huh-7.5 cells. Infectivity was determined by limiting-dilution assay. The dotted line represents the lower limit of quantification (LLOQ) of the assay; independent repetitions are indicated as solid dots with a bar displaying the mean. Mean TCID50s in Huh-7.5 cells were compared
(Continued on next page)
September 2017 Volume 91 Issue 18 e00422-17 jvi.asm.org 10
on November 7, 2019 by guest
http://jvi.asm.org/
[image:10.585.46.489.69.574.2]expression in this subclone by lentiviral gene transfer. Restoration of ApoE expression
was confirmed by immunoblotting (Fig. 5E) and by an ApoE-specific ELISA (Fig. 5F).
Upon transfection of parental Huh-7.5 cells or Huh-7.5 ApoE KO 1#2 cells with or
without ApoE rescue with Jc1 we observed comparable accumulation of NS5A protein
(Fig. 5E), suggesting similar transfection, translation, and replication efficiency in these
cell lines. Importantly, restoration of ApoE expression in the Huh-7.5 ApoE KO 1#2 cells
increased infectious virus production 5- to 10-fold between 24 and 27 h
posttransfec-tion (Fig. 5G). These data confirm previous results published by others and highlight the
importance of ApoE during HCV assembly, while excluding other clonal effects of
CRISPR/Cas9-mediated knockout cells.
Next we transfected the selected Huh-7.5 ApoE knockout clone with HCV RNA of
JFH1 and all nine chimeras and compared virus production relative to that observed
upon transfection of parental Huh-7.5 cells (Fig. 5H and I). All chimeras yielded
significantly less infectious progeny upon transfection of the Huh-7.5 ApoE KO cell line
than upon transfection of the parental Huh-7.5 cells. However, when we calculated the
ratio of infectivity released from Huh-7.5 and Huh-7.5 ApoE KO cells for each of these
chimeras, we observed significant differences. Infectious virus production by the
ge-notype 2a (Jc1), gege-notype 1b (Con1), and gege-notype 5a (SA13) chimeras was impaired
more than 100-fold in the Huh-7.5 ApoE KO cells. In contrast, 4a (ED43) and 6a (HK6a)
chimeras were significantly less affected by knockout of ApoE than 2a (Jc1) and
displayed only 10- and 20-fold-reduced virus production (Fig. 5I). Notably, these
strain-dependent differences in ApoE usage between Huh-7.5 and Huh-7.5 ApoE KO
cells did not directly mirror the differences in ApoE usage of these strains between
293T/miR-122/ApoE3 and Huh-7.5 cells. For instance, the ratio of 2a (Jc1) and 4a (ED43)
virus production between Huh-7.5 and 293T/miR-122/ApoE3 cells was similar (Fig. 2E
and F), while it was significantly different between Huh-7.5 and Huh-7.5 ApoE KO cells
(Fig. 5H and I). In contrast, 2a (Jc1) and 5a (SA13) exhibited significantly different
assembly efficiencies with Huh-7.5 and 293T/miR-122/ApoE3 cells (Fig. 2E and F), while
both chimeras were affected to similar levels by knockout of ApoE in the Huh-7.5
background (Fig. 5H and I). Taken together, these results show that all HCV chimeras
depend on ApoE for virus production. They also reveal that HCV chimeras are
entially susceptible to knockout of ApoE in Huh-7.5 cells and that they display
differ-ential efficiency of virus production in non-liver cells when only ApoE3 is expressed.
Therefore, these results point toward differences in the fine-tuning of HCV assembly by
host factors expressed in human liver and non-liver cells.
DISCUSSION
Here we used JFH1 and nine different HCV chimeras representing all seven HCV
genotypes to explore strain-dependent apolipoprotein usage during HCV assembly
(43–47). These constructs have common viral nonstructural proteins NS3 to NS5B
derived from the JFH1 strain. Thus, differences in virus production can be related to
different functional properties in the structural proteins core, E1, and E2 as well as the
p7 ion channel protein, as well as a portion of or the entire NS2 protein. On the one
hand, we took advantage of 293T cells, a human kidney-derived cell line that is
refractory to HCV RNA replication and virus production unless key liver-specific
cofac-tors (miR-122 and ApoE) are provided in
trans
(33, 34). Moreover, unlike liver cells, these
cells do not secrete human lipoproteins and lack essential components of lipoprotein
production and secretion (e.g., MTTP and ApoB). Thus, these cells represent a minimal
host environment for HCV assembly, where the role of individual host factors in
assembly can be examined by complementation approaches. On the other hand, we
FIG 5Legend (Continued)
to infectivity in the KO cell line for each strain (****,P⬍0.0001;***,P⬍0.001 [by 2-way ANOVA followed by Sidak’s multiple-comparison test]). (I) The efficiency of infectious virus particle release (E) from subcloned Huh-7.5 ApoE KO cells was compared to that from parental Huh-7.5 cells, which was set to 100%. The mean specific infectivity in Huh-7.5 cells was compared to that in ApoE KO cells for each strain (*,P⬍0.05; n.s., not significant [by 2-way ANOVA followed by Sidak’s multiple-comparison test]).
on November 7, 2019 by guest
http://jvi.asm.org/
used Huh-7.5 cells, a human hepatocellular carcinoma cell line that is highly permissive
for HCV replication and virus production and that is typically used as the best available
authentic background for HCV cell culture studies. Moreover, like primary human
hepatocytes (Fig. 3), these cells express various exchangeable and nonexchangeable
apolipoproteins, and they secrete lipoproteins decorated with ApoE and ApoB. Thus,
this host cell background mimics conditions more closely related to primary human
hepatocytes and also permits assessment of the contributions of various lipoproteins
during HCV assembly. Using these models, we firmly established that all examined HCV
chimeras produce HCV particles in a strictly ApoE-dependent manner, since none of the
chimeras was able to produce infectious virus in 293T cells lacking ApoE expression
(Fig. 2B). Moreover, knockout of ApoE expression in the highly permissive Huh-7.5 cell
line significantly reduced infectious virus production by all chimeras (Fig. 5H).
Unex-pectedly, we observed strain-dependent differences regarding ApoE usage in these two
models. First, parental genotype 2a (JFH1), 1a (H77), 1b (Con1), and 5a (SA13) chimeras
are essentially unable to produce infectious HCV particles in 293T cells even if ApoE is
ectopically expressed. In contrast, the genotype 2a (Jc1), 2b (J8), 4a (ED43), 6a (HK6a),
and 7a (QC69) chimeras produce infectious HCV in this cellular background (Fig. 2B).
By measuring intracellular core protein levels upon transfection of these chimeras, we
excluded that these differences were due to divergent transfection, translation, and/or
replication efficiencies. We also analyzed virus production of these chimeras in highly
permissive Huh-7.5 cells and confirmed that the efficiency of assembly and release
differs greatly between these chimeras (Fig. 2B) (43–47). While the low assembly
efficiency of genotype 1a (H77) or 1b (Con1) chimeras may explain why infectious virus
production in the less permissive 293T/miR-122/ApoE3 cells was not detected, this does
not explain why other chimeras, including 3a (S52) with robust virus production in the
Huh-7.5 cells and, even more strikingly, genotype 5a (SA13) with very efficient assembly
in Huh-7.5 cells produced extremely low virus titers in the 293T cell background. These
results indicate that chimeras differ in their ability to utilize ApoE3 as a cofactor for virus
production, suggesting strain- and cell type-dependent differences in ApoE3 usage.
One possibility is that the structure/function of ApoE3 differs between the liver cell
line Huh-7.5 and 293T cells and that only some strains are able to cooperate with the
“version” of ApoE3 expressed in 293T cells. Alternatively, other exchangeable
apolipo-proteins and/or liver cell-specific assembly cofactors expressed in Huh-7.5 cells but
lacking in 293T cells may allow efficient HCV assembly of chimeras with poor ApoE3
usage in the Huh-7.5 cells, whereas such chimeras are attenuated in 293T cells, as such
putative compensating factors are lacking. Following these hypotheses, we attempted
to rescue inefficient virus production of HCV chimeras in 293T cells by ectopic
coex-pression of MTTP together with ApoE3. Alternatively, we expressed different ApoE
isoforms or other exchangeable apolipoproteins. The latter are highly expressed in
Huh-7.5 cells and in primary human hepatocytes (Fig. 4A), and they are known to
function in HCV assembly. Thus, they were candidates for compensating for poor usage
of ApoE3 in Huh-7.5 cells. At least for genotype 2a (JFH1), it had been reported that this
HCV strain differentially uses ApoE isoforms (53). Thus, it was possible that the chimeras
poorly assembling in 293T cells expressing ApoE3 may be attenuated because of
inefficient use of this specific ApoE allele. In Huh-7.5 cells that also express ApoE3, this
impediment may be overcome due to coexpression of other exchangeable
apolipo-proteins that complement assembly.
Our experiments revealed that MTTP coexpression does not modify virus production
of JFH1 and selected HCV chimeras in 293T cells (Fig. 3B). Moreover, they indicated that
all tested virus constructs used ApoE isoforms to a similar degree. Finally, except for
genotype 2a (Jc1), all tested HCV chimeras examined were unable to use ApoA1, -A2,
-C1, or -C3 for assembly in the 293T background. Based on these observations, we can
rule out that those chimeras with poor assembly efficiency in 293T/miR-122/ApoE3 cells
(e.g., genotype 5a [SA13]) preferentially use alternative ApoE alleles or ApoA1, -A2, -C1,
or -C3 instead of ApoE3. Therefore, other factors lacking in 293T cells and needed by
these strains for efficient assembly may be required. Alternatively, these strains may
September 2017 Volume 91 Issue 18 e00422-17 jvi.asm.org 12
on November 7, 2019 by guest
http://jvi.asm.org/
require concomitant expression of several apolipoproteins together. The 293T system
should be a useful tool to dissect these requirements in more detail.
The strain-dependent differences of ApoE3 usage by HCV in 293T cells described
here do refer not only to assembly and release of virus particles but also to the
properties of released virus particles. Most chimeras released viruses with comparable
specific infectivity from 293T/miR-122/ApoE3 and Huh-7.5 cells; however, particularly
genotype 5a (SA13) viruses released from 293T/miR-122/ApoE3 cells were much less
infectious than those liberated from Huh-7.5 cells (Fig. 2D). It will be interesting to
explore why these particles are less infectious. One possibility is that this chimera is not
effectively loading ApoE onto nascent virus particles, which in turn would reduce the
specific infectivity of released HCV given the important role of particles associated with
ApoE for HCV attachment and cell entry (25, 27, 28).
Finally, we confirmed HCV strain-dependent ApoE usage in the context of Huh-7.5
hepatocellular carcinoma cells, which are typically used in HCV
in vitro
studies. In these
cells also, strain-dependent usage of ApoE was observed. In the case of genotypes 2a
(Jc1) and 5a (SA13), virus production was most heavily reduced (more than 100-fold),
while chimeras 4a (ED43) and 6a (HK6a) were ca. 10-fold attenuated, which was
significantly less than for Jc1.
Collectively, this study confirms that all tested HCV strains assemble infectious
progeny in an ApoE-dependent manner. However, we demonstrate that there is a
strain-dependent plasticity in ApoE usage, influenced in a cell type-dependent fashion.
This differential ApoE usage affected not only assembly and release of infectious
particles but also the properties of released virions. Thus, strain-dependent
determi-nants of ApoE usage may have an impact on virus fitness at the level of assembly and
cell entry. The use of the models described in this work in combination with other
available full-length viruses apart from JFH1 to further dissect these differences should
provide interesting insights into the host factors that govern HCV assembly and
infectivity, with possible implications for the natural course of HCV infection.
MATERIALS AND METHODS
Constructs.The Renillaluciferase-encoding reporter virus JcR2a and the different HCV chimeric
isolates used in this study to assess the ApoE dependency for infectious virus particle production have been designed and constructed as described previously (43–47, 58–60). Briefly, these chimeras are composed of the GT2a-derived JFH1 5=nontranslated region (5=NTR), the 3=NTR, and the JFH1 NS3- to NS5B-coding region fused with the core to NS2 genes of J8 (GT2b) (43), S52 (GT3a) (47), ED43 (GT4a) (45), SA13 (GT5a) (44), HK6a (GT6a) (43), or QC69 (GT7a) (43). In the case of H77 (GT1a), Con1 (GT1b), and J6 (GT2a), chimeric constructs were used where the junction between the isolates is located downstream of the first transmembrane domain of NS2, as this crossover position had been found to permit higher levels of infectious virus production for chimeras involving these strains (46). Note that the J6 (GT2a) chimera with this crossover site is usually designated Jc1 and is named such here for simplicity. Collectively, the structural proteins encoded by these chimeras, including core, E1, E2, and p7, thus represent all major HCV genotypes and therefore serve as a model to analyze strain-specific function and host factor interactions during HCV assembly. In some cases, chimeras carry adaptive mutations which optimize virus production of these chimeras in cell culture. These point mutations are highlighted with asterisks in Fig. 1C.
The plasmids encoding the different human ApoE isoforms (pWPI_ApoE2_BLR, pWPI_hApoE3_BLR, and pWPI_ApoE4_BLR) were constructed via PCR-based site-directed mutagenesis and verified by Sanger sequencing as described in one of our previous studies (61). Detailed cloning strategies are available upon request.
Sequence acquisition and alignment.Representative HCV E1E2 sequences were downloaded from
GenBank, trimmed, translated, and aligned according to overlying encoded amino acids utilizing the Clustal W tool in MEGA5 (62). Translated amino acid conservation plots for E1E2 were calculated using a 10-amino-acid sliding window in CLC Genomics Workbench v10.
Molecular phylogenetic analysis.The evolutionary relationships of HCV E1E2 nucleotide sequences were calculated using the maximum-likelihood method implemented in MEGA5 (62) based on the data-specific model (63). The tree with the highest log likelihood (⫺96679.1416) is shown. Initial trees for the heuristic search were obtained automatically as follows. When the number of common sites was
⬍100 or less than one-fourth of the total number of sites, the maximum-parsimony method was used; otherwise, the BIONJ method with MCL distance matrix was used. To assess the significance of clades, the bootstrap approach was employed, whereby 1,000 pseudoreplicate trees were generated using the neighbor-joining method. The presented tree was generated under a GTR⫹I⫹⌫model of substitution: the discrete gamma distribution was used to model evolutionary rate differences among sites (4 categories [⫹⌫, parameter⫽0.5021]). The rate variation model allowed for some sites to be
on November 7, 2019 by guest
http://jvi.asm.org/
arily invariable ([⫹I], 23.9884% sites). The tree is drawn to scale, with branch lengths proportional to the number of substitutions per site. All positions containing gaps and missing data were eliminated from the analysis. The analysis incorporated nucleotide sequences from 495 E1E2 sequences and a total of 1,062 sites.
PHHs.Primary human hepatocytes (PHHs), obtained from the Department of General, Visceral, and
Transplant Surgery at the Hanover Medical School, were cultured as described elsewhere (64). Liver tissue was processed from three different donors undergoing partial hepatectomy and was obtained upon written informed consent (approved by the ethic commission of Hanover Medical School/Ethik-Kommission der MHH, 252-2008). RNA from PHHs and human hepatoma cells (Huh-7.5 and Huh-7.5 [empty]) was extracted using a NucleoSpin RNA kit according to the manufacturer’s instructions (Macherey-Nagel). RNA quality checking was performed using an Agilent Bioanalyzer, and RNA-seq was performed using the Illumina HiSeq 2000 platform. Transcriptomic profiling was performed with a CLC Genomics Workbench v9 (Qiagen Arhaus). Raw Fastq files were mapped against the hg19 human reference genome with annotated gene locations and transcript information. Gene expression was calculated for individual transcripts as reads per kilobase per million bases mapped (RPKM).
Cell culture and cell lines.Huh-7.5 cells, Huh-7.5 ApoE KO cells, and 293T/miR-122 derivatives were cultured in Dulbecco’s modified Eagle’s medium (DMEM) (Invitrogen) supplemented with nonessential amino acids (Invitrogen), 2 mML-glutamine (Invitrogen), and 10% fetal calf serum (FCS) (PAA Laboratories GmbH) (DMEM complete). For selection of positive cell clones, 5g/ml blasticidin (InvivoGen) or 2g/ml puromycin (Sigma) was added.
Lentiviral gene transfer to ectopically overexpress the different human ApoE variants (ApoE2, -E3, and -E4) in 293T/miR-122 cells (33) was performed as described elsewhere (65). In short, plasmids pCMV-ΔR8.74 (66) and pcz-VSV-G (67), and derivatives of pWPI (encoding the gene of interest) were transfected at a 3:1:3 ratio into 293T/miR-122 cells. At 48 h posttransfection, lentiviruses were harvested and used to transduce target cells. Subsequent selection was performed by adding corresponding antibiotics.
The generation of 293T/miR-122 derivatives that ectopically express alternative apolipoproteins (ApoA1, -A2, -C1, and -C3) (41) or the additional liver-derived host factor MTTP (293T/miR-122/hApoE/ MTTP) (33) was described previously.
Generation of CRISPR/Cas9 knockout cell line.Huh-7.5 cells that stably express the Cas9 enzyme
were generated by lentiviral gene transfer as described previously (65), and positive cells were selected by addition of 5g/ml blasticidin (InvivoGen). Guide RNA sequences targeting ApoE were designed with the tool athttp://www.genome-engineering.org/crispr/?page_id⫽41, and oligonucleotides were synthe-sized at IDT Technologies. Oligonucleotides were annealed, phosphorylated, and upon BsmBI digestion subsequently cloned into BsmBI-digested pLKO5d.sgRNA.EFS.PAC. Cloning was verified by Sanger se-quencing. Together with the packaging plasmids pVSV-G and pcMV_ΔR8-74, the guide RNA-containing construct was subsequently transfected into 293T cells to produce lentiviruses that were used to transduce Huh-7.5 Cas9 expressing cells as described previously (65). Selection of positive cells was performed by addition of 2g/ml puromycin (Sigma). Single-cell clones were generated by seeding the cells at a density of 0.5 cell per 96-well plate and incubated until colonies started to grow. ApoE knockout was characterized by ApoE-specific ELISA (Mabtech, Nacka Strand, Sweden). The plasmid encoding the Cas9 enzyme (pLKO5d.EFS.SpCas9.P2A.BSD) and the plasmid harboring the individual guide RNA se-quences (pLKO5d.sgRNA.EFS.PAC) were kindly provided by Dirk Heckl from Hanover Medical School and published previously (68). Detailed cloning strategies are available upon request.
In vitrotranscription and transfection of HCV RNA.In vitrotranscripts of HCV chimeric isolates were generated as described elsewhere (69). RNA integrity and concentration were checked by spec-trophotometry and agarose gel electrophoresis, respectively. Subsequent transfection into target cells was performed as described previously (65). Briefly, trypsinized cells were washed with phosphate-buffered saline (PBS) and resuspended at 1.5⫻107cells/ml in Cytomix (70) containing 5 mM glutathione
and 2 mM ATP prior to transfection with 1g of HCV RNA. Cells were immediately transferred into 10 ml of DMEM complete, and 4 ml of the cell suspension was seeded per 6-cm dish; alternatively, cells were transferred to 16 ml DMEM complete, and 3 ml of the suspension was seeded per well (6-well dish).
Quantification of virus infectivity. For the HCV chimeric isolates, extracellular viral titers were determined via endpoint dilution assay (TCID50) (https://www.klinikum.uni-heidelberg.de/fileadmin/inst
_hygiene/molekulare_virologie/Downloads/TCID50_calculator_v2_17-01-20_MB.xlsx) (71). For infection
assays using theRenillaluciferase reporter virus JcR2a, naive Huh-7.5 cells were seeded at a density of 8⫻104cells per well (12-well plate) at 24 h prior to infection withRenillaluciferase-conditioned cell
culture supernatants. Luciferase expression was quantified at 72 h postinfection by cell lysis with addition of Milli Q water and a single freeze-thaw cycle, followed by addition of Coelenterazine (P. J. K. GmbH).
ELISA.To quantify secreted core protein, conditioned cell culture medium at 48 h posttransfection was inactivated by addition of Triton X-100 (Roth) at a final concentration of 1% (vol/vol), and core protein was quantified with a diagnostic kit (Architect Anti-HCV; Abbott). For quantification of intracel-lular core protein, cells were washed with PBS at 48 h posttransfection, scraped into 1.5-ml tubes, and centrifuged for 5 min at 1,000⫻gat 4°C. Pellets were resuspended in DMEM complete and subjected to five cycles of freezing and thawing in liquid nitrogen followed by an additional centrifugation at 10,000⫻gfor 10 min at 4°C to remove cell debris. Upon addition of Triton X-100 (Roth), core amounts were also quantified with a diagnostic kit (Architect Anti-HCV; Abbott). Amounts of human ApoE and human ApoB100 were determined with commercially available ELISA kits according to the manufactur-er’s instructions (Mabtech, Nacka Strand, Sweden).
Immunoblotting.Intracellular expression of viral and cellular proteins was quantified as described previously (33) using anti-human PDI (1:1,000; Abcam) and anti-mouse– horseradish peroxidase (HRP)
September 2017 Volume 91 Issue 18 e00422-17 jvi.asm.org 14
on November 7, 2019 by guest
http://jvi.asm.org/
(1:20,000; Sigma) antibodies. Human MTTP was detected by probing with anti-human MTTP (1:1,000; Abcam) and anti-rabbit-HRP (1:15,000, Abcam) antibodies. For human ApoE, anti-ApoE (1:1,000; Calbi-ochem) and anti-goat–HRP (1:15,000; Abcam) antibodies were used. The viral protein NS5A was detected with anti-NS5A (9E10; 1:2,000) and anti-mouse–HRP (1:20,000; Sigma) antibodies. An anti-actin anti-body (1:2,000; Sigma), detected with an anti-mouse–HRP antianti-body (1:20000; Sigma), served as loading control.
Statistics.Data were analyzed using GraphPad Prism V.6.0b (GraphPad Software, La Jolla, CA, USA). Statistical analysis was performed by 1- or 2-way analysis of variance (ANOVA) followed by Sidak’s multiple-comparison test or multiplettests corrected with the Holm-Sidak method (****,P⬍0.0001;***, P⬍0.001;**,P⬍0.01;*,P⬍0.05; n.s., nonsignificant [P⬎0.05]; n.d., not detected).
ACKNOWLEDGMENTS
We thank Takaji Wakita and Jens Bukh for kind gifts of the JFH1 genome and several
of the HCV chimeras used in this study. We are grateful to Charles Rice for kind gifts of
Huh-7.5 cells and the anti-NS5A monoclonal antibody, to Matt Evans for the miR-122
expression construct, and to Dirk Heckl for the CRISPR/Cas9 vectors. We are particularly
thankful to Thomas Schulz and the members of his diagnostics team for help with the
quantification of HCV core protein levels. Finally, we acknowledge all members of the
Institute of Experimental Virology for supportive comments and constructive advice.
This work was supported by a grant from the Deutsche Forschungsgemeinschaft
(SFB 900, project A6) and by a grant from the Helmholtz Association (SO-024) to T.P.
REFERENCES
1. Simmonds P, Alberti A, Alter HJ, Bonino F, Bradley DW, Brechot C, Brouwer JT, Chan SW, Chayama K, Chen DS, Choo Q, Colombo M, Cuypers HTM, Date T, Dusheiko GM, Esteban JI, Fay O, Hadziyannis SJ, Han J, Hatzakis A, Holmes EC, Hotta H, Houghton M, Irvine B, Kohara M, Kolberg JA, Kuo G, Lau JYN, Lelie PN, Maertens G, McOmish F, Miyamura T, Mizokami M, Nomoto A, Prince AM, Reesink HW, Rice CM, Roggendorf M, Schalm SW, Shikata T, Shimotohno K, Stuyver L, Trépo C, Weiner A, Yap PL, Urdea MS. 1994. A proposed system for the nomenclature of hepatitis C viral genotypes. Hepatology 19:1321–1324.https://doi.org/
10.1002/hep.1840190538.
2. Smith DB, Bukh J, Kuiken C, Muerhoff AS, Rice CM, Stapleton JT, Sim-monds P. 2014. Expanded classification of hepatitis C virus into 7 geno-types and 67 subgeno-types: updated criteria and genotype assignment web resource. Hepatology 59:318 –327.https://doi.org/10.1002/hep.26744. 3. Lauer GM, Walker BD. 2001. Hepatitis C virus infection. N Engl J Med
345:41–52.https://doi.org/10.1056/NEJM200107053450107.
4. Cooke GS, Lemoine M, Thursz M, Gore C, Swan T, Kamarulzaman A, DuCros P, Ford N. 2013. Viral hepatitis and the global burden of disease: a need to regroup. J Viral Hepat 20:600 – 601.https://doi.org/10.1111/
jvh.12123.
5. Smith DB, Pathirana S, Davidson F, Lawlor E, Power J, Yap PL, Simmonds P. 1997. The origin of hepatitis C virus genotypes. J Gen Virol 78: 321–328.https://doi.org/10.1099/0022-1317-78-2-321.
6. Magiorkinis G, Magiorkinis E, Paraskevis D, Ho SY, Shapiro B, Pybus OG, Allain JP, Hatzakis A. 2009. The global spread of hepatitis C virus 1a and 1b: a phylodynamic and phylogeographic analysis. PLoS Med 6:e1000198.https://doi.org/10.1371/journal.pmed.1000198.
7. Pybus OG, Cochrane A, Holmes EC, Simmonds P. 2005. The hepatitis C virus epidemic among injecting drug users. Infect Genet Evol 5:131–139.
https://doi.org/10.1016/j.meegid.2004.08.001.
8. Simmonds P. 2001. The origin and evolution of hepatitis viruses in humans. J Gen Virol 82:693–712.https://doi.org/10.1099/0022-1317-82
-4-693.
9. Pybus OG, Barnes E, Taggart R, Lemey P, Markov PV, Rasachak B, Syhavong B, Phetsouvanah R, Sheridan I, Humphreys IS, Lu L, Newton PN, Klener-man P. 2009. Genetic history of hepatitis C virus in East Asia. J Virol 83:1071–1082.https://doi.org/10.1128/JVI.01501-08.
10. Kanwal F, Kramer JR, Ilyas J, Duan Z, El-Serag HB. 2014. HCV genotype 3 is associated with an increased risk of cirrhosis and hepatocellular cancer in a national sample of U.S. veterans with HCV. Hepatology 60:98 –105.
https://doi.org/10.1002/hep.27095.
11. Leandro G, Mangia A, Hui J, Fabris P, Rubbia-Brandt L, Colloredo G, Adinolfi LE, Asselah T, Jonsson JR, Smedile A, Terrault N, Pazienza V, Giordani MT, Giostra E, Sonzogni A, Ruggiero G, Marcellin P, Powell EE,
George J, Negro F, HCV Meta-Analysis (on) Individual Patients’ Data Study Group. 2006. Relationship between steatosis, inflammation, and fibrosis in chronic hepatitis C: a meta-analysis of individual patient data. Gastroenterology 130:1636 –1642.https://doi.org/10.1053/j.gastro.2006
.03.014.
12. Bochud PY, Cai T, Overbeck K, Bochud M, Dufour JF, Mullhaupt B, Borovicka J, Heim M, Moradpour D, Cerny A, Malinverni R, Francioli P, Negro F, Swiss Hepatitis C Cohort Study Group. 2009. Genotype 3 is associated with accelerated fibrosis progression in chronic hepatitis C. J Hepatol 51:655– 666.https://doi.org/10.1016/j.jhep.2009.05.016. 13. Zhang J, Nguyen D, Hu KQ. 2016. Chronic hepatitis C virus infection: a
review of current direct-acting antiviral treatment strategies. N Am J Med Sci (Boston) 9:47–54.
14. Pawlotsky JM. 2016. Hepatitis C virus resistance to direct-acting antiviral drugs in interferon-free regimens. Gastroenterology 151:70 – 86.https://
doi.org/10.1053/j.gastro.2016.04.003.
15. Tarr AW, Khera T, Hueging K, Sheldon J, Steinmann E, Pietschmann T, Brown RJ. 2015. Genetic diversity underlying the envelope glycoproteins of hepatitis C virus: structural and functional consequences and the implications for vaccine design. Viruses 7:3995– 4046.https://doi.org/10
.3390/v7072809.
16. Moradpour D, Penin F. 2013. Hepatitis C virus proteins: from structure to function. Curr Top Microbiol Immunol 369:113–142.https://doi.org/10
.1007/978-3-642-27340-7_5.
17. Paul D, Madan V, Bartenschlager R. 2014. Hepatitis C virus RNA replica-tion and assembly: living on the fat of the land. Cell Host Microbe 16:569 –579.https://doi.org/10.1016/j.chom.2014.10.008.
18. Merz A, Long G, Hiet MS, Brugger B, Chlanda P, Andre P, Wieland F, Krijnse-Locker J, Bartenschlager R. 2011. Biochemical and morphological properties of hepatitis C virus particles and determination of their lipidome. J Biol Chem 286:3018 –3032.https://doi.org/10.1074/jbc.M110
.175018.
19. Catanese MT, Uryu K, Kopp M, Edwards TJ, Andrus L, Rice WJ, Silvestry M, Kuhn RJ, Rice CM. 2013. Ultrastructural analysis of hepatitis C virus particles. Proc Natl Acad Sci U S A 110:9505–9510.https://doi.org/10
.1073/pnas.1307527110.
20. Lussignol M, Kopp M, Molloy K, Vizcay-Barrena G, Fleck RA, Dorner M, Bell KL, Chait BT, Rice CM, Catanese MT. 2016. Proteomics of HCV virions reveals an essential role for the nucleoporin Nup98 in virus morphogen-esis. Proc Natl Acad Sci U S A 113:2484 –2489.https://doi.org/10.1073/
pnas.1518934113.
21. Nielsen SU, Bassendine MF, Burt AD, Martin C, Pumeechockchai W, Toms GL. 2006. Association between hepatitis C virus and very-low-density lipoprotein (VLDL)/LDL analyzed in iodixanol density gradients. J Virol 80:2418 –2428.https://doi.org/10.1128/JVI.80.5.2418-2428.2006.
on November 7, 2019 by guest
http://jvi.asm.org/
22. Thomssen R, Bonk S, Propfe C, Heermann KH, Kochel HG, Uy A. 1992. Association of hepatitis C virus in human sera with beta-lipoprotein. Med Microbiol Immunol 181:293–300.https://doi.org/10.1007/BF00198849. 23. Thomssen R, Bonk S, Thiele A. 1993. Density heterogeneities of hepatitis
C virus in human sera due to the bind