Exploring the value of Big Data analysis of
Twitter tweets and share prices
A Thesis submitted by
Peter Wlodarczak, B.Sc. Computer Science, MBA
For the award of Doctor of Philosophy,
Page i
Abstract
Over the past decade, the use of social media (SM) such as Facebook, Twitter, Pinterest and Tumblr has dramatically increased. Using SM, millions of users are creating large amounts of data every day. According to some estimates ninety per cent of the content on the Internet is now user generated. Social Media (SM) can be seen as a distributed content creation and sharing platform based on Web 2.0 technologies. SM sites make it very easy for its users to publish text, pictures, links, messages or videos without the need to be able to program. Users post reviews on products and services they bought, write about their interests and intentions or give their opinions and views on political subjects. SM has also been a key factor in mass movements such as the Arab Spring and the Occupy Wall Street protests and is used for human aid and disaster relief (HADR).
There is a growing interest in SM analysis from organisations for detecting new trends, getting user opinions on their products and services or finding out about their online reputation. Companies such as Amazon or eBay use SM data for their recommendation engines and to generate more business. TV stations buy data about opinions on their TV programs from Facebook to find out what the popularity of a certain TV show is. Companies such as Topsy, Gnip, DataSift and Zoomph have built their entire business models around SM analysis.
The purpose of this thesis is to explore the economic value of Twitter tweets. The economic value is determined by trying to predict the share price of a company. If the share price of a company can be predicted using SM data, it should be possible to deduce a monetary value. There is limited research on determining the economic value of SM data for “nowcasting”, predicting the present, and for forecasting. This study aims to determine the monetary value of Twitter by correlating the daily frequencies of positive and negative Tweets about the Apple company and some of its most popular products with the development of the Apple Inc. share price. If the number of positive tweets about Apple increases and the share price follows this development, the tweets have predictive information about the share price.
A literature review has found that there is a growing interest in analysing SM data from different industries. A lot of research is conducted studying SM from various perspectives. Many studies try to determine the impact of online marketing campaigns or try to quantify the value of social capital. Others, in the area of behavioural economics, focus on the influence of SM on decision-making. There are studies trying to predict financial indicators such as the Dow Jones Industrial Average (DJIA). However, the literature review has indicated that there is no study correlating sentiment polarity on products and companies in tweets with the share price of the company.
Page ii
Analysis (PA). Machine learning (ML) techniques have been adopted to analyse and classify the tweets.
In the first stage of the study, a body of tweets was collected and pre-processed, and then analysed for their sentiment polarity towards Apple Inc., the iPad and the iPhone. Several datasets were created using different pre-processing and analysis methods. The tweet frequencies were then represented as time series. The time series were analysed against the share price time series using the Granger causality test to determine if one time series has predictive information about the share price time series over the same period of time. For this study, several Predictive Analytics (PA) techniques on tweets were evaluated to predict the Apple share price.
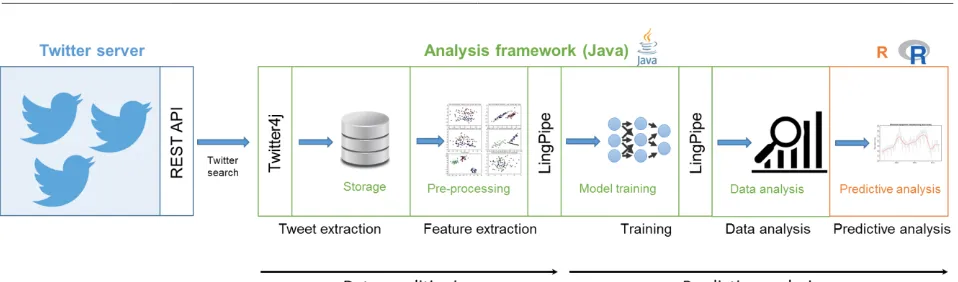
To collect and analyse the data, a framework has been developed based on the LingPipe (LingPipe 2015) Natural Language Processing (NLP) tool kit for sentiment analysis, and using R, the functional language and environment for statistical computing, for correlation analysis. Twitter provides an API (Application Programming Interface) to access and collect its data programmatically.
Whereas no clear correlation could be determined, at least one dataset was showed to have some predictive information on the development of the Apple share price. The other datasets did not show to have any predictive capabilities. There are many data analysis and PA techniques. The techniques applied in this study did not indicate a direct correlation. However, some results suggest that this is due to noise or asymmetric distributions in the datasets.
Page iii
Certification of Thesis
This thesis is entirely the work of Peter Wlodarczak except where otherwise acknowledged. The work is original and has not previously been submitted for any other award, except where acknowledged.
Student and supervisors signatures of endorsement are held at USQ. Principal Supervisor
Page iv
Acknowledgements
I would like to thank my supervisors for their valuable input. Special thanks go to my principal supervisors, Dr. Mustafa Ally and Prof. Dr. Jeffrey Soar, for their encouragement and always constructive feedback. I am grateful for their patience, guidance and insight throughout this research project and for them proof-reading the thesis.
Page v
Table of content
1 Introduction ... 1
1.1 Background ... 1
1.2 Justification for the research ... 2
1.3 Research methodology ... 3
1.3.1 Data conditioning phase ... 5
1.3.2 Predictive analysis phase ... 5
1.4 Delimitation of the scope and key assumptions ... 7
1.5 Key definitions and terminologies ... 9
1.5.1 Computational social science (CSS) ... 9
1.5.1.1 Social media mining (SMM) ... 10
1.5.1.2 Sentiment analysis ... 10
1.5.2 Big Data ... 11
1.5.2.1 Data mining (DM) ... 12
1.5.2.2 Predictive analytics (PA) ... 12
1.5.3 Artificial intelligence (AI) ... 13
1.5.3.1 Machine learning (ML) ... 13
1.5.3.2 Data classification ... 14
1.5.4 Theoretical framework ... 15
1.6 Publication list ... 16
1.7 Structure of the thesis ... 17
2 Literature review ... 19
2.1 Introduction ... 19
2.1.1 Computational social science ... 21
2.1.1.1 Social media mining ... 21
2.1.1.2 Sentiment analysis (SA) ... 25
2.1.1.3 Quantifying social media data ... 26
2.1.1.4 Frameworks for computational analysis ... 28
2.1.2 Big Data ... 32
2.1.2.1 Data mining (DM) ... 34
2.1.2.2 Predictive analysis (PA) ... 37
2.2 A framework for analysing Twitter data ... 40
2.3 Research question and issues ... 41
2.4 Summary ... 42
3 Research methodology ... 44
3.1 Introduction ... 44
3.1.1 Data conditioning phase ... 44
3.1.1.1 Data collection of Twitter data ... 44
3.1.1.1.1 Datasets ... 49
3.1.1.2 Data pre-processing ... 50
3.1.2 Predictive analysis phase ... 52
3.1.2.1 Data classification ... 52
3.1.2.2 Correlations ... 57
3.2 Data analysis framework ... 59
3.3 Justification for the paradigm and methodology ... 60
Page vi
3.5 Conclusions ... 64
4 Data analysis ... 65
4.1 Introduction ... 65
4.2 Data mining ... 65
4.2.1 Data conditioning phase ... 65
4.2.1.1 Access method ... 67
4.2.1.1.1 Queries ... 69
4.2.1.2 Data collection ... 70
4.2.1.3 Data pre-processing ... 74
4.2.1.4 Natural language processing ... 75
4.2.1.4.1 Data deduplication ... 77
4.2.1.4.2 Basic subjectivity analysis ... 78
4.2.1.5 Classifier evaluation ... 79
4.2.2 Predictive analysis phase ... 85
4.2.2.1 Multigram language model ... 88
4.2.2.2 Naïve Bayes ... 91
4.2.2.3 Logistic regression ... 96
4.2.2.4 Summary ... 99
4.2.2.5 Granger causality test ... 99
4.3 Results ... 103
4.3.1 Apple datasets ... 103
4.3.2 iPad datasets ... 104
4.3.3 iPhone datasets ... 105
4.4 Conclusions ... 106
5 Conclusions and implications ... 112
5.1 Introduction ... 112
5.2 Conclusions about the research problem ... 112
5.3 Implications for theory ... 114
5.4 Implications for policy and practise... 117
5.5 Limitations ... 119
5.6 Further research ... 121
5.7 Conclusions ... 124
6 Appendices ... 127
6.1 References ... 127
6.2 Queries ... 147
6.3 Results ... 148
6.3.1 Results of the Granger causality test ... 148
6.3.1.1 Apple unclassified ... 148
6.3.1.2 Apple classified naïve Bayes ... 149
6.3.1.3 Apple classified Logistic Regression ... 150
6.3.1.4 iPad unclassified ... 151
6.3.1.5 iPad classified naïve Bayes ... 152
6.3.1.6 iPad classified Logistic Regression ... 153
6.3.1.7 iPhone unclassified ... 154
6.3.1.8 iPhone classified naïve Bayes ... 154
6.3.1.9 iPhone classified Logistic Regression ... 156
Page vii
List of tables
Table 1-1: Publication list... 17
Table 2-1: Literature search terms ... 20
Table 2-2: Computational social science literature overview ... 31
Table 2-3: Big Data literature overview ... 40
Table 4-1: Twitter query for Apple ... 69
Table 4-2: Excel export of AAPL quotes ... 73
Table 4-3: Data deduplication percent per term ... 78
Table 4-4: Summary statistics for basic subjectivity analysis... 79
Table 4-5: Confusion matrices ... 80
Table 4-6: Percentage of objective statements ... 84
Table 4-7: Test sentences ... 89
Table 4-8: Test sentence results with 737 training tweets ... 90
Table 4-9: Summary statistics for Language Model classifier ... 90
Table 4-10: Confusion matrices ... 91
Table 4-11: Test sentence results with 737 training tweets ... 93
Table 4-12: Naïve Bayes classifier ... 94
Table 4-13: Confusion matrices ... 94
Table 4-14: Naïve Bayes classifier using 10-fold cross-validation ... 95
Table 4-15: Confusion matrices ... 95
Table 4-16: Logistic regression without cross-validation ... 97
Table 4-17: Confusion matrices ... 97
Table 4-18: Logistic regression with 10-fold cross-validation... 98
Table 4-19: Confusion matrices ... 98
Table 4-20: Logistic regression using character n-grams ... 98
Table 4-21: Confusion matrices ... 98
Table 4-22: Apple unclassified ... 103
Table 4-23: Apple classified ... 104
Table 4-24: iPad unclassified ... 104
Table 4-25: iPad classified... 105
Table 4-26: iPhone unclassified ... 105
Table 4-27: iPhone classified ... 106
Table 6-1: Apple unclassified ... 149
Table 6-2: Apple classified naïve Bayes ... 150
Table 6-3: Apple classified Logistic Regression ... 151
Table 6-4: iPad unclassified ... 151
Table 6-5: iPad classified naïve Bayes ... 153
Table 6-6: iPad classified Logistic Regression ... 154
Table 6-7: iPhone unclassified ... 154
Table 6-8: iPhone classified naïve Bayes ... 155
Page viii
List of figures
Figure 1-1: Analysis phases ... 4
Figure 1-2: Data conditioning and pretictive analysis stages ... 7
Figure 1-3: Theoretical framework ... 15
Figure 3-1: Twitter data query output ... 47
Figure 3-2: Twitter search ... 48
Figure 3-3: Relevance filtering of tweet ... 50
Figure 3-4: Machine learning cycle ... 55
Figure 3-5: Binary sentiment classification time series ... 57
Figure 3-6: Tweets about Apple Inc. and AAPL share price ... 58
Figure 3-7: Data analysis framework ... 60
Figure 4-1: Twitter data mining steps ... 65
Figure 4-2: Number of tweets about Apple, the iPhone and the iPad ... 66
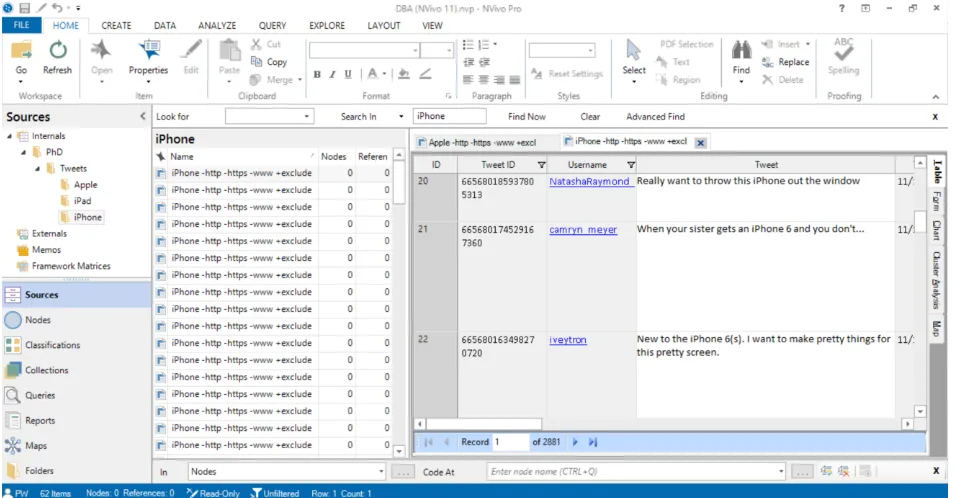
Figure 4-3: Tweets imported in NVivo ... 71
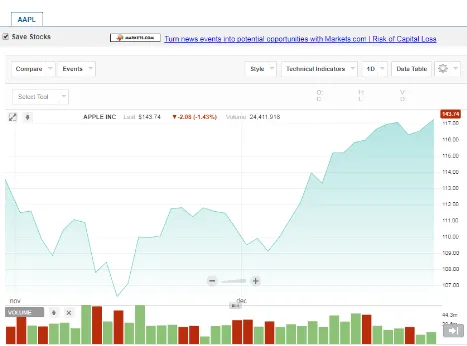
Figure 4-4: AAPL quotes over a period of 2 month ... 73
Figure 4-5: Precision Recall... 82
Figure 4-6: Receiver Operating Characteristic... 84
Figure 4-8: Naive Bayes classifier ... 94
Figure 4-9: Sample grangertest output ... 101
Figure 4-10: R time series plot of Apple tweet frequency and share price ... 102
Figure 4-11: Frequencies of tweets ... 109
Figure 4-12: Apple Q4 2015 results (Apple Inc. 2016) ... 110
List of equations Equation 3-1: Classification probability ... 55
Equation 4-1: Jaccard index ... 77
Equation 4-3: F1 score ... 81
Equation 4-4: Precision ... 82
Equation 4-5: Recall ... 82
Equation 4-6: Kappa coefficient ... 83
Equation 4-7: Observer agreement ... 83
Equation 4-8: Category probability ... 92
Page 1
1 Introduction
1.1 Background
Opinions are central to almost all human activities because they are key influences of our behaviours (Liu 2012, p. 2). People want to know other people’s opinions whenever they
need to make a decision about choosing a holiday destination, making a voting decision in an election, selecting a restaurant or buying a new car. Emotions towards products or services influence our purchasing decisions. Behavioural economics tells us that emotions can profoundly affect individual behaviour and decision-making (Bollen, Mao & Zeng 2010, p. 1).
In the past, people turned to friends and family whenever they wanted to know an individual’s opinion. When an organisation wanted to obtain public opinions, it had to
conduct surveys, focus groups or polls. With the unprecedented rise of the internet and especially Web 2.0 technologies, sharing opinions and views has become increasingly easy. Web 2.0 is a technology shifting the Web to turn it into a more participatory platform, in which people not only consume content (via downloading) but also contribute and produce new content (via uploading) (Darwish & Lakhtaria 2011, p. 204).
Page 2
With the explosive growth in the availability and use of Social Media (SM) (e.g., reviews, forum discussions, blogs, microblogs, comments, and postings in social network sites) on the Web, individuals and organisations are increasingly using the content in these media for decision making (Liu 2012, p. 2). Customer reviews make a significant impact on the purchasing decision of potential customers (Smith et al. 2011, p. 20). As such they can influence the propensity of customers to buy products or services or influence the choices for holiday destinations or restaurants. If reviews written in the past influence future actions of customers, SM data has the potential to be used for forecasting, predicting the future, or nowcasting, that is, to predict the present in real-time, for instance the rise or fall of share prices.
Organisations have realised the potential of SMM (Social Media Mining) in extracting actionable patterns that can be beneficial for business, users and consumers (Gundecha & Liu 2012, p. 1). SM is analysed for its potential to predict sales volumes, to identify customers who are likely to switch the supplier or to determine customer satisfaction. If opinions can be used to make predictions about sales volumes, they might also have predictive information about other financial indicators.
Not surprisingly, the need for studying and understanding the social phenomena underlying such communities has recently given rise to a new field of work, known as Computational Social Science, which is materializing at the crossroads of computer science and the social sciences (Smith et al. 2011, p. 1).
1.2 Justification for the research
Page 3
Mao & Zeng 2010; Barberá & Rivero 2013; Gerber 2014; Burnap et al. 2015; Tsakalidis et al. 2015). Predictive Analysis (PA) of SM data is a recent area of research (Hong Keel, Dennis & Yuan 2014; Burnap et al. 2015; Tsakalidis et al. 2015). Despite attracting an increasing number of researchers; many areas are still unexplored. The potential of analysing SM has been recognized but the literature review in chapter 2 Literature review has identified gaps in exploring the influence of SM on share price developments. Also there are many different techniques for SMM and PA. Some have proven to be very effective for certain tasks but have performed less well in other environments. Ipso facto, assessing the best performing methods for a specific problem is an important SMM task since often it is not possible to tell a priori which method will yield the best results (Witten, Frank & Hall 2011). Analysing and evaluating different SMM and PA techniques and algorithms can thus lead to better outcomes, and research in this area has the potential to improve the analysis of SM and the accuracy of PA (Huang et al. 2013).
1.3 Research methodology
Data analysis, in the context of this study, comprises two phases. The first phase is the data conditioning phase where data is collected, and passed through pre-processing steps such as relevance filtering or data deduplication. The main purpose of the data conditioning phase is the transformation of noisy raw SM data into high-quality data that will enable the computation of predictor variables (Kalampokis, Tambouris & Tarabanis 2013, p. 546).
Page 4
based on a new set of observations, where ‘new’ can be interpreted as observations in future or observations that were not included in the original data sample (Kalampokis, Tambouris & Tarabanis 2013, p. 546).
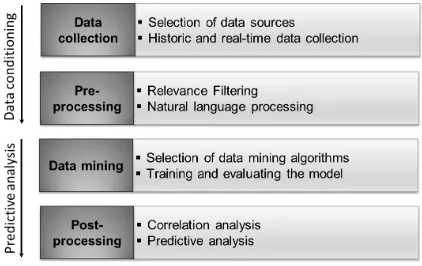
The data conditioning phase consists of two steps: 1. Data collection of Twitter data
2. Data pre-processing
[image:13.595.94.516.368.634.2]The PA phase consists of following steps: 3. Model evaluation and data analysis 4. Correlation and PA
Figure 1-1 summarizes the steps of each phase.
Figure 1-1: Analysis phases
Page 5
1.3.1 Data conditioning phase
During the data conditioning phase, the time window has to be defined, that is, the time period over which data is collected. The query terms used for the data search have to be selected, the prediction variables, that is, the observation points in the data, have to be defined and the method for data extraction has to be evaluated. For this study, two months of tweets about Apple and its most popular products were collected. In the case of Twitter tweets, tweets can be collected either through Twitter’s Application
Programming Interface (API) or using a screen scraper. Other possibilities include online data collectors or data brokers. For this study the data was collected through the Twitter Search API and using the NVivo NCapture screen scraper. The Twitter Search API has the advantage that tweets can be collected automatically and the collection task can be run over an extended period of time. The prediction variables selected for this study are words in the tweets, word frequencies (bag of words approach), tweet frequencies, tweet and tokens. The collected, raw data has to be relevance filtered to remove irrelevant data such as spam or off topic tweets. Depending on the data, other tasks such as data deduplication, retweets removal or record linkage might be necessary. For this study, basic subjectivity analysis and data deduplication were performed to “clean” the data.
1.3.2 Predictive analysis phase
Page 6
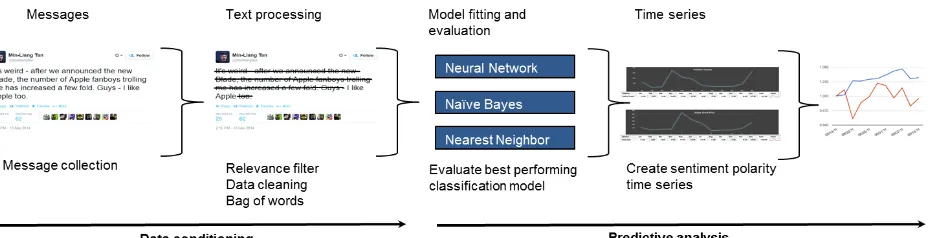
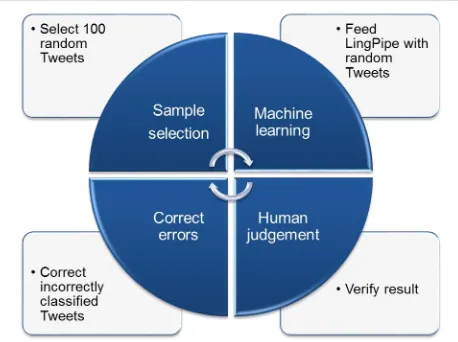
positive or negative. A multi-dimensional mood model captures additional mood dimensions such as excellent, good, neutral, bad, poor or very poor. Mood dimensions can be derived from the Profile of Mood States (POMS), a well-vetted psychometric instrument (Bollen, Mao & Zeng 2010, p. 3). For this study, binary mood classification was used which classifies tweets into positive and negative tweets about Apple and its products. Selection of the predictive method will mean selecting, for example, supervised, unsupervised or semi-supervised Machine Learning (ML) algorithms. Usually, different models are trained and the best performing scheme is chosen. The selected scheme is then used to classify new, unseen data, for example tweets. Classification is a common example of a process that can be undertaken using supervised ML. Supervised methods can also be used for regression. Grouping tweets into positive and negative tweets is a binary classification task. That is why, for this study, supervised methods for binary classification and for regression were evaluated. For supervised learning algorithms, a given data set is typically divided into two parts: training and testing datasets with known class labels (Gundecha & Liu 2012, p. 2). The class labels in this study are the mood states of “positive” and “negative”. These datasets
Page 7
[image:16.595.77.543.369.488.2]time. Time series analysis is a popular method for finding correlations. The classified data collected for this study is represented as time series, viz. the number of positive and negative tweets over a certain period of time. The second time series is the share price over the same period of time. The two series are evaluated to determine if they can be correlated to each other. The goal is to determine if a time series A has predictive power over a time series B. If it has, it can be used to make predictions using future, unseen data. This study used the Granger causality test to correlate the Twitter mood states time series with the share price development. Figure 1-2 summarizes these steps for a Twitter tweet.
Figure 1-2: Data conditioning and pretictive analysis stages
Each step typically goes through many iterations until satisfactory results are obtained. These steps will be described in more detail in chapter 3. Research methodology.
1.4 Delimitation of the scope and key assumptions
Page 8
perform as well as they do for long texts (Liang & Dai 2013). The SMM algorithms were evaluated in order to address the issues of scarce texts and colloquial language. However, the goal is not to find new algorithms for short text messages, but to apply suitable methods for the problem at hand.
There are many Data Mining (DM) algorithms and not all of them can be evaluated. The algorithms selected for this study are based on the ones identified in the literature review in chapter 2 Literature review. In previous studies, some algorithms have shown to perform well for similar tasks. They were evaluated and used in the framework developed for this thesis.
Free access to the Twitter search API is limited to a 15 minute quota (Twitter Developers 2015). This means that for collecting tweets, after a search query has been executed, the collection algorithm has to wait for 15 minutes before it can execute the next search query. Consequently, data collection has to run over an extended period of time. With its large and growing user base, Twitter has currently more than 317, 000, 000 monthly active users (Statista 2016) and members of different social classes are represented on Twitter. Nevertheless, there is a self-selection bias: only users who have chosen to be on Twitter are represented in the collected data. Also:
Not everybody is using Twitter
Not every Twitter user tweets opinions or tweets at all
Not every tweet is giving an honest opinion
Page 9
sockpuppet, to hide their true identity and tweet fake opinions. If these numbers are not significant, the results will only be marginally affected. However, if they are large, it will influence the outcomes. In this study only English tweets were analysed. The largest Twitter user base is in the US (Statista 2016). The assumption is that when analysing English tweets, the number is large enough that fake tweets have no significant impact on the results. Also, since a large, active user base tweets in English, the body of tweets have a representational demographic distribution in terms of age, gender, ethnic classification or social group. This study does not aim to create high quality samples but assumes that Big Data principles will smoothen uneven distributions if the datasets are large Since Big Data needs large data volumes to get meaningful results. The study focused on opinions on Apple and Apple products. Apple is a well-known company with well-established products used by many people worldwide. Hence, many people tweet about it and its products as the data collection task revealed.
1.5 Key definitions and terminologies
This chapter forms the basis for the subsequent parts of the dissertation by providing the key definitions and concepts.
1.5.1 Computational social science (CSS)
Page 10
(Lazer et al. 2009, p. 722). Computational social science is a fledging interdisciplinary field at the intersection of the social sciences, computational science, and complexity (Cioffi-Revilla 2010, p. 259).
CSS has two subareas relevant to the proposed research, social media mining (SMM) and sentiment analysis.
1.5.1.1 Social media mining (SMM)
Social Media Mining (SMM) is the process of representing, analysing, and extracting actionable patterns from SM data (Zafarani, Abbasi & Liu 2014, p. 2). SM data consists of the individuals, the entities such as content and sites, and the connections and interactions between the individuals. These interactions represent the social capital (SC) of SM data. SC is an investment in social relations with expected returns (Lin, Burt & Cook 2001, p. 6). SC is unlike other forms of capital in that it is not possessed by individuals, but resides in the relationships that individuals have with one another (Smith et al. 2011, p. 2). SMM takes into consideration these relations of the data when analysing it. Analysing SM data is the task of mining user-generated content with social relations (Zafarani, Abbasi & Liu 2014, p. 2).
1.5.1.2 Sentiment analysis
Sentiment analysis, also called opinion mining, is the field of study that analyses people’s
Page 11
To extract the opinions from user generated content, the natural language has to be transformed into a more formal representation such as a tree structure that is easier to interpret for a computer. This technique is called Natural Language Processing (NLP), a field in computer science and linguistics which is concerned with the interactions between computers and human (natural) languages (Olive, Christianson & McCary 2011, p. 1).
1.5.2 Big Data
A universally agreed upon definition of "Big Data" has not been developed to date (Finlay 2014). Big Data refers to data that is too big to fit on a single server, too unstructured to fit into a row-and-column database, and/or too continuously flowing to fit into a static data
warehouse (Davenport 2014, p. 1). Big Data does not refer to large data volumes alone. Big Data also has increased velocity (i.e., the rate at which data is transmitted and received), complexity, and variety compared to data sources of the past (Franks 2012, p. 5). This is usually referred to by the three V’s: Volume, Velocity and Variety. Big Data
Page 12
1.5.2.1 Data mining (DM)
Data mining (DM), also popularly referred to as knowledge discovery from data (KDD), is the automated or convenient extraction of patterns representing knowledge implicitly stored or captured in large databases, data warehouses, the Web, other massive information repositories, or data streams (Han, Kamber & Pei 2011, p. xxiii). DM involves statistical and/or artificial intelligence analysis, usually applied to large-scale datasets
(Olson & Delen 2008, p. 4).
Throughout the literature review no consensus was found to distinguish Big Data and DM. Some authors define DM as the analysis of large and complex datasets (Finlay 2014). Others define DM as the process of information generalization (Menasalvas & Wasilewska 2006). Some authors define DM as the analysis of the datasets themselves and Big Data the analysis of the relations between the datasets. In this thesis the terms are used interchangeably. SMM is a form of Big Data analysis based on SM data. It finds patterns and relations in SM data that can be used for better understanding customer needs, voters’ preferences or detecting future crisis. DM turns a large collection of data
into knowledge (Han, Kamber & Pei 2011, p. 2).
1.5.2.2 Predictive analytics (PA)
Page 13
experience (data) to predict the future behaviour of individuals in order to drive better decisions” (Siegel 2013, p. 11).
1.5.3 Artificial intelligence (AI)
Artificial intelligence (AI) is a branch of computer science. The central scientific goal of AI
is to understand the principles that make intelligent behaviour possible in natural or artificial systems (Poole & Mackworth 2010, p. 4). In the literature there are many ways
AI is defined. AI deals with symbolic, non-algorithmic methods of problem solving. In this thesis, AI is referred to as the study of making computers do things associated with tasks humans do better at the moment. AI is that part of computer science concerned with designing intelligent computer systems that exhibit the characteristics associated with intelligence in human behaviour (Akerkar 2005, p. 2). ML is an area of AI where computers have the capability to learn. Learning involves an agent remembering the past in a way that is useful for the future (Poole & Mackworth 2010, p. 283). ML techniques are widely used in DM since they can generate rules that would be too complex or too many for a developer to program manually.
1.5.3.1 Machine learning (ML)
Page 14
conditioning steps, ML algorithms are not domain specific and can be used for any data mining task. ML algorithms have been applied to many natural language processing problems, including text classification, part of speech tagging, parsing, named entity
recognition, word sense disambiguation, etc., each requiring a large number of labelled examples such as documents and their classes, words in the context and their senses as training data (Law & Ahn 2011, p. 9).
The application of ML methods to large databases is called DM (Alpaydin 2004, p. 2). These datasets are often too large for traditional DM techniques. Also, ML techniques have been used in NLP because understanding and interpreting natural language has been a challenging task with conventional techniques such as lexicon-based methods (Liu 2012, p. 119). ML schemes can be trained with a large corpus of text documents to mitigate the short comings of traditional methods. As such, the building of machines to automatically parse and understand natural languages has been a central endeavour for researchers in Artificial Intelligence (Al), Information Retrieval (IR) and Natural Language
Processing (NLP) (Law & Ahn 2011, p. 9). However, it is also useful to realize that sentiment analysis is a highly restricted NLP problem because the system does not need to fully understand the semantics of each sentence or document but only needs to understand some aspects of it, i.e., positive or negative sentiments, and their target entities or topics (Liu 2012, p. 13). Also, opinion mining is highly domain specific. Training data for one domain might perform poorly on test data from another domain.
1.5.3.2 Data classification
Classification is the process of finding a model (or function) that describes and
Page 15
a set of training data (i.e., data objects for which the class labels are known). The model is used to predict the class label of objects for which the class label is unknown (Han, Kamber & Pei 2011, p. 18). In their work Han et al (2011) focus on the feasibility, usefulness, effectiveness, and scalability of techniques of large datasets. In this study, classification techniques were used to classify tweets into their sentiment polarity over a certain time frame.
1.5.4 Theoretical framework
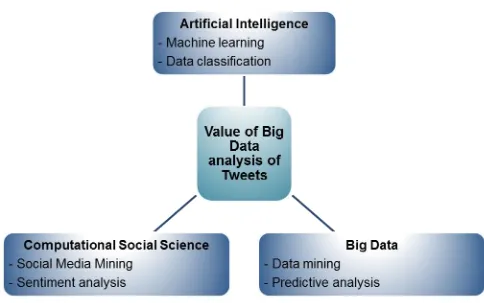
[image:24.595.70.554.393.696.2]The theoretical framework is based on AI, CSS and Big Data. Figure 1-3 shows the research question in its theoretical framework:
Page 16
A framework developed for this study was used for analysing Twitter tweets and finding correlations with share prices. It used DM techniques for collecting and analysing data and ML techniques for data classification and finding correlations. Its contribution is to determine how SM mining, viz. Twitter tweets, can be used for PA for financial markets. Several SMM, sentiment analysis, PA and Big Data techniques were evaluated to build the framework. The best performing ones were then used on the actual data to be classified.
1.6 Publication list
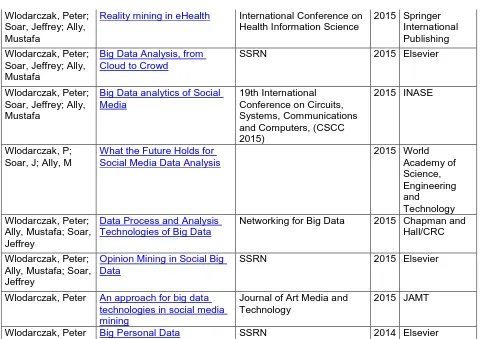
As part of this thesis, several papers and book chapters were published, and some of the research was presented at conferences. Table 1-1: Publication list
lists the papers that were published as part of the study:
Authors Title Publication Year Publisher
Wlodarczak, Peter Smart Cities, Enabling technologies for future living
City Networks - Planning for Health and Sustainability
2017 Springer International Publishing Wlodarczak, Peter Cyber Immunity, A
Bio-Inspired Cyber Defense System
International Conference on Bioinformatics and
Biomedical Engineering
2017 Springer International Publishing Wlodarczak, Peter;
Soar, Jeffrey; Ally, Mustafa
Context Aware Computing for Ambient Assisted Living
International Conference on Smart Homes and Health Telematics
2016 Springer International Publishing Wlodarczak, Peter;
Soar, Jeffrey; Ally, Mustafa
Genome mining using machine learning techniques
International Conference on Smart Homes and Health Telematics
2015 Springer International Publishing Wlodarczak, Peter;
Soar, Jeffrey; Ally, Mustafa
Multimedia data mining using deep learning
IEEE Xplore 2015 IEEE
Wlodarczak, Peter; Qian, Siyu; Ally, Mustafa; Soar, Jeffrey
Social genome mining for crisis prediction
21st ACM SIGKDD Conference on Knowledge Discovery and Data Mining
2015 PopInfo'15
Wlodarczak, P.; Soar, J.; Ally, M.
Behavioural health analytics using mobile phones
EAI Endorsed Transactions on Scalable Information Systems
Page 17 Wlodarczak, Peter;
Soar, Jeffrey; Ally, Mustafa
Reality mining in eHealth International Conference on Health Information Science
2015 Springer International Publishing Wlodarczak, Peter;
Soar, Jeffrey; Ally, Mustafa
Big Data Analysis, from Cloud to Crowd
SSRN 2015 Elsevier
Wlodarczak, Peter; Soar, Jeffrey; Ally, Mustafa
Big Data analytics of Social Media
19th International Conference on Circuits, Systems, Communications and Computers, (CSCC 2015)
2015 INASE
Wlodarczak, P; Soar, J; Ally, M
What the Future Holds for Social Media Data Analysis
2015 World
Academy of Science, Engineering and Technology Wlodarczak, Peter;
Ally, Mustafa; Soar, Jeffrey
Data Process and Analysis Technologies of Big Data
Networking for Big Data 2015 Chapman and Hall/CRC Wlodarczak, Peter;
Ally, Mustafa; Soar, Jeffrey
Opinion Mining in Social Big Data
SSRN 2015 Elsevier
Wlodarczak, Peter An approach for big data technologies in social media mining
Journal of Art Media and Technology
2015 JAMT
[image:26.595.69.550.84.423.2]Wlodarczak, Peter Big Personal Data SSRN 2014 Elsevier
Table 1-1: Publication list
At the time of writing, the book chapter “Smart Cities, Enabling technologies for future living” had not been published yet.
1.7 Structure of the thesis
Page 18
The second chapter reviews the literature to build the theoretical foundation of the study and gives an overview of research related to the area of this thesis that has been conducted thus far. It identifies key issues which form the basis of the research.
The third chapter describes the theoretical framework of the research and refines the research question and issues.
The fourth chapter provides a detailed description of the adopted research methodology. It describes the data collection and analysis methods and the approach taken to find correlations. Finally, the limitations and ethical concerns are addressed.
Page 19
2 Literature review
2.1 Introduction
The previous chapter identified the research problem and provided an overview of the research methodology. This chapter reviews the current literature upon which the theoretical basis of this thesis is built. The two main areas of literature reviewed were in the areas of CSS and Big Data. Based on the interdisciplinary nature of the research there are several related areas covered in this review. Also, there are overlaps, for instance there is no clear separation between CSS and Big Data. SMM is a form of Big Data analysis and here also is no clear distinction between Big Data analysis and DM. Different authors use these terms interchangeably (Alpaydin 2004; Menasalvas & Wasilewska 2006; Finlay 2014). The review focuses on literature directly relevant to the research. ML and classification are covered in the sections on literature on SMM and PA since they are supporting theories in these fields.
Page 20
The literature review is based mostly on searches in the University of Southern Queensland (USQ) online library and on Google Scholar, but also on other online libraries and indexing sites such as CiteSeerX or arXiv.org.
The search terms were initially selected to focus on the research areas as described in chapter 1.5.4 Theoretical framework. Then they were narrowed down to include only search results in the specific area, for instance PA, PA using SM, PA using Twitter. Table 2-1: Literature search terms lists the search terms that were used:
Data Mining Big Data
Artificial Intelligence Machine learning Predictive Analytics Opinion mining Data mining
Social media mining Social media analysis Twitter analysis
Predictive analysis using social media Predictive analysis using Twitter Big Data analysis using social media natural language processing
social media using machine learning behavioural analytics
natural language processing using social media opinion mining on social media
opinion mining for predictive analytics research methodology
research framework theoretical framework predicting share price
predicting financial indicators
Page 21
2.1.1 Computational social science
There is an extensive literature about CSS. The literature review focused on literature relevant for this thesis which is CSS itself and opinion mining.
2.1.1.1 Social media mining
Page 22
provide very suitable techniques that can handle the large volumes of data and their heterogeneous nature. Since the invention of the first ML algorithms in 1959 (Samuel 1959), many new ML algorithms have been developed and are widely used now for SMM and Big Data analysis.
DM “algorithms cover classification, clustering, statistical learning, association analysis, and link mining, which are all among the most important topics in DM research and development” (Wu et al., 2007, p. 2). Wu et al. (2007) have identified the top ten
algorithms used in SMM. These algorithms are at the heart of SMM. They identified the following algorithms, C4.5, k-Means, SVM (Support Vector Machines), Apriori, EM (Expectation Maximisation), PageRank, AdaBoost, kNN (k-Nearest Neighbor), Naïve Bayes, and CART (Classification And Regression Trees), which are considered to be among the best techniques in this area. Most belong to the family of ML algorithms except for PageRank, which is based on webgraphs and graph theory. Wu et al. (2007) conclude that they are “among the most influential algorithms for classification, clustering, statistical learning, association analysis and link mining” (Wu et al., 2007, p.
34).
Page 23
2012). Ensemble learners work well in noisy environments, which is a typical characteristic of SM data. Even adding noise can improve the results in some cases. Noise can be described as items that carry no content of knowledge (Du 2013, p. 63). AdaBoost is an ensemble learner that has been developed specifically for classification.
It can be applied to any classification learning algorithm (Witten, Frank & Hall 2011, p. 359). Unfortunately, ensemble classifier methods do not take into account the interpretability of final classification (Bouktif & Awad 2013, p. 837). This lack of interpretability makes it difficult to determine which factors contribute to the result and to what extent.
Page 24
A different approach in the area of SMM is also used by Schreck & Keim (2013). They use a visualization approach to perceive information in SM. They point out the advantages of visual analysis to extract multifaceted information and correlate it with textual, geospatial, temporal, and other contextual data. This approach can be used on such data to track opinions about new products and services, fads and trends in popular culture, adverse reactions to prescription drugs, infectious disease epidemiology, fraud and other types of criminal activity, the public’s response to a political candidate or proposed legislation, motor vehicle defects, and different groups’ consumption habits
(Schreck & Keim 2013, p. 69). However, they do not describe the details of their methodology or techniques that they used. SMM has become mainstream in research and new studies continue to appear analysing SM from different perspectives Xinyu, Youngwoon & Suk Young (2015) analysed tweets to predict the time and location where a specific type of crime was likely to occur. They used sentiment analysis of tweets and correlated it with weather data and historic crime data from a database. By correlating sentiment polarity and external influences, in their case weather data, they obtained better results from a hot-spot kernel density estimation model on theft incidents. Adding external influences to the analyses used in studies such as marketing campaigns or product announcements could be potential fields of future research. Wei, Mao & Wang (2015)) investigated the relationship between Twitter volume spikes and stock options pricing. They concluded that stock volatility around a Twitter volume spike and found that a three-parameter model that used the same drift and different volatilities before and after a Twitter volume spike provided the highest gain in the likelihood value. The work of Tsakalidis et al. (2015) focused on exploiting Twitter’s content to predict the 2014 EU
Page 25
intentions and treated it as time-variant features. They employed time series analysis as well as sentiment analysis of tweets. They did not train a classifier but applied a lexicon-based approach for sentiment analysis. Ishijima, Kazumi & Maeda (2015) analysed the sentiment towards the Japanese economy that might appear in daily news articles. They used word frequencies to classify articles into positive or negative articles about the current economic situation in Japan. They then constructed a daily summary index and performed statistical analysis to examine correlations between the sentiment index and Tokyo Stock Exchange prices. They concluded that the index significantly predicts stock prices of three days in advance. This study also used frequency analysis; however the prediction accuracy was lower from more sophisticated classifiers.
2.1.1.2 Sentiment analysis (SA)
Page 26
developed a new approach they called Implicit Sentiment Mining to overcome some of the difficulties. They rely on a psychological phenomenon called mirroring. To use mirroring, they collected a sample of texts from speeches of political candidates and Twitter posts from the same period which they processed through a linguistic pipeline to gauge overall party preference and propensity to vote for a specific candidate. Pang and Lee (2008) analysed methods for opinion mining and SA. They asserted that opinions are an important factor in the decision making process. They proposed a search specialized engine to get opinions and applications for different kinds of opinion Web sites. They provided, among others, an application for Business Intelligence. Taking this a step further, our proposed study quantifies the value of such an application. They provide a detailed description on how opinions were extracted, classified and summarized, both text based and graphic based. They also cover credibility, net authority and net influence.
2.1.1.3 Quantifying social media data
There have been many attempts to capitalize on the so-called “wisdom of the crowd”
Page 27
customers, increasing revenue from existing customers and retaining new customers (Garcia Martinez & Walton 2014). As traditional advertising is losing its impact, both advertisers and the media owners who are dependent upon them are desperately seeking alternative ways to reach consumers and alternative ways to earn revenue (Clemons 2009, p. 46). Goh, Heng and Lin (2012) analysed the effect of direct marketer efforts on a Facebook fan site of an undisclosed company. They used quantitative approaches based on Heckman selection models and used control groups who have no Facebook account. They concluded that, ceteris paribus, the group that was targeted by direct marketing has a higher propensity to buy than an untreated group. They used econometrics to quantify the economic value for marketing efforts. The authors provide suggestions for future research but do not give clear indications of how to apply their findings in practice for online marketing efforts.
Page 28
2.1.1.4 Frameworks for computational analysis
Several attempts have been made to develop a framework for SM analysis (Arias, Arratia & Xuriguera 2014; Nguyen, Yan & Thai 2013; Nohuddin et al. 2012). They typically consist of a data collection and pre-processing mechanism, a data analysis engine and a visualisation and reporting frontend. Depending on the purpose of the framework, using correlation analysis (Souza et al. 2015; Siganos, Vagenas-Nanos & Verwijmeren 2014; Arias, Arratia & Xuriguera 2014; Kalampokis, Tambouris & Tarabanis 2013; Bollen, Mao & Zeng 2010) or predictive analysis (Burnap et al. 2015; Ishijima, Kazumi & Maeda 2015; Liu et al. 2014) is part of the framework. McKelvey et al. (2012) developed a framework they call Truthy, a system for collecting and analysing Twitter data of political discourses. Truthy is a system for visualizing political information diffusion on Twitter. Truthy can render statistical and visual overviews of large-scale communication networks. Truthy treats every tweet to be a meme, and categorises and visualises them as themes. Using this approach, they try to bridge the quantitative and qualitative epistemologies. They are interested in the visualisation aspect and not in opinion mining. They do not give insights into the metrics used.
Xu, Li & Song (2012) propose a framework to identify the most valuable customers to maximize the profit of an enterprise. They conducted an empirical study and used an optimization technique based on semidefinite programming. They showed how, based on online influence and authority, more targeted marketing and reputation management can be performed.
Page 29
support etc. more fully into their social capital framework from previous studies with a limited number of participants (Smith et al. 2011, p. 3) and showed how these resources can be mobilized. They conducted a proof of concept with four case studies. However, there is no single value for social capital. Also there is no economic quantification given, for example finding a job through a social network compared to finding one through a head hunter.
Chau and Xu (2012) developed a framework to analyse business intelligence on blogs. Their primary focus was to analyse the blog content and the underlying social networks. The main purpose of the framework is to shape online reputation and improve marketing efforts. As proof of concept, they provided two case studies, one on a company, Starbucks, and one on a product, the iPod. They clearly describe their research design, detailing how they do their business intelligence collection and data analysis. The case studies described step-by-step how the material was gathered and analysed. However they did not mention how the automated steps were executed or what tools they used. Also, they did not describe the concrete value of their framework to BI.
The research papers described in the section on Frameworks for computational analysis provide the starting point for the proposed study because while they had developed frameworks for a different purpose, they employed theories and techniques that have the potential for use in our study.
Table 2-2 summarizes the literature review described in section 1.5.1
Challenge Source Synopsis
Social Media mining Souza et al. (2015); Shulong et al. (2014); Liu et al. (2014); Gerber
(2014); Li et al. (2014) ; Wu
Page 30
et al. (2007) ; Klein, Tran-Gia & Hartmann (2013); Berman (2013); Mayer-Schonberger & Cukier (2013); Zafarani, Abbasi & Liu (2014); Wlodarczak, Soar & Ally (2015);
for classification problems are covered and under which conditions they are used. ML techniques have been widely applied to SM mining problems and
provided good results since they can handle the
noisiness and
heterogeneity of SM data. They identified following algorithms C4.5, k-Means, SVM, Apriori, EM,
PageRank, AdaBoost, k-NN, Naive Bayes, and CART as the top of breed. They conclude that they are “among the most influential algorithms for classification, clustering, statistical learning, association analysis and link mining” (Wu et al., 2007, p. 34).
Sentiment analysis Paltoglou & Thelwall (2012); Huang et al. (2013); Kao et al. (2013); Zeng et al. (2010); Liu (2012); Tsvetovat, Kazil & Kouznetsov (2013); Pang and Lee (2008)
Page 31
and linguistic techniques. Quantifying social media
data
Goh, Heng and Lin (2012); Mayer (2009); Manyika et al. (2011); Zhang (2013); Goh, Heng & Lin (2012); Gomez-Arias & Genin (2009); Clemons 2009
SM data has been quantified in terms of marketing efforts. The influence on decision making, trade, education and labour markets has been investigated. SM data can improve marketing efforts, especially for personalised and directed marketing campaigns. They conclude that Big Data can create significant value to the economy. They give estimates on how much money can be saved for example in the health sector if it were to use Big Data creatively. The studies conclude that determining the value is still challenging.
Frameworks for
computational analysis
McKelvey et al. (2012); Smith et al. (2011); Chau and Xu (2012)
SM analysis frameworks have been developed for analysing political
discourses, determining the social capital in online communities and to analyse Business
Intelligence in blogs. They propose to enhance the frameworks for more general purpose SM analysis.
Page 32
2.1.2 Big Data
In a broad range of application areas, data is being collected at an unprecedented scale (Jagadish et al. 2014, p. 86). The volumes of the collected data are often too large to be processed by traditional database technologies. Big Data has provided the technologies to store and analyse these large scale datasets. However, in literature there is no consensus on the definition of Big Data. Some authors use Big Data to refer to the data itself (Twinkle & Paul 2014; Berman 2013), others denote the technologies to process it (Mayer-Schonberger & Cukier 2013). Here the term Big Data is used to refer to the data analysis methods used for Big Data.
Big Data has some fundamental differences when it comes to data collection and analysis. For one, no sample selection is needed since all or almost all data can be analysed (Mayer-Schonberger & Cukier 2013), for instance all opinions on Twitter. Big Data does not necessarily mean a huge quantity of data. For instance, 100,000 records are a small quantity for a database to manage but to perform a survey among 100,000 people is an impossible task for a human with the result that not all people would be included in the survey but only a sample will be selected. This is not necessary in Big Data analysis. In this sense, Big Data means “all” or almost all data, for example, all
people who retweeted a tweet.
Secondly, in a world of small data (Berman 2011, p. 154) the sample has to be of high quality. “Since we only collected a little amount of information, we tried to make certain that the figures we bothered to record were as accurate as possible”
Page 33
but some other product, the result would not necessarily influence the outcome because of the large quantity of opinions.
Big Data is typically unstructured and messy. Unlike in a relational database, where data is organised in tables and containers, SM data is an accumulation of text, binary data such as multimedia data, or both such as text data with embedded pictures or videos. The data is unstructured and categorised by the users. For instance, tweets do not have a subject field. When a user writes a tweet, he or she usually “tags” it using the hash “#”
sign. In other words, data is being labelled. Tagging has become the de facto standard today for categorising content on the internet. There is no standardised way for tagging. Some tags might be misleading or simply wrong. Nevertheless, noisy data does not falsify the validity of the result if there is enough of it. In Big Data analysis, more trumps better. Big Data transforms figures into something more probabilistic than precise (Mayer-Schonberger & Cukier 2013, p. 35).
It is important to mention that Big Data finds correlations between data, not causes. For instance, Google publishes influenza trends based on flu related searches and medical records in a certain region (Ginsberg et al. 2009). If there are many searches it assumes there is a flu epidemic in that area. However, it does not find the cause of the epidemic. Big Data analysis finds the what, not the why. Accordingly, this study focuses on finding correlation, not causation.
Page 34
include distributed computing (Twinkle & Paul 2014), real-time analytical processing (Cheng-Zhang et al. 2014), distributed storage (Shvachko et al. 2010) and Big Data architectures (Chan 2013). Big Data technologies are a separate area of research and are beyond the scope of this thesis.
Some studies also cover the limitations of Big Data. Buhl et al. (2013) argue that there have to be novel, innovative business models to fully exploit its usefulness. Some authors also cover the anonymity issues arising with Big Data analytics (Tucker 2014; Boyd & Crawford 2012) and privacy-preserving DM has been extensively discussed in the literature to overcome this problem (Agrawal & Srikant 2000).
Manyika et al. (2011) tried to determine how Big Data could reduce costs in different industries. They concluded that Big Data can create significant value to the economy. It can enhance productivity and efficiency in the private and public sectors. They suggest estimates on how money can be saved for example in the health sector if it were to use Big Data creatively. Their study identified the areas where and how Big Data can help improve decision making, discover needs or create greater transparency. The conclusion was that Big Data will change the way business is done today and will increase the competitiveness, productivity and efficiency of companies. However they do not specify how they came up with their estimates and what methods they used to arrive at them.
2.1.2.1 Data mining (DM)
Page 35
Bulysheva & Bulyshev 2012; Kumar et al. 2012; Zeng, Li & Duan 2012; Trif 2011). These algorithms are the basic building blocks for the framework developed for our study.
Page 36
Lim, Chen & Chen (2013) analysed current Business Intelligence (BI) research in the areas of Big Data, text analytics and network analytics. They reviewed state-of-the-art techniques and algorithms and determined directions for future research. They found that a great amount of research is currently being undertaken in the areas of both descriptive and predictive models in relation to user preferences and behaviour (Lim, Chen & Chen 2013, p. 9). This paper was a starting point for several technologies and techniques for this thesis. Bulysheva & Bulyshev (2012) proposed a new segmentation algorithm for identifying data that is valuable for the business. They presented a new algorithm for data segmentation to help build time-based customer behaviour models. The proposed study will build on this and determine the economic value of such behaviour models. Zeng, Li & Duan (2012) reviewed current Business Intelligence (BI) systems with an emphasis on BI algorithms. They were critical of current BI systems that only analysed past data and did not attempt to conduct any projections.
Page 37
2.1.2.2 Predictive analysis (PA)
Early research on stock market prediction was based on random walk theory and the Efficient Market Hypothesis (EMH) (Bollen, Mao & Zeng 2010, p. 1). However, stock market prices do not follow random walks and EMH is unreliable since financial news are unpredictable. New approaches in predictive analysis (PA) of financial markets have used SM data, often using SA and ML approaches.
Twitter analysis has been used for predicting stock market development (Wei, Mao, & Wang 2015; Souza et al. 2015; Bollen, Mao & Zeng 2010), election outcomes (Burnap et al. 2015; Tsakalidis et al. 2015; Arias, Arratia & Xuriguera 2014; Tumasjan et al. 2011) and box office sales (Liu et al. 2014; Wong, Sen & Chiang 2012; Asur & Huberman 2010).
One of the first studies trying to link Twitter moods to financial indicators was a study conducted by Bollen, Mao and Zeng (2010). They attempted to analyse whether general mood on Twitter feeds could be used to predict financial indicators. They compared different SA methods to determine if the development of the mood could be used to predict the indicator. They also tested different correlation analysis methods, the Granger causality test and self-organizing, fuzzy neural networks, to determine if the closing values of the DJIA (Dow Jones Industrial Average) could be predicted. They concluded that public mood states derived from Twitter feeds can be used to predict the DJIA. “We find an accuracy of 87.6% in predicting the daily up and down changes in the
closing values of the DJIA (Dow Jones Industrial Average) and a reduction of the Mean Average Percentage Error by more than 6%” (Bollen, Mao & Zeng 2010, p. 1). They
Page 38
PA for financial indicators using SM data. PA has also been used to predict sales volumes, elections, diseases and political and humanitarian crises.
Wei, Mao and Wang (2015) investigated the relationship between Twitter volume spikes and stock options pricing. Their study found that implied volatility increases sharply before a Twitter volume spike and decreases rapidly afterwards. Also, they found that options may be overpriced after a spike of tweet volumes. Similarly, Souza et al. (2015) tried to predict whether there is statistically-significant information between the Twitter sentiment and volume, and stock returns and volatility. They concluded that measures of the Twitter sentiment extracted from listed retail brands have a statistically-significant relationship with stock returns and volatility. Using Facebook SA, Siganos, Vagenas-Nanos and Verwijmeren (2014) observed a positive relation between sentiment on Facebook and stock market returns.
Ostrowski (2011) performed a study using relational modelling and a social dimension to predict customer behaviour. The aim of the study is to support more focused customer relationships. His findings showed that among his three chosen supervised classification methods the edge-based k-means outperformed the modular matrix approach. K-means is a clustering technique used to categorize the tuples of a dataset in different groups based on the similarities (Kumar et al. 2012, p. 28). The modular matrix approach organizes data into matrices based on user defined classes. The dimension of the matrix corresponds to the number of classes. The study compared the performance of the classification methods under various scenarios but did not provide an actual application for the customer relationship management.
Page 39
Rotten Tomatoes (RT) ratings as control data. They concluded that Twitter users are generally more positive about movies than IMDb and RT users and that Twitter reviews did not necessarily translate into predictable box-office sales. This suggests that the results can differ depending on which SN is being analysed. Our proposed study will take this into account when it comes to determining the reliability of the results.
However, other studies have challenged the results and the validity of PA. Gayo-Avello (2012) challenged the capability of Twitter analysis to predict elections. He stated that SA on Twitter data could not unambiguously distinguish between political and non-political tweets. He also found that tweets can refer to different persons, even if they make use of the same name. He cited the example of Felipe Calderón, who was a candidate for the elections for the Mexican president but also a Spanish candidate, Ramón Calderón, who was running for president of Real Madrid.
As can be seen from this, many factors influence the accuracy of predictions and can, in particular, be significantly influenced by the data collection and feature extraction steps of the process.
Method Source Synopsis
Data mining Trif (2011); Kumar et al. (2012); Lim, Chen & Chen (2013); Bulysheva & Bulyshev (2012); Zeng, Li & Duan (2012)
Utilizing appropriate data mining algorithms is crucial to obtaining meaningful results. Different algorithms perform differently
depending on the data types, the volume and the velocity. Back-propagation, evolutionary and statistical algorithms have been analysed. They are used for classification,
Page 40
analysis as well as associations. Predictive analysis Bollen, Mao & Zeng (2010);
Tumasjan et al. (2011); Arias, Arratia & Xuriguera (2014); Asur & Huberman (2010); Wong, Sen & Chiang (2012); Wei, W, Mao, Y & Wang, B (2015); Souza et al. (2015)
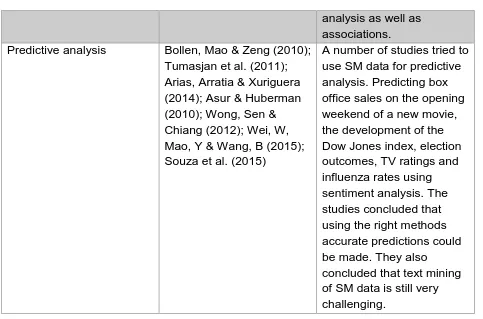
A number of studies tried to use SM data for predictive analysis. Predicting box office sales on the opening weekend of a new movie, the development of the Dow Jones index, election outcomes, TV ratings and influenza rates using sentiment analysis. The studies concluded that using the right methods accurate predictions could be made. They also
[image:49.595.64.547.83.402.2]concluded that text mining of SM data is still very challenging.
Table 2-3: Big Data literature overview
2.2 A framework for analysing Twitter data
The literature review has shown that SN are being analysed from many different perspectives. There is a large body of literature on profit maximisation through online marketing campaigns and their return on investment. There has also been increasingly innovative research on generating new business by analysing SM data. Many studies analyse the online reputation of companies or products and performed opinion and SA. The literature review also indicated that an increasing number of companies perform SM analysis, however they often struggle due to the lack of profitable business models for their organisations.
Page 41
The study complements the current literature on SMM and Big Data theories by developing a framework for tweets and evaluating different methods. It will determine which textual binary sentiment classifier produces the more accurate results for finding correlations with share price.
While there have been many studies using SM analysis to predict share price, to the best of our knowledge no study so far has correlated opinions on companies and products to the share price of the company.
2.3 Research question and issues
Based on the literature review, 2 Literature review, conducted, the following research question has emerged:
Research question: Is there a correlation between share price and public opinion on products based on Big Data analysis of tweets?
Essentially, I argue that by using predictive analysis of Twitter tweets a monetary value can be deduced. The research question is based on the following hypotheses:
Hypothesis 1: Sentiment polarity of Twitter data can be correlated to the share price history
Page 42
Hypothesis 2: A correlation between sentiment polarity and share price can be used to predict share price trends
2.4 Summary
This chapter reviewed the relevant literature and identified the gaps this thesis aims to fill. Previous studies have tried to predict financial indicators. Wei, Mao & Wang (2015) used the Black–Scholes mode and Twitter spikes to predict stock option pricing. They
concluded that implied volatility increases sharply before a Twitter volume spike and decreases quickly afterwards (Wei, Mao & Wang 2015, p. 271). They did not use opinion mining but used only tweet volumes. Ishijima, Kazumi & Maeda (2015) used word frequencies in news articles for opinion mining to predict the Japanese stock market. However, their methods using daily word frequencies did not perform as well as more sophisticated opinion mining techniques. Shulong et al. (2014) analysed public sentiment variations on Twitter. They used the Latent Dirichlet Allocation based clustering methods for opinion mining allowing them to detect reasons behind sentiment variations (Shulong et al. 2014, p. 1168). Nanli et al. (2014) used collective mood states on Sina, a Chinese version of Twitter, to predict the Chinese stock market. While they did not describe the details of their analysis they did use dictionary based methods for opinion mining. Hong Keel, Dennis & Yuan (2014) analysed tweets of S&P 500 companies for positive and negative opinions to predict daily stock market returns of these firms. Like Nanli they employed a dictionary based approach for sentiment analysis. Zheng & Xiaoqing (2013) used a Social Behaviour Graph based on human’s online behavior for sentiment analysis
Page 43
(2013) used a lexicon based approach for sentiment analysis of tweets and SVM and neural networks for predictive analysis. Evangelopoulos, Magro & Sidorova (2012) applied Latent Semantic Analysis to extract the semantic and conceptual content from tweets to make predictions on stock prices. Bollen, Mao & Zeng (2010) used a tool for opinion mining, OpinionFinder, to analyse tweets to predict the DJIA. The literature review indicated that no study applied regression based models for opinion mining. Regression models have been used for predictive analysis (Souza et al. 2015; Evangelopoulos, Magro & Sidorova 2012), but not study used LR for creating opinion time series. LR finds a single, linear decision boundary and has the advantages that:
It does not expect the independent variables to be normally distributed
It does not expect a linear relati