Differential Expression Analysis of
RNA-Sequencing
Thesis by
Lynn Yi
In Partial Fulfillment of the Requirements for
the degree of
Ph.D. in Biology
CALIFORNIA INSTITUTE OF TECHNOLOGY
Pasadena, California
2019
ã
2019
Lynn Yi
The Pachter Lab has been my work family for the past four years. Lior Pachter’s passion for scientific research and dedication to use his work for humanistic good served as a reminder for why and how science should be pursued. Members who introduced me to the Pachter Lab at Berkeley and provided wisdom throughout my PhD include Harold Pimentel, Lorian Schaeffer, Shannon McCurdy, Vasilis Ntranos, Nicolas Bray and Páll Melsted. At Caltech, it was a pleasure to work and watch the lab grow with Jase Gehring, Lisa Sledd and Valentine Svensson. My PhD committee members, David Chan, Matt Thomson and Venkat Chandrasekaran, have dedicated many hours of personal time advising me through my years at Caltech, without which I would be adrift.
Completing my PhD would not have been possible without Elizabeth Ayala and Tess Legaspi, who have taken care of not only me but also hundreds of other graduate students at Caltech. Bonnie Sturner helped me develop the mental fortitude necessary for the pursuit of this work. The Broads of Broad were sisters with whom the struggles of research could be shared openly. Knowing I could always call Amy Li, Mandy Xi, Jeff Ning and Daniel Ichwan meant I could get through the toughest of times.
PUBLISHED CONTENT AND CONTRIBUTIONS
Yi L, Pimentel H, Pachter L. Zika infection of neural progenitor cells perturbs transcription in neurodevelopmental pathways. PLoS One. 2017;12(4). doi:10.1371/journal.pone.0175744
L.Y. performed the RNA-Seq data reanalysis and participated in the writing of this manuscript.
Yi L, Pimentel H, Bray NL, Pachter L. Gene-level differential analysis at transcript-level resolution. Genome Biol. 2018;19(1):53. doi:10.1186/s13059-018-1419-z
L.Y. performed the proof-of-concept analysis for methods development, performed the simulations, and participated in the writing of this manuscript.
Ntranos V, Yi L, Melsted P, Pachter L. A discriminative learning approach to differential expression analysis for single-cell RNA-seq. Nat Methods. 2019;16(2):163-166. doi:10.1038/s41592-018-0303-9
L.Y. joined in method development, developed a single cell RNA-Seq simulation pipeline for benchmarking, and participated in the writing of this manuscript. Yi L, Liu L, Melsted P, Pachter L. A direct comparison of genome alignment and
transcriptome pseudoalignment. bioRxiv. October 2018:444620. doi:10.1101/444620
Acknowledgements ... iii
Abstract ... iv
Published Content and Contributions ... v
Funding Sources ... vi
Table of Contents ... vii
Nomenclature ... viii
Chapter I ... …………1
Chapter II ... 27
Chapter III ... 45
Chapter IV ... 81
Differential Gene Expression: gene quantifications are modeled in order to determine differential expression
Differential Transcript Expression: transcript quantifications are modeled in order to determine differential expression
Differential Transcript Usage: transcript quantifications are modeled to determine whether transcript allocation across the gene is differential
Equivalence Class (EC): the set of transcripts that a read is compatible with
Pseudoalignment: the process by which the set of transcripts a read is compatible with is determined
Transcript compatibility counts (TCCs): the counts associated with equivalence classes for a RNA-seq sample
Why study gene expression
Gene expression is the master regulator of biology. In humans, for example, most tissues share the same genome, and yet a diversity of tissues and processes can be achieved and regulated due to differential gene expression. Measuring gene expression is vital for studying tissue differentiation, attributing disease risk to gene expression, and studying the genomic landscape of diseases, drugs, or other perturbations.
Methods for Measuring Gene Expression
There exists a myriad of molecular biology techniques to measure gene expression. Reverse transcriptase quantitative polymerase chain reaction (RT-qPCR) first reverse transcribes RNA into cDNA, and then uses fluorescently-coupled polymerase-based amplification with specifically designed primers to detect the presence of a target cDNA. The number of cycles needed to produce a fluorescent signal provides a quantitative measure of cDNA concentration. qPCR is a targeted, low throughput, yet sensitive method for measuring gene expression.
oligonucleotide probes. A fluorescent or chemiluminescent signal is coupled to hybridization, allowing for readout by photodetection, usually by a specialized machine. Signal from different regions of the chip correspond to hybridization of different probes, and quantification of luminescence allows for quantification of target RNA in the sample. Popular commercial suppliers of microarray technology include Affymetrix and Illumina, i.e., Affymetrix GeneChip and Illumina BeadChip.1,2
Next Generation Sequencing
In the early 2000’s, next-generation sequencing (NGS) came into the arena. It would not be an understatement to call the advent of NGS a revolution for molecular biology. Prior to NGS, Sanger sequencing was possible at low-throughput and high cost. Sequencing the first human genome, completed in 2001 with Sanger sequencing, was estimated to have cost of up to 1 billion dollars. The concept of quantifying gene expression is changed with NGS. Compared to microarray, which specifies a set of sequences and asks whether cDNA containing these subsequences is expressed, NGS allows one to sample a pool of cDNA. Each read from NGS now corresponds to a sequenced molecule of DNA, which can literally be counted up for each gene. 3
amplification of DNA, measuring pH changes due to DNA extension in order to identify the base being added. 45
Illumina sequencing by far the most popular method for genome-wide sequencing studies. It uses clonal amplification of DNA with fluorescently labeled dNTPs. Fluorescent imaging after each round of base extension reveals the base being that has been added. Illumina is popular due to its low error rates (<1% across its sequencing platforms) with errors being primarily substitutions, as well as its speed and high throughput. In contrast to Oxford Nanopore sequencing, Illumina sequencing has a shorter maximum read length of a few hundred base pairs. 67 Library preparation for Illumina sequencing involves reverse transcribing RNA to cDNA as well as adaptor ligation of pre-specified Illumina adaptors for recognition by the sequencer. Ultimately, the choice in sequencing platform will depend on a combination of factors, including cost, throughput, read length, error rate, and speed. For the purpose of this thesis, we will be discussing computational methods for analyzing the short reads such as those produced by Illumina sequencers.
The cost per read is becoming cheaper, the time to sequence is shorter, the maximum number of base pairs that could be sequenced per experiment is growing, and empirically, the number of reads per experiment is growing exponentially. 8 The
Single cell RNA-Seq is a technique that was developed in the last decade and has been quickly growing in popularity. In bulk RNA-Seq, the lysate generated from many cells are sequenced. A bulk RNA-Seq sample of brain tissue, for example, would include sequenced mRNA from neuron, glia, and connective tissue, and gene expression could only be suggested as a mixed aggregate unless the cell types are sorted and purified prior to RNA-Seq. In contrast, single cell RNA-Seq allows one to identify the mRNA corresponding to individual cells, making a scRNA-Seq a nature method to assay gene expression of heterogeneous biological systems, such as cancer, developmental biology and differentiation, and complex tissues. scRNA-Seq is currently being used as the primary method for developing a human brain atlas, where the composition of cell types in various regions of the brain could be identified and mapped.9
There are several methods for performing scRNA-Seq, including isolating single cells into wells to be individually processed for sequencing (SMART-seq) or generating single cell suspensions using oil droplets where cell barcoding is performed prior to pooled library preparation (10x). In addition to cell barcodes, methods may also employ oligonucleotides as unique molecular identifiers (UMI) to identify sequences that are PCR amplified from the same original molecule. When choosing the specific scRNA-Seq protocol, common considerations include the desired number of cells, the sequencing
Computational Analysis of RNA-Seq
Here, we present an overview of the conventional computational pipeline for performing differential expression analysis of RNA-Seq. In the first section, we use a discussion of gene-level analysis of bulk RNA-Seq to introduce commonly-used methods for quantification and differential expression. The second section discusses the unique challenges and several solutions for analyzing bulk RNA-Seq on a transcript isoform level.
For each of the first two sections (gene level analysis and transcript level analysis), first we discuss the process for obtaining quantifications from a sequencing experiment. This involves taking a set of sequences generated from the sequencer and obtaining quantifications for genomic features, such as gene counts. In order to make conclusions about gene expression, such as whether a gene is up or downregulated between conditions, these quantifications must be modeled to in order to account for inherent variability. So, we first discuss methods for quantification and then methods for differential expression analysis.
reduction of the high dimensional data matrix, and clustering to identify cell types have been developed for scRNA-Seq uniquely.
While the primary purpose is to introduce the current statistical methods for RNA-Seq analysis, we will also discuss limitations of existing methods and, where appropriate, where the work proposed in this thesis improves upon these limitations.
RNA-Seq Analysis on the Gene Level
Alignment to Reference Genome and Quantification
In the conventional pipeline for analyzing RNA-Seq, reads are first be aligned to
Bowtie/Bowtie 2 is the classic aligner for short reads such as those produced by Illumina sequencing. It uses the Burrows-Wheeler transform, a reversible string compression algorithm, to build a space-efficient index of the genome on which subsequences (i.e. reads) could be found efficiently.
While DNA sequencing alignment could be simply formulated as an error-tolerant substring matching question, the problem of RNA-Sequencing alignment has an additional layer which is to account for splice junctions. Because of the splicing of mRNAs, a contiguous mRNA subsequence may not correspond to contiguous subsequence in the genome, and aligners for RNA-Seq analysis must specifically allow for gaps. Bowtie210 was extended from Bowtie to support gapped alignment. TopHat/TopHat211 identifies splice junctions using alignments from Bowtie. Tophat/TopHat2 was then deprecated by its authors for HISAT/HISAT212, a splice-aware aligner that provides further speed improvements through an extension of Burrows Wheeler transform to graphs. STAR13 is another splice-aware aligner, independent of the Burrows Wheeler transform, that was built using the concept of a maximal mappable prefix, and is extendable to long reads such as those produced by Oxford Nanopore.
After alignment to the genome, reads are then assigned to genes in order to determine gene expression. Methods including HTSeq14 and featureCounts15 sum up the
transcript isoforms, which are unique in sequence and could have different biological functions.
Differential expression analysis
The experimenter performing RNA-Seq often has conditions he/she is wishing to measure and compare gene expression under. For example, in Chapter 1, we analyze a dataset from an experiment where the goal was to discover genes whose expressions were affected by Zika infection. The experimenters infected human neuroprogenitor cells with the Zika virus and with a mock control and performed a differential gene expression analysis on the dataset.16 Such experimental setups for RNA-Seq are common and motivates the need for a systematic and statistically principled approach to performing genome-wide differential expression analysis.
RNA-Seq is not a deterministic process and is inherently noisy. Biologically, different handling and preparation of the sample may result in expression differences in the samples. Furthermore, there is stochasticity in gene expression, even at “steady states.”17 18Technically, the process of library preparation and sequencing, where a subsample of the biologically expressed RNA molecules are selected to be reverse transcribed, adaptor ligated, amplified and eventually sequenced, is a multi-step
model variance accurately in order to determine the statistical significance of an observed difference in gene expression between conditions.
The procedure can be outlined as follows:
1. After alignment and read counting, we arrive at a gene count or abundance matrix of dimension samples by genes. The expression matrix is first normalized to account for the differences in sequencing depth across samples. In addition to the expression table, another table of dimension samples by conditions describes the covariates for each sample. 2. A model on gene expression is fit for each gene. Two common parameterizations for RNA-Seq include a linear model on log-transformed counts and a negative binomial model on discrete counts. limma19 and sleuth20 use a linear model; edgeR21 and DESeq22/DESeq223 use the negative binomial model. The negative binomial model can be motivated as a Poisson with an additional parameter to account for overdispersion.
This model, linear or negative binomial, is fit for each gene g:
,
where covariate j does not have an effect on gene expression, i.e. Bj is excluded from model. Another option is the Wald test, which tests the null hypothesis that Bj = 0.
3. After obtaining p-values for each gene, multiple testing correction should be performed. The Benjamini-Hochberg correction to control false discovery rate is standard. Quantile-quantile plots (QQ plots) can also be used to examine whether the p-values are distributed as expected, i.e. uniform between 0 - 1 as under the null hypothesis.
One known issue of RNA-Seq differential expression is that sample sizes are often limited. With only two or three biological replicates, the sample variance is unreliable and could lead to false positives. The solution that most methods (including limma, edgeR, DESeq2, and sleuth) have adopted is to perform shrinkage on the genome-wide mean variance relationship, thereby sharing information across genes, i.e. the variances of genes with similar mean expressions are shrunk towards their mean variance. The shrinkage estimator of variance is then used for statistical testing, instead of the sample variance. sleuth is unique in that it distinguishes technical from biological variance and performs shrinkage only on the biological component of variance, while using an alternative approach to compute technical variance (discussed below).
RNA-Seq Analysis on the Transcript Level
the same genomic locus, but have different sequences due to differential splicing leading to inclusion/exclusion of different exons. A gene-level analysis fails to capture the amount of regulation that is happening through biological processes such as alternative 5’/3’UTRs, differential splicing, and up/down regulation of specific transcripts. In Chapter II, we showcase a differential transcript expression analysis of RNA-Seq of Zika infection, demonstrating that many genes have individual transcripts that are differentially expressed with opposing effect sizes. The same genes are likely to be missed in the differential gene expression analysis, which we compare to our differential transcript expression analysis.
Nonetheless, performing analysis on the transcript-level has its challenges. First, transcript quantification is not trivial. There may be many transcripts per gene that share exons and overlap in sequence. Reads that may map unambiguously to a genomic locus could correspond to multiple transcript isoforms. Furthermore, differential transcript expression comes with its own set of challenges, including the fact transcript quantifications contain greater inferential variance due to ambiguous read assignment. In this section, we address some methods that have been developed to handle the challenges of obtaining transcript quantifications and performing differential transcript expression analysis.
Transcript Quantification from Genome Alignments
sequencing is required for assigning genomic alignments to transcripts. For example, this model may assume uniform sequencing across mRNAs and uniform coverage along each mRNA, or it may consider sequencing bias (non-uniform sequences at the start and end of fragments) and positional bias (non-uniform coverage along the mRNA). An assumption about the distribution of RNA-Seq reads, even if that is of uniform, unbiased sequencing along the expressed mRNA molecule, is necessary for choosing how to distribute read alignments to transcripts. RSEM24 is a method that uses the expectation maximization algorithm to assign ambiguous counts to transcripts under a probabilistic model of counts. Cufflinks performs isoform discovery alongside isoform quantification by solving for the minimum number of isoforms required to explain the observed reads.
Pseudoalignment: An Alternative to Genome Alignment
Aligning RNA-Seq reads to the genome is computationally expensive, as the index of the reference genome must be stored in memory and algorithmically scales with the length of the reference genome and the read.25 Instead of alignment, a class of “pseudoalignment” methods were developed in as a light-weight alternative. Instead of seeking to locate the genomic site of origin of an RNA-Seq read, it looks for the set of transcripts a read may have originated from. This set of transcripts is the “equivalence
class” of the read, in that two reads are defined to be in equivalence if they are compatible with the same set of transcripts.
kmer counts are assigned to transcripts with the EM algorithm. kallisto27 also uses kmer hashing, but employs a de Brjuin graph to map each read (instead of each kmer) to an equivalence classes, thereby improving the accuracy of Sailfish while retaining the value of its simplistic approach.
There is an enormous speed-up provided by and less computational demand required for performing pseudoalignment instead of alignment, allowing RNA-Seq to be quantified in several minutes on a personal laptop instead of several hours on a dedicated server. In Chapter V, we show that the quantification accuracy of pseudoalignment methods is comparable to that of alignment methods.
Transcript Compatibility Counts (TCCs)
While originally an intermediate product of pseudoalignment alignment methods generated prior to read assignment, transcript compatibility counts (“TCCs”), the counts associated with each equivalence class, have been explored as a useful data matrix of its own. TCCs are free of any inferential variance and constitute summary statistics for RNA-Seq quantification. In the differential expression method sleuth (further discussed below in “Differential transcript expression analysis”), TCCs allow for efficient bootstrap estimation of inferential variance that would otherwise be computationally infeasible. In
Differential transcript expression analysis
After transcript quantification, a differential transcript expression analysis (“DTE”) is performed to investigate which transcripts have statistically different abundances across conditions. Traditionally, transcript quantifications are used as input to differential expression methods used for differential gene expression (“DGE”), and there has been little thought in modeling DTE differently from DGE.
However, there are substantial differences between performing DGE and performing DTE that have substantial statistical implications. Given that eukaryotes often have more transcripts than genes (~170,000 transcripts compared to 30,000 genes in human genome), there is a greater burden to pass multiple testing correction when performing DTE. Furthermore, because transcript quantification compared to gene quantification involves more specific read assignment to transcripts with some overlap in sequence, there is greater inferential variance. The number of transcripts in a gene and the extent of shared sequence across transcripts, for instance, have a large effect on the quantification certainty of transcripts within a gene, and would be difficult to determine a priori for each gene.
Cuffdiff229 performs differential expression of transcripts by modeling transcript counts with a beta negative binomial distribution. The beta distribution is used to capture
sleuth30 uses another strategy for calculating inferential variance. Instead of parametric modeling, sleuth performs bootstrapping to estimate inferential variance resulting from ambiguous read assignment. sleuth then performs shrinkage on the variance component that is not captured by the estimated inferential variance. What would otherwise be a computationally infeasible task of bootstrapping, aligning and quantifying millions of RNA-Seq reads was made feasible by leveraging the concept of TCCs developed by kallisto. Bootstrapping TCCs is equivalent to bootstrapping reads, and quantification of bootstrapped TCCs with the EM algorithm is fast and requires no additional alignment on the bootstrapped samples. In simulations, sleuth has much more conservative and accurate false discovery rates compared to other differential expression methods, suggesting that accurate estimation of inferential variance is an important component of differential transcript expression.
Differential Expression for Single Cell RNA-Seq
Single cell RNA-Seq (scRNA-Seq) represents a new frontier in experimental and computational methods. On the analysis side, although naively it could be thought of as an extension of bulk RNA-Seq with more samples via more cells, closer examination
reveals unique challenges associated with scRNA-Seq.
usually deeply sequenced, scRNA-Seq datasets often have many cells that are usually shallowly sequenced. Furthermore, due to the lower amounts of starting RNA in single cells, scRNA-Seq is thought of as a “noisier” experiment compared to bulk RNA-Seq. For example, a gene may have no mapped reads in a subset cells of a cell type that are known to express that gene, a concept referred to as “dropout.”
Single cell methods commonly model dropout in order to perform differential expression. Instead of a negative binomial distribution on counts, many methods use a zero-inflated negative binomial to better model the additional zero expression values. In SCDE32, a Bayesian approach is used to fit an error model to each cell in order to model per-cell in addition to per-gene probability of dropout. In MAST33, each cell is now parameterized by its detection rate, the proportion of genes that are expressed in the cell. In Monocle34, instead of the negative binomial, a Tobit model is used to account for zero-inflation. However, whether dropout exists as an independent phenomenon from merely shallow sequencing is disputed.35
While the measurement of a specific gene in a specific cell may be unreliable, the dataset provides information in aggregate. For example, common scRNA-Seq pipelines perform smoothing and dimensionality reduction36, identify distinct cell types through unsupervised clustering, and then perform differential expression between clusters to
Outline of Chapters
This thesis discusses novel methods we developed in order to perform RNA-Seq gene differential expression, which unifies differential gene expression and differential transcript expression. By using transcript quantifications, our methods are sensitive to transcript-level differential events, while being able to summarize our statistical results to the gene-level. However, not only is our method more sensitive and accurate for
detecting differential transcript expression, it can also detect differential gene expression. We present two methods for performing gene differential expression: one for bulk RNA-Seq and one for scRNA-RNA-Seq. Furthermore, we show that in both methods, we can use transcript compatibility counts (TCCs) instead of transcript counts, from which we can obtain even more accurate results from reducing inferential variance due to ambiguous read assignment to isoforms.
Chapter II is a case-study that compares a gene-level analysis with a transcript-level analysis, showcasing that there are many isoform-transcript-level events that are missed when RNA-Seq quantifications are summarized to the gene level. It motivates the significance of detecting differential transcript-level events in biological systems.
perform differential transcript expression and then obtain gene-level results that are statistically unified and coherent. We show that performing differential expression on TCCs instead of transcript counts and aggregating to the gene-level increases accuracy.
Chapter IV discusses a differential expression method for single cell RNA-Seq. It leverages the large number of cells sequenced in RNA-Seq in a higher dimensional model corresponding to the dimension of the number of transcript isoforms. While it is a distinct method from the method discussed in Chapter III for bulk RNA-Seq, it conceptually achieves the same results: gene-level results that are consistent with the transcript-level results and that is sensitive to transcript-level events. We again show that using TCCs instead of transcript counts with this approach can lead to more accurate results. Furthermore, in this chapter’s supplement, we present a more formal argument for how our method unifies differential gene expression (“DGE”) and differential transcript expression (“DTE”) into a common test.
Chapter V discusses a comparison of pseudoalignment and alignment. It demonstrates that the two suites of methods are comparable in accuracy in their transcript and gene quantifications. Furthermore, we discuss the new tools we developed new tools to convert between the quantifications produced by the two approaches, i.e. producing TCCs from genome alignments and producing alignment-like visualization
References
1 Bumgarner R. Overview of DNA microarrays: types, applications, and their future. Curr Protoc Mol Biol. 2013;Chapter 22:Unit 22.1. doi:10.1002/0471142727.mb2201s101 2 Pirrung MC, Southern EM. The genesis of microarrays. Biochem Mol Biol Educ.
2014;42(2):106-113. doi:10.1002/bmb.20756
3 Reuter JA, Spacek D V, Snyder MP. High-throughput sequencing technologies. Mol Cell. 2015;58(4):586-597. doi:10.1016/j.molcel.2015.05.004
4 Reuter JA, Spacek D V, Snyder MP. High-throughput sequencing technologies. Mol Cell. 2015;58(4):586-597. doi:10.1016/j.molcel.2015.05.004
5 Ambardar S, Gupta R, Trakroo D, Lal R, Vakhlu J. High Throughput Sequencing: An Overview of Sequencing Chemistry. Indian J Microbiol. 2016;56(4):394-404.
doi:10.1007/s12088-016-0606-4
6 Reuter JA, Spacek D V, Snyder MP. High-throughput sequencing technologies. Mol Cell. 2015;58(4):586-597. doi:10.1016/j.molcel.2015.05.004
7 Ambardar S, Gupta R, Trakroo D, Lal R, Vakhlu J. High Throughput Sequencing: An Overview of Sequencing Chemistry. Indian J Microbiol. 2016;56(4):394-404.
doi:10.1007/s12088-016-0606-4
8 NIH NHGRI. DNA Sequencing Costs: Data - National Human Genome Research Institute (NHGRI). https://www.genome.gov/27541954/dna-sequencing-costs-data/. Accessed March 31, 2019.
9 Ecker JR, Geschwind DH, Kriegstein AR, et al. The BRAIN Initiative Cell Census Consortium: Lessons Learned toward Generating a Comprehensive Brain Cell Atlas. Neuron. 2017;96(3):542-557. doi:10.1016/j.neuron.2017.10.007
10 Langmead B, Salzberg SL. Fast gapped-read alignment with Bowtie 2. Nat Methods. 2012;9(4):357-359. doi:10.1038/nmeth.1923
12 Trapnell C, Williams BA, Pertea G, et al. Transcript assembly and quantification by RNA-Seq reveals unannotated transcripts and isoform switching during cell
differentiation. Nat Biotechnol. 2010;28(5):511-515. doi:10.1038/nbt.1621
13 Dobin A, Davis CA, Schlesinger F, et al. STAR: ultrafast universal RNA-seq aligner. Bioinformatics. 2013;29(1):15-21. doi:10.1093/bioinformatics/bts635
14 Anders S, Pyl PT, Huber W. HTSeq--a Python framework to work with high-throughput sequencing data. Bioinformatics. 2015;31(2):166-169.
doi:10.1093/bioinformatics/btu638
15 Liao Y, Smyth GK, Shi W. Sequence analysis featureCounts: an efficient general purpose program for assigning sequence reads to genomic features. 2014;30(7):923-930. doi:10.1093/bioinformatics/btt656
16 Tang H, Hammack C, Ogden SC, et al. Zika Virus Infects Human Cortical Neural Progenitors and Attenuates Their Growth. Cell Stem Cell. 2016;18(5):587-590. doi:10.1016/j.stem.2016.02.016
17 Elowitz MB, Levine AJ, Siggia ED, Swain PS. Stochastic gene expression in a single cell. Science. 2002;297(5584):1183-1186. doi:10.1126/science.1070919
18 Singer ZS, Yong J, Tischler J, et al. Dynamic heterogeneity and DNA methylation in embryonic stem cells. Mol Cell. 2014;55(2):319-331. doi:10.1016/j.molcel.2014.06.029
19 Law CW, Chen Y, Shi W, Smyth GK. voom: precision weights unlock linear model analysis tools for RNA-seq read counts. Genome Biol. 2014;15(2):R29. doi:10.1186/gb-2014-15-2-r29
20 Pimentel H, Bray NL, Puente S, Melsted P, Pachter L. Differential analysis of RNA-seq incorporating quantification uncertainty. Nat Methods. 2017;14(7):687-690. doi:10.1038/nmeth.4324
21 Robinson MD, McCarthy DJ, Smyth GK. edgeR: a Bioconductor package for differential expression analysis of digital gene expression data. Bioinformatics. 2010;26(1):139-140. doi:10.1093/bioinformatics/btp616
22 Anders S, Huber W, Nagalakshmi U, et al. Differential expression analysis for
23 Love MI, Huber W, Anders S. Moderated estimation of fold change and dispersion for RNA-seq data with DESeq2. Genome Biol. 2014;15(12):550. doi:10.1186/s13059-014-0550-8
24 Li B, Dewey CN. RSEM: accurate transcript quantification from RNA-Seq data with or without a reference genome. BMC Bioinformatics. 2011;12:323. doi:10.1186/1471-2105-12-323
25 Needleman SB, Wunsch CD. A general method applicable to the search for
similarities in the amino acid sequence of two proteins. J Mol Biol. 1970;48(3):443-453. doi:10.1016/0022-2836(70)90057-4
26 Patro R, Mount SM, Kingsford C. Sailfish enables alignment-free isoform quantification from RNA-seq reads using lightweight algorithms. Nat Biotechnol. 2014;32(5):462-464. doi:10.1038/nbt.2862
27 Bray NL, Pimentel H, Melsted P, Pachter L. Near-optimal probabilistic RNA-Seq quantification. Nat Biotechnol. 2016;34(5):525-527. doi:10.1038/nbt.3519
28 Ntranos V, Kamath GM, Zhang JM, Pachter L, Tse DN. Fast and accurate single-cell RNA-seq analysis by clustering of transcript-compatibility counts. Genome Biol.
2016;17(1):112. doi:10.1186/s13059-016-0970-8
29 Trapnell C, Hendrickson DG, Sauvageau M, Goff L, Rinn JL, Pachter L. Differential analysis of gene regulation at transcript resolution with RNA-seq. Nat Biotechnol. 2013;31(1):46-53. doi:10.1038/nbt.2450
30 Pimentel H, Bray NL, Puente S, Melsted P, Pachter L. Differential analysis of RNA-seq incorporating quantification uncertainty. Nat Methods. 2017;14(7):687-690. doi:10.1038/nmeth.4324
31 Svensson V, Vento-Tormo R, Teichmann SA. Exponential scaling of single-cell RNA-seq in the past decade. Nat Protoc. 2018;13(4):599-604. doi:10.10
32 Kharchenko P V, Silberstein L, Scadden DT. Bayesian approach to single-cell differential expression analysis. Nat Methods. 2014;11(7):740-742.
doi:10.1038/nmeth.2967
34 Trapnell C, Cacchiarelli D, Grimsby J, et al. The dynamics and regulators of cell fate decisions are revealed by pseudotemporal ordering of single cells. Nat Biotechnol. 2014;32(4):381-386. doi:10.1038/nbt.2859
35 Svensson V. Droplet scRNA-seq is not zero-inflated. bioRxiv. March 2019:582064. doi:10.1101/582064
36 Moon KR, Van Dijk D, Wang Z, et al. PHATE: A Dimensionality Reduction Method for Visualizing Trajectory Structures in High-Dimensional Biological Data.
doi:10.1101/120378
37 Butler A, Hoffman P, Smibert P, Papalexi E, Satija R. Integrating single-cell
transcriptomic data across different conditions, technologies, and species. Nat Biotechnol. April 2018. doi:10.1038/nbt.4096
Chapter II
Zika infection of neural progenitor cells
perturbs transcription in
neurodevelopmental pathways
Lynn Yi
1,2, Harold Pimentel
3and Lior Pachter
1,41. Division of Biology and Biological Engineering, California Institute of Technology, Pasadena, CA, USA
2. David Geffen School of Medicine, University of California, Los Angeles, CA, USA
3. Department of Genetics, Stanford University, Palo Alto, CA, USA
4. Computing and Mathematical Sciences, California Institute of Technology, Pasadena, CA, USA
Abstract
Background
A recent study of the gene expression patterns of Zika virus (ZIKV) infected human
neural progenitor cells (hNPCs) revealed transcriptional dysregulation and identified cell
cycle-related pathways that are affected by infection. However, deeper exploration of the
information present in the RNA-Seq data can be used to further elucidate the manner in
which Zika infection of hNPCs affects the transcriptome, refining pathway predictions
and revealing isoform-specific dynamics.
Methodology/Principal Findings
We analyzed data published by Tang et al. using state-of-the-art tools for transcriptome
analysis. By accounting for the experimental design and estimation of technical and
inferential variance we were able to pinpoint Zika infection affected pathways that
highlight Zika’s neural tropism. The examination of differential genes reveals cases of
isoform divergence.
Conclusions
Transcriptome analysis of Zika infected hNPCs has the potential to identify the molecular
signatures of Zika infected neural cells. These signatures may be useful for diagnostics
and for the resolution of infection pathways that can be used to harvest specific targets
Introduction
As infection with Zika virus (ZIKV) is associated with increasing cases of
congenital microcephaly and adult Guillain-Barre Syndrome, a characterization of its
pathophysiology becomes crucial. A characterization of the molecular effects of infection
may help in the development of fetal diagnostics and can accelerate the identification of
genes and pathways critical in disease progression. RNA-Sequencing (RNA-Seq) is an
effective technology for probing the transcriptome and has been applied to study the
effects of ZIKV infection of human neuroprogenitor cells (hNPCs) [1].
While initial analyses of the data conducted a general survey of transcriptome
changes upon infection [1-3], they [1,2] used a method, Cufflinks/Cuffdiff [4], that failed
to take advantage of the experimental design used in Tang et. al [1]. They [1-3] also did
not examine transcriptome dynamics at the isoform level.
We applied the recently-developed kallisto [5] and sleuth [6] programs to
improve the accuracy of quantification and to extract information from the data that was
previously inaccessible. We found that sleuth’s improved control of false discovery rate
[6] resulted in differential transcript and gene lists that are much more specific and that
are significantly enriched in neurodevelopmental pathways. They reveal ZIKV’s neural
tropism and the host’s response to viral infection. Furthermore, we demonstrate that the
combination of accurate kallisto quantification, assessment of inferential variance and the
sleuth response error model allows for the detection of post infection isoform-specific
The sleuth Shiny app drives a freely available website that allows for
reproducibility of our analyses, and provides tools for interacting with the data. This
makes the dataset useful for analysis by infectious disease experts who may not have
bioinformatics expertise.
Methods
We ran kallisto and sleuth on a total of eight RNA-seq samples of ZIKV-infected
and mock-infected hNPCs (GEO: Series GSE78711) (See Table 1 for experimental design
and description of samples). We used kallisto to pseudoalign the RNA-seq reads and
perform bootstraps, using an index based on the ENSEMBL GRC38 Homo sapiens release
85 transcriptome. For single-end read quantification, we used default parameters (kmer
size = 31, fragment length = 187 and sd = 70). For each of the eight samples, kallisto
quantified transcript abundances and performed 100 bootstraps.
The response error model of sleuth was then used to identify differentially
expressed transcripts. Sleuth used the bootstraps performed by kallisto to estimate the
inferential variance of each transcript, and an adjusted variance was used to determine
differential expression for that transcript. This data set had a unique experimental design,
however. For each sequencing library corresponding to a biological sample, Tang et al.
performed both paired-end and single-end sequencing. To take advantage of the technical
replicates performed by Tang et al., we modified sleuth to perform a weighted average of
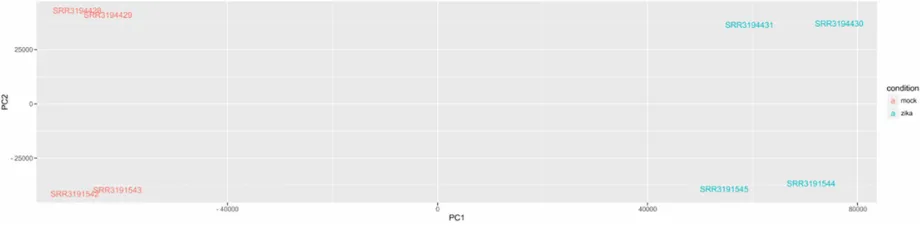
Principle component analysis of the transcript abundances provided a quick
verification of the accuracy of our methods, as the first principle component separated
the samples by infection status and the second principle component separated the
samples by sequencing method (Fig. 1).
The data analysis pipeline was performed on a laptop and can be repeated using
the provided scripts at http://www.github.com/pachterlab/zika/. The kallisto
quantifications, the modified version of sleuth, as well as a script for the pipeline, are
available on the github. One can use the script to start the Shiny app, which recreates the
statistics and figures referenced throughout this paper, along with interactive data
visualization tools. Alternatively, the preloaded sleuth Shiny app can be found via
http://128.32.142.223/tang16/.
Results
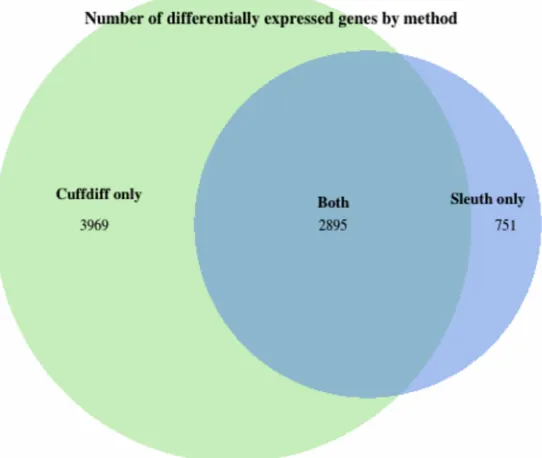
Using a false discovery rate of 0.05 as the threshold for differential expression, we
detected 4610 transcripts across 3646 genes that are differentially expressed between
ZIKV-and mock-infected samples. (Fig. 2, S1 and S2 Tables) For the 3969 genes that
Cuffdiff found differentially expressed but sleuth did not, sleuth reported an average false
discovery rate of 0.55.
It was not surprising that the many differentially expressed genes discovered by
Cuffdiff were considered false positives by sleuth. In simulations by Pimentel et al [6],
DESeq2, edgeR, and Cuffdiff2 underestimated their false discovery rates. In other words,
these methods provided differential gene lists that had many more false positives than
what was suggested by their p-values. The fundamental idea underlying sleuth is that, by
using bootstraps to estimate inferential variance, it does not assume a parametric
distribution to account for uncertainty in isoform mapping.
Furthermore, we found a few hundred genes with differentially expressed
transcripts not identified by Cuffdiff. We ascribe these to the accounting of experimental
design and the isoform-level analysis.
Zika induced isoform divergence
Differentially regulated genes may be missed in gene-level analysis for several
reasons. Noise in the measurement of highly expressed transcripts can mask expression
changes in lowly expressed transcripts. In the case of isoform switching, upregulation in
one isoform and downregulation in another may “cancel out.” We identified 108 genes
that contain transcript(s) that are significantly upregulated and other transcript(s) that
are significantly downregulated, a phenomenon we coin “isoform divergence” (S3 Table).
Of these 108 isoform diverging genes, 57 were not considered differentially expressed by
Cuffdiff analysis.
We performed a pathway analysis on the 108 genes using Reactome [7].
Enrichment was identified in neuronal system (specifically transmission across chemical
synapses and protein-protein interactions at the synapses), developmental biology
enzymes, gene expression (rRNA and transcriptional regulation), metabolism, signal
transduction, transmembrane transport and vesicle-mediated transport.
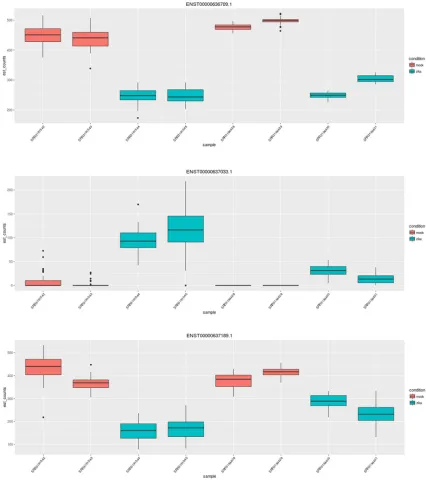
One of these 57 isoform diverging genes not picked up by Cufflink is NRCAM,
neuronal cell adhesion molecule, which is putatively involved in neuron-neuron adhesion
and axonal cone growth. Another is CHRNA7, cholinergic receptor nicotinic alpha 7
subunit. [8] Fig. 3 shows transcript abundances in NRCAM and CHRNA7 across
different samples, highlighting isoform-specific changes.
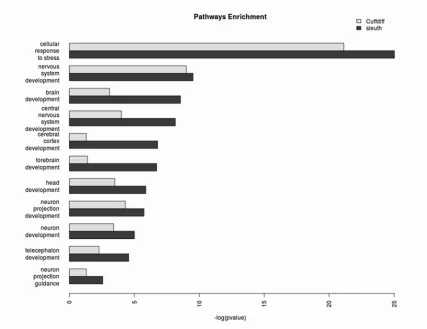
A gene ontology (GO) analysis of sleuth-discovered genes showcase neural and
head development networks
We performed a side-by-side gene ontology (GO) analysis with the differential
genes identified by sleuth and Cuffdiff, using ClueGO [9, 10] over the Biological
Processes ontology network, using GO Term Fusion. We set the network specificity to
global (GO tree interval: 1-4), using pathways with a minimum of 50 genes and kappa
score of 0.5. We highlighted enriched nodes of particular interest and their enrichments
in Fig. 5. Provided in the supplementary materials are the side-by-side GO analysis results
Discussion
RNA-Seq can provide rapid and high resolution probing of infection response, and
initial studies of Zika infection highlight isoforms, genes and pathways that may play an
important role in disease etiology. However, the simplicity of RNA-Seq library prep and
cDNA sequencing belies the complexity of analysis. We have shown that a careful
analysis of previously published data can reveal novel targets with higher confidence, and
in the process rendering a valuable dataset usable by the community of Zika researchers.
The kallisto and sleuth tools we have used in our analysis are particularly powerful
when coupled with the interactive sleuth Shiny application, and our publicly available
server provides access to numerous interactive plots and figures that cannot be
reproduced in a static publication. This highlights the utility and importance of data
sharing [11], and we hope that our analysis, aside from its usefulness for the Zika
scientific community, can also serve as a blueprint for future data sharing efforts.
sleuth is a fast and accurate pipeline for analyzing RNA-Seq data that allows for
testing at the isoform level. The alignment and quantification pipeline is feasible and
compatible with a standard desktop computer. The interactive Sleuth application, made
publically available, allows for informative data visualization, including those of library
prep fragment size distributions, principle component analysis, and gene and transcript
expression changes. We invite the scientific community studying Zika to utilize this
Figures
Sample Accession Number Condition Sequencing method Sequencing machine Reads
No.
Fragments / weights Mock1-1 SRR3191542 mock paired-end MiSeq 15855554 7927777 Mock2-1 SRR3191543 mock paired-end MiSeq 14782152 7391076 ZIKV1-1 SRR3191544 zika paired-end MiSeq 14723054 7361527 ZIKV2-1 SRR3191545 zika paired-end MiSeq 15242694 7621347 Mock1-2 SRR3194428 mock single-end NextSeq 72983243 72983243 Mock2-2 SRR3194429 mock single-end NextSeq 94729809 94729809 ZIKV1-2 SRR3194430 zika single-end NextSeq 71055823 71055823 ZIKV2-2 SRR3194431 zika single-end NextSeq 66528035 66528035
Table 1. Experimental design. Tang et al. infected two samples with ZIKV and two
with a mock infection. Library preparation was performed for each sample to make four
cDNA libraries. Each library was then sequenced with MiSeq using paired-end reads
Figure 1: Principle component analysis. PCA of the eight samples shows that the
primary contributor to variance is ZIKV infection status (ZIKV vs mock), while the
[image:45.612.111.571.104.218.2]Figure 2: Venn diagram of differential expression analysis. Sleuth identified 3646
differentially expressed genes. Cuffdiff identified 6864 differentially expressed genes.
2895 of the 3646 differentially expressed genes were also reported in Tang et. al [1], but
they reported an additional 3969 genes that we failed to identify. Furthermore, we found
751 differentially expressed genes corresponding to 5426 transcripts not detected by
Figure 3: NRCAM is an example of an isoform divergent gene involved in
neuron-neuron adhesion. For a specific gene, the sleuth Shiny app plots the counts
corresponding to each transcript and sample. Visualized here are counts for four
Figure 4: The counts of CHRNA7, another isoform diverging gene, plotted by the
sleuth Shiny app. Visualized here are counts for three transcripts of CHRNA7 across
Figure 5: GO pathways enrichment. The enriched nodes of particular interest include
neuron projection guidance (p-value = 2.7E-3 vs >0.05 with Cuffdiff), cerebral cortex
development (1.6E-7 vs >0.05), neuron development (9.9E-6 vs 3.9E-4), neuron
projection development (1.8E-6 vs 5.0E-5), nervous system development (3.0E-10 vs
1.0E-9), central nervous system development (6.9E-9 vs 1.0E-4), brain development
(2.8E-9 vs 8.0E-4), forebrain development (1.9E-7 vs 4.1E-2), telecephalon development
(2.7E-5 vs 5.2E-3), head development (1.3E-6 vs 3.2E-4), and cellular response to stress
References
[1] Tang H, Hammack C, Ogden SC, Wen Z, Qian X, Li Y, et al. Zika Virus Infects Human Cortial Neuro Progenitors and Attenuate Their Growth. Cell Stem Cell. 2016 May 5;18(5): 587-90.
[2] Rolfe AJ, Bosco DB, Wang J, Nowakowski RS, Fan J, Ren. Bioinformatic analysis reveals the expression of unique transcriptomic signatures in Zika virus infected human neural stem cells. Cell Biosci. 2016;6:42, doi: 10.1186/s13578-016-0110-x.
[3] Wang Z, Ma’ayan A. An open RNA-seq data analysis pipeline tutorial with an example of reprocessing data from a recent Zika virus study. F1000Research. 2016;5: 1574, doi:10.5256/f1000research.9804.r14924.
[4] C. Trapnell, A. Roberts, L. Goff, G. Pertea, D. Kim, D.R. Kelley, et al. Differential gene and transcript expression analysis of RNA-seq experiments with TopHat and Cufflinks, Nature Protocols. 2012;7: 562-578.
[5] Bray NL, Pimentel H, Melsted P, Pachter L. Near-optimal probabilistic RNA-seq quantification. Nature Biotechnology. 2016; 34:525-527, doi:10.1038/nbt.3519.
[6] Pimentel HJ, Bray N, Puente S, Melsted P, Pachter L. Differential analysis of RNA-Seq incorporating quantification uncertainty.
bioRxiv 058164, doi: http://dx.doi.org/10.1101/058164.
[7] Croft D, Mundo AF, Haw R, Milacic M, Weiser J, Wu G, et al. The Reactome pathway knowledgebase. Nucleic Acids Res. 2014 Jan;42 (Database issue):D472-7, doi: 10.1093/nar/gkt1102.
[8] Stelzer G, Rosen R, Plaschkes I, Lieder I, Zimmerman S, Twik M, et al. The
GeneCards Suite: From Gene Data Mining to Disease Genome Sequence Analysis. Curr. Protoc. Bioinform. 2016; 54:1.30.1-1.30.33. doi: 10.1002/cpbi.5.
[9] Bindea G, Mlecnik B, Hackl H, Charoentong P, Tosolini M, et al. ClueGO: a Cytoscape plug-in to decipher functionally grouped gene ontology and pathway annotation networks. Bioinformatics. 2009, 25(8):1091-3.
Chapter III
Gene-level differential analysis at
transcript-level resolution
Lynn Yi
1,2, Harold Pimentel
3, Nicolas L. Bray
4and Lior Pachter
2,51. UCLA-Caltech Medical Science Training Program, Los Angeles, CA, USA 2. Division of Biology and Biological Engineering, Caltech, Pasadena, CA, USA 3. Department of Genetics, Stanford University, Palo Alto, CA, USA
4. Innovative Genomics Institute, Berkeley, Berkeley, CA, USA
5. Department of Computing and Mathematical Sciences, Caltech, Pasadena, CA, USA
Abstract
Compared to RNA-Seq transcript differential analysis, gene-level
differential expression analysis is more robust and experimentally actionable.
However, the use of gene counts for statistical analysis can mask transcript-level
dynamics. We demonstrate that ‘
analysis first, aggregation second,
’ where the
p-values derived from transcript analysis are aggregated to obtain gene-level results,
increase sensitivity and accuracy. The method we propose can also be applied to
transcript compatibility counts obtained from pseudoalignment of reads, which
circumvents the need for quantification, and is fast, accurate, and model-free. The
method generalizes to various levels of biology, and we showcase an application
to gene ontologies.
Keywords
RNA-Seq, differential expression, metaanalysis,
p
-value aggregation, Lancaster
method, Fisher’s method,
Š
idák correction, RNA-Seq quantification, RNA-Seq
Background
Direct analysis of RNA abundance by sequencing cDNAs using RNA-Sequencing (RNA-Seq) offers the possibility to analyze expression at the resolution of individual transcripts (Wang et al. 2009). Nevertheless, RNA-Seq continues to be mostly studied at the gene-level, partly because such analyses appear to be more robust (Soneson et al.
2016), and also because gene-level discoveries are more experimentally actionable than transcript-level discoveries due to the difficulty of knocking down single isoforms (Kisielow et al. 2002).
Gene-level RNA-Seq differential analysis is, at first glance, similar to transcript-level analysis, with the caveat that transcript counts are first summed to obtain gene counts (Anders and Huber 2010, Anders et al. 2015). However, despite such superficial simplicity, there is considerable complexity involved in transitioning from transcripts to genes. In (Trapnell et al. 2013), it was shown that naïve approach of summing transcript counts to gene counts lead to inaccurate estimates of fold-change between conditions when transcripts have different lengths. Because transcript counts are proportional to transcript lengths, summing transcript counts is not equivalent to summing transcript abundances.
differential analysis rely on converting gene abundance estimates to gene counts (Soneson et al. 2016, Pimentel et al. 2017). Such methods have two major drawbacks. First, even though the resulting gene counts can be used to accurately estimate fold changes, the associated variance estimates can be distorted (see Figure 1 and Additional file 1: Section 1). Second, the assignment of a single numerical value to a gene can mask dynamic effects among its multiple constituent transcripts (Figure 2). In the case of “cancellation” (Figure 2a), the abundance of transcripts changing in opposite directions cancels out upon conversion to gene abundance. In “domination” (Figure 2b), an abundant transcript that is not changing can mask substantial change in abundance of a minor transcript. Finally, in the case of “collapsing” (Figure 2c), due to overdispersion in variance, multiple isoforms of a gene with small effect sizes in the same direction do not lead to a significant change when observed in aggregate, but their independent changes constitute substantial evidence for differential expression. As shown in Figure 2, these scenarios are not only hypothetical scenarios in a thought experiment, but events that occur in biological data.
Rather than aggregating quantifications prior to differential analysis, one approach is to first perform a transcript-level differential analysis followed by a gene-level meta-analysis. Such a method is implemented in the DEXSeq program (Anders et al.
studies to aggregate single nucleotide polymorphism p-values to make gene-level (Chen
et al., 2014. Dai et al., 2011., Lamparter et al., 2016) and pathway-level inferences (Li et al.,
2011, Lamparter et al., 2016), but such approaches do not appear to have been extensively explored for RNA-Seq.
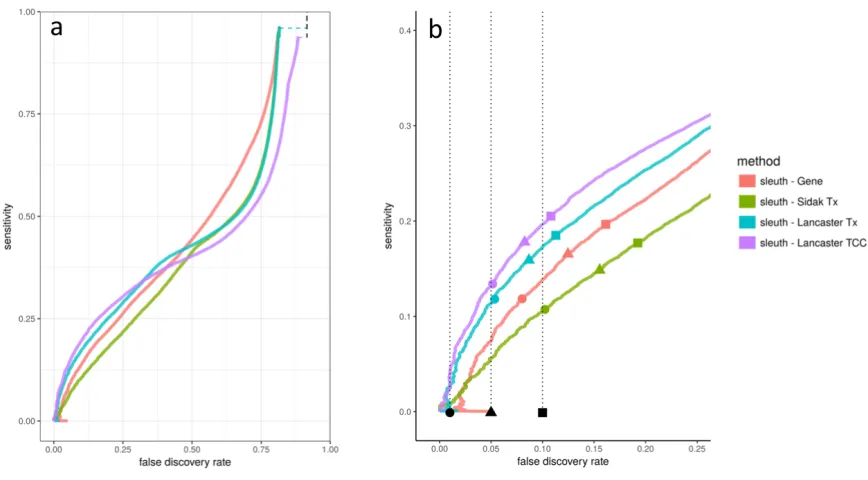
We present a new framework for gene-level differential analysis that utilizes the Lancaster method (Lancaster, 1961). In this framework, differential expression is performed on transcripts as usual, but then transcript-level p-values are aggregated to obtain gene-level p-values. (See Methods for details about the Lancaster method. See Additional file 1 for applicability of the Lancaster method to RNA-Seq.)
Our approach can be based on p-values derived from transcript-level differential analysis, but can also be applied to p-values derived from comparisons of transcript compatibility counts (TCCs), a concept introduced by the pseudoalignment method in kallisto (Bray et al., 2016). Transcript compatibility counts are the number of reads that are compatible with a set of transcripts, i.e. an equivalence class. In default RNA-Seq quantification mode, kallisto matches each read with its equivalence class, thus generating TCCs, and then applies the expectation-maximization (EM) algorithm on TCCs to obtain transcript quantifications. Differential analysis performed on directly TCCs has the advantage of being fast and model-free, and we show that it is particularly useful for positionally biased RNA-Seq data.
identifies GO terms in which there is significant perturbation among the associated genes. We combine this idea with TCC-based differential analysis to illustrate how GO analysis can be performed on RNA-Seq data without transcript quantification.
Results
We first examined the performance of aggregation in comparison to standard gene-level differential expression methods using three simulated scenarios from (Pimentel et al. 2017). In these simulations, transcripts are perturbed independently, in a correlated fashion with other transcripts of the gene, or according to effect sizes observed in a biological experiment. In the first scenario of independent effects, random transcripts in the transcriptome are independently chosen to be perturbed, and the effect size for each transcript is chosen independently. In the second scenario of correlated effects, genes are independently chosen to be differentially expressed, and all transcripts of the same gene are perturbed in the same direction. In the third scenario of experimentally based effects, effect sizes are learned from an experimental data set and applied to the simulation. (See Methods for more details.) Each of the three scenarios was simulated twenty times.
is then used in a linear model to perform differential expression analysis. DESeq2 utilizes a negative binomial model on counts (Love et al. 2014). We evaluated every aggregation method using each differential expression method in each of the three simulation scenarios.
outperforms the other methods, showing that improvements in performance are due to the aggregation method and not the differential expression software.
Transcript-level p-values are computed from transcript quantifications, a process that introduces uncertainty from multiple-mapping RNA-Seq reads. (Pimentel et al, 2017) showed that propagating uncertainty from the transcript quantification to differential expression analysis increases accuracy of the differential expression analysis. In kallisto (Bray et al. 2016), pseudoalignment was performed to generate transcript compatibility counts (TCCs), which are the number of reads that are compatible with sets of transcripts and therefore do not contain any quantification uncertainty. Given the improved results observed with performing Lancaster aggregation, we asked whether it is possible to perform differential expression analysis directly on TCCs and aggregate on TCC p-values to obtain gene p-values, thereby bypassing transcript quantification and the uncertainty it entails altogether. Figure 3 shows that aggregating TCC p-values outperforms other methods, including that of aggregating transcript p-values. Furthermore, aggregating TCC p-values reported FDRs that are as or more accurate than those reported by other methods. In this instance, we used only TCCs that mapped solely to the transcripts of a single gene, which accounts for 88% of the RNA-Seq reads. It may be possible to continue to improve performance by accounting for intergenic TCCs.
expression on QuantSeq data (Moll et al., 2014), where an experiment involved mechanically stretching rat primary type I like alveolar epithelial cells and then performing QuantSeq 3’ mRNA sequencing to detect changes in 3’ untranslated region (UTR) expression (Dolinay et al., 2017, GEO Series GSE89024). Figure 4a shows that overall results with TCC-based aggregation are similar to standard analysis based on gene counts obtained by summing the number of reads that map to any constituent isoforms. However, TCC-based aggregation allows for the discovery of events that are masked in standard count-based analysis. Figure 4b shows an example where we discovered 3’ UTR isoform switching, an event which could not be identified with a gene counts-based analysis. While p-value aggregation works well for gene-level differential expression analysis, aggregation can be extended to other natural groupings. To demonstrate the generality of the approach, we applied p-value aggregation to gene ontologies (Ashburner, 2000). Classic gene ontology (GO) analysis of a RNA-Seq experiment involves first performing gene differential expression analysis to obtain either a list of statistically differential genes (i.e. all genes with q-value < 0.05) or a rank order list of genes (i.e. ordered by p-value) and then identifying GOs that are statistically enriched in this gene list. Common statistical tests for enrichment include Fisher’s exact test and Wilcoxon rank-sum test (Huang et al., 2009, Mi et al., 2013). Instead of testing for enrichment of GOs, we examined the complementary question of “perturbation analysis,” namely, whether the GO is significantly perturbed. To test for perturbation, we aggregated p -values based on transcript quantifications or TCCs for all genes in each GO term to obtain
enrichment analysis, this perturbation analysis utilizes the information derived from all genes and reveals information not only about membership, but also about the significance of perturbation.
We performed differential expression and GO analysis on recently published RNA-Seq data that examined the effect of dexamethasone treatment on primary neural progenitor cells of embryonic mice (Frahm et al., 2017, GEO Series GSE95363). First, we performed differential expression using each of the four previously discussed aggregation methods to obtain differential gene lists (FDR < 0.05). (Additional file 1: Fig. S4 compares differential expression with sleuth standard gene mode vs. Lancaster aggregating TCC p-values.) Then, we applied classical GO enrichment analysis to each method’s differential gene list. The Lancaster method applied to TCC derived p-values produced the differential gene list that is enriched for the most “immune”-containing GO terms (Figure 5a). To apply the GO perturbation test, we performed further aggregation on the gene p-values resulting from differential expression analysis to generate GO p -values, resulting in a total of four GO perturbation tests. Each GO perturbation test resulted in a perturbed GO list (FWER < 0.05) that was more enriched for “immune”-containing GO terms than the corresponding enrichment test (FWER < 0.05) (Additional file 1: Fig. S5).
(GO:0008152), immune system process (GO:0002376), inflammatory response (GO:0006954), and response to hormone (GO:0009725). As a comparison, the corresponding classical enrichment analysis using Fisher’s exact test revealed 2123 enriched GO terms (<0.05 FWER). Many of the perturbed GOs mentioned above were also enriched, but system process and inflammatory response were not (FWER = 0.27 and 1.00). In other words, an enriched ontology is likely perturbed, but not vice versa, and indeed, many “immune”-containing GO terms were perturbed but not enriched (Figure 5b). These results suggest that perturbation analysis can be a useful and powerful complementary analysis to standard GO enrichment analysis.
Discussion
The method of p-value aggregation is also extendable to testing other features of biological interest. We have demonstrated its utility for GO analysis to test for perturbation of gene ontologies, a complementary analysis that can be used in addition to existing GO enrichment tests. Aggregation can be performed hierarchically to maintain resolution at all levels including transcripts, genes and gene ontology terms. Further applications can include testing for intron retention, differential transcript start site (TSS) usage, and other use cases where aggregation of features is of interest. Finally, gene-level testing directly from TCC counts is particularly well-suited for single-cell RNA-Seq analysis, where many technologies produce read distributions that are non-uniform across transcripts.
Conclusions
Transcript differential analysis and gene differential analysis for RNA-Seq have been two independent procedures up until now. Aggregating transcript p-values with the Lancaster method to call gene differential expression not only outperforms other gene-level methods, it also retains information about transcript dynamics and produces one coherent analysis between transcripts and genes. This framework can be leveraged to study multiple resolutions of biology, such as performing a hierarchical analysis of transcripts, genes and gene ontologies, or to bypass artifacts introduced at a particular resolution, such as obtaining gene-level results without transcript quantification by aggregating on transcript compatibility counts.
Methods
Aggregation of p-values
Fisher’s method aggregates Kp-values p1,…, pK, which, under the null hypothesis,
are independent and uniformly distributed between 0 and 1. Under the null hypothesis, the test statistic ! = +*,-−2 log )* is chi-squared distributed with degrees of freedom
(df) = 2K. The aggregated p-value is therefore 1 − /( +*,-−2 log )* ) , where / is the
cumulative distribution function (CDF) of a chi-squared distribution with df = 2K. (Fisher, 1932)
w1,…,wK. According to the Lancaster method, under the null hypothesis where all studies
have zero effect, the test statistic ! = +*,-/2*3-()*) , where /2*3- is the inverse CDF of the
chi-squared distribution with df = wi, follows a chi-squared distribution with 45 =
6*
+
*,- . Fisher’s method is a specific instance of the Lancaster method where all p-values
are uniformly weighted by 2, and we found that the Lancaster method applied with a weighting scheme based on transcript counts outperformed Fisher’s method (Additional file 1: Fig. S6).
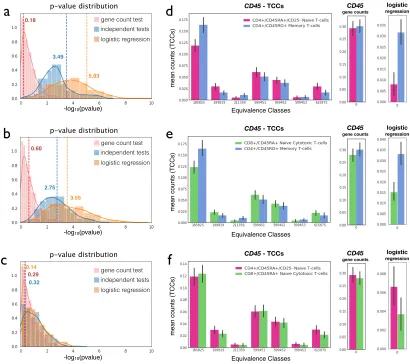
We investigated whether the assumptions of Fisher’s and the Lancaster method, namely that p-values are independent and uniformly distributed under the null hypothesis, apply to RNA-Seq. Additional file 1: Fig. S7 shows a distribution of the transcript p-values for the dexamethasone RNA-Seq data we examined. Aside from a peak close to 0, presumably corresponding to the differential transcripts, the p-values appear to be uniformly distributed. Furthermore, the Additional file 1: Section 3 contains a walkthrough of the experiments we performed to test the independence between transcripts under the null hypothesis, showing that while transcripts of the same are not independent in general, the dependence is weak and does not lead to exaggerated p-values or inflated false discovery rates (Additional file 1: Figs. S8, S9).
The Šidák method (Šidák, 1967) utilizes a test based on the minimum p-value m
= min(p1,…, pK), namely the adjustment 7 = 1 – 1 − m +. In the context of K isoforms
with p-values p1,…, pK, 7 is the gene-level p-value based on adjusting for the number of
isoforms in the gene. If there are M genes, the adjustments will generate p-values 71, …, 7M,
result from DEXSeq (Anders et al., 2012), and while both methods control the false discovery rate, the gene ranking is different between the two methods (Additional file 1: Section 2).
Transcript differential analysis and aggregation
Transcript compatibility count differential analysis and aggregation
Transcript compatibility counts (TCCs) of RNA-Seq reads were obtained with the kallisto pseudo option, which outputs a TCC matrix whose two dimensions are the number of samples and number of equivalence classes. Each TCC represents the RNA-Seq counts corresponding to an equivalence class of transcripts. All TCCs corresponding to transcripts from more than one gene were filtered out from the analysis; 88% of reads were retained after applying this filter. The remaining TCCs were used to perform differential expression with sleuth (Pimentel et al. 2017) and DESeq2 (Love et al. 2015) by using TCCs in lieu of transcript/gene counts. In order to use sleuth, we performed 30 bootstraps on TCCs, whose results were inputted into sleuth to estimate inferential variance. Non-expressed TCCs were filtered from the sleuth analyses and the default filter in DESeq2 was used. Both methods were performed with the likelihood ratio test because we found that the Wald test applied to TCCs reported overly liberal FDRs. The resulting TCC p-values from the differential expression analysis were aggregated using the Lancaster method, with p-value weights equal