Parameters Extraction of Unified Power Quality Conditioner on the
Calculation of a Membership Function
Ahmed M. A. Haidar1.2, Chellali Benachaibab3, Norhuzaimin Julaia1,
and Mohamed Fareq Abdul Malek4
1Department of Electrical and Electronic Engineering, Faculty of Engineering,
University Malaysia Sarawak, Malaysia
2School of Mechanical and Electrical Engineering,
University of Southern Queensland, Australia
3Faculty of Science and Technologies, Bechar University, Algeria
4Faculty of Engineering and Information Sciences, University of Wollongong in Dubai,
United Arab Emirates
Abstract: The Unified Power Quality Conditioner (UPQC) has the capability of improving power quality in the industrial distribution systems. It is a combination of shunt and series active power filters, both joined together by a common Direct current (DC) bus. The major issue when utilizing the UPQC is the determination of the optimal parameters. The traditional method used to determine the optimal parameters of the UPQC is a daunting task, because the system requires greater computational and simulation efforts. This paper proposes a faster approach using the concept of a Membership Function (MF) in which a Weight Factor (WF) is utilized. In the proposed technique, a range of values is specified for each parameter of the filters. These values are used to design a membership function for each parameter, and the choice of the optimal parameter is extracted by the aid of a WF. In this study, the effectiveness of the UPQC was tested at various system conditions to verify the performance of the proposed technique. The presented results show that the obtained parameters of UPQC using the proposed technique can provide fast dynamic response.
Keywords: Voltage sag, Harmonic distortion, Membership Function, UPQC, Series and shunt active power filters
1. Introduction
Power quality is an important issue to the Electricity distribution companies, as they are obliged to supply consumers with desirable quality of power supply. In order to maintain the quality of power in the system, the existing level of disturbances such as harmonic, dip, surge, interruptions, flicker and signaling voltages should be determined. It is well known that the sensitive electronic equipment can strongly be impacted due to the disturbances in the voltage (harmonics and sag). Such disturbances may lead to overall tripping in the industrial plants [1]. In the modern power plants, power electronic devices are widely used. Generally, these technologies produce distortion in voltages and currents [2]. Therefore, mitigating equipment is often installed by industrial customers to protect their own plants and avoid high economic damage due to the loss of daily production. Since the power quality problems can also affect the distribution utilities and industrial customers, new trends have been initiated to install dual mitigating techniques in both sides. With such environment, sensitive equipment can be protected from voltage disturbances and thus reducing the injected distortion by this equipment to the network [3].
The decrease for a short duration in the Root Mean Square (RMS) of a supplied voltage is referred as voltage sag. This duration is in the range of 5 cycles to a minute [4]. Depending on the fault type and distribution system topologies, the voltage sag could have unbalanced behavior [5]. This occurs when voltage phasors differ in amplitude and the phase relationship becomes not equal to 120° [6]. Voltage sag is normally occurs due to a sudden change in the line current
flowing through the source impedance caused by faults, transitional events (similar starting time of motors) or increase in load demand [4].
The change in the waveform from the ideal sinusoidal waveform of a supply voltage is known as harmonic distortion. Total Harmonic Distortion (THD) is a term used to measure the harmonic distortion level. Usually, THD for voltage or current is defined as the total RMS value of individual harmonics divided by the RMS value of the fundamental, and then multiplied by 100% [7].
Active power filters (APFs) are the most promising solution for power quality issues in the distribution system. They are classified based on the implemented control techniques, the strategy of connecting the feedback signals and the design of power inverter. There are four types of these filters known as UPQC, shunt APF, series APF and hybrid APF. Given the multitude of problems concerning power quality improvement, UPQC has been proposed for voltage sag compensation and harmonic mitigation [2, 7, 8]. It is one of the most flexible techniques that can offer the advantages of both shunt APF and series APF, which are combined in one power quality enhancement device [2, 9]. The concept of active filtering in the UPQC is to maintain the load current distortion from a time domain instead of a frequency domain approach [10]. Here, the parameters and operating conditions may strongly affect the performance of UPQC.
While the performance of UPQC can be impacted by the components of converting system (soft switches, resistors, inductors, capacitors and DC link voltage), the process whereby the reference current is obtained and the control strategy (hysteresis, triangular carrier, periodical sampling) utilized in generating the Pulse Width Modulation (PWM) [5, 11, 12] play significant role in improving the power quality of the whole system. Intelligent control and optimization methods for the UPQC have been proposed in many articles, particularly in [4, 11, 13–17]. The applications of fuzzy logic to control the shunt and series active power filters are presented in [11, 14, 16]. Particle swarm optimization has been proposed in [4, 13] to optimize the feedback signals of UPQC. Genetic algorithm was applied to optimize the parameters of the UPQC as discussed in [17]. Other methods proposed for power quality improvement using conventional techniques are outlined in [2, 8, 10, 18, 19].
In the aforementioned studies, the methods of selecting the optimal parameters for shunt and series APFs have not received much attention. Though, the parameters of the UPQC have been optimized in [17], however, a comprehensive study is not provided and the model is simply focusing on the application of genetic algorithm. Basically, the parameters of the controlled signals are derived by the control circuit of UPQC. As the integral gain of controller corrects the steady state error of the voltage control, the increase in proportional gain can cause instability in the system [9, 18, 19]. Hence, optimal regulation of proportional controllers with accurate selections of the resistor, inductor and capacitor values is crucial for the DC voltage control. This work is an extension of that presented in Ref. [20], where the impacts of resistor, inductor and capacitor values on the performance of UPQC have been analyzed. This paper presents a technique to extract the optimal parameters of UPQC by calculating their Membership Functions (MFs) based on the Weight Factors (WFs). Initially, the values of parameters in the system are used to design the shape of MFs. Then, the MPs are calculated for each two variables, and combined together to produce the calculated membership of the selected criteria used to extract the parameters in each set. In the selected criteria, the optimal parameters are those showing a high value of the calculated MF. A comprehensive analysis was performed to validate the proposed method using the MATLAB environment. Section 2 formulates the parameters of series and shunt filters and presents the modeling and control of UPQC. The concept of parameters extraction using MFs with its application is explained in Section 3. Results and conclusion are given in Section 4 and 5 respectively.
2. Structure And Principal Operation
handled by using series active power filter (APF). The concepts and principal operations of shunt and series APFs are explained in this Section.
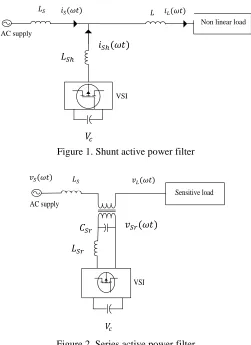
The circuit diagram of Shunt APF is depicted in Figure 1. The principal operation of APF is to force the source current to be pure sinusoidal. This can be achieved by generating a current to be injected into the point of coupling, which is equal and opposite in polarity to the harmonic current drawn by the load [1, 9, 21]. To cancel the harmonics generated by the non-linear load and to
make the source current sinusoidal, the injected current by the shunt inverter “
i
Sh(
t
)
” isdetermined by the following equation,
iSh(
t)iS(
t)iL(
t) (1) [image:3.516.142.393.314.659.2]where,
i
S(
t
)
andi
L(
t
)
are the reference source current and the load current respectively.Figure 2 shows the diagram of series APF illustrating the basic operation of this filter. The series inverter injects its generated voltage in such a way, so that the voltage at the load side would be at desired voltage magnitude [1, 18]. To maintain the voltage at the load terminal to be equal to
the nominal voltage, the applied voltage by series inverter “
v
Sr(
t
)
” is found as,vSr(
t)vL(
t)vS(
t) (2)where, vL(
t) and vS(
t)are the desired voltage at the load bus, and the source voltage [image:3.516.169.366.487.644.2]respectively. As seen from Eq. (2), to compensate voltage dip, a voltage (in-phase) should be applied by the series inverter so that the sum of the reduced source voltage and series voltage maintain the desired load voltage.
Figure 1. Shunt active power filter
Figure 2. Series active power filter
Non linear load
Ls L
Vc AC supply
is(wt) i(wt)
Lsh
VSI
ish(wt)
Non linear load
𝑖𝐿(𝜔𝑡) 𝑖𝑆(𝜔𝑡)
𝑖𝑆ℎ(𝜔𝑡)
𝑉𝑐
𝐿𝑆ℎ
𝐿𝑆 𝐿
Ls
Cdc AC supply
VSI Isr
Crf
Sensitive load
𝑉𝑐
𝑣𝑆𝑟(𝜔𝑡)
𝑣𝐿(𝜔𝑡) 𝑣𝑆(𝜔𝑡) 𝐿𝑆
𝐿𝑆𝑟
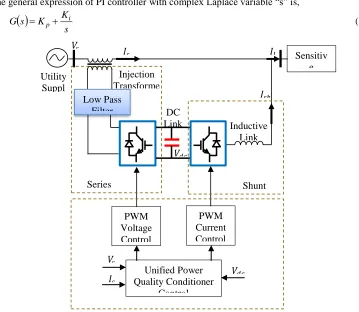
The generic structure of UPQC considered in this study is an integration of shunt and series active power filters connected through DC link as shown in Figure 3. In this configuration, the series APF is connected to the distribution network through transformer, while the shunt APF connection is made to the load through inductive link. The series and shunt APFs are operated with a classical PI (Proportional Integration) controllers. The control of series inverter is sinusoidal Pulse Width Modulation (PWM) and the shunt inverter is hysteresis current control [2, 7, 22, 23, 24]. The conventional configuration of UPQC with the its dynamic control equations characterizing the feedback signals are well documented [1 – 4, 22, 23, 24, 25], and hence, are not presented in this paper. Normally, the UPFC employs two voltage source inverters (VSIs) connected to a common DC link formed by using capacitor. The DC link capacitor provides a power to the VSIs which inject the series voltages and shunt currents into the system. Referring to Figure 3, the series APF is voltage controlled, whereas the shunt APF is current controlled. The objective of the shunt APF is to regulate the DC link voltage between APFs, making the DC link voltage constant even during system disturbances. It is to be noted that in the normal condition, a change in the DC link voltage can be occurred due to power losses caused by the system and inverter operations (losses of soft-switching). Such losses should be compensated to maintain a constant DC voltage during the normal operation [25]. Here, the reference voltage is determined using the following equation,
VShReKPIShReKI
IShdt (3)IShIShReISh (4)
where, IShRe is the reference current of the Shunt APF; KP and KIare the proportional gain and
integral gain of the PI controller respectively. The IShis calculated using the PI controller, and
the general expression of PI controller with complex Laplace variable “s” is,
s K K s
[image:4.516.83.442.340.652.2]G p i (5)
Figure 3. Conventional UPQC structure
Sensitiv e
Inductive Link Low Pass
Filter Utility
Suppl y
Injection Transforme
𝑉𝑠 𝐼
𝑠
PWM Current Control PWM
Voltage Control
Unified Power Quality Conditioner
Control
𝑉𝑑𝑐
𝑉𝑠
𝐼𝑠
DC Link
𝑉𝑑𝑐
Shunt APF Series
APF
𝐼𝑠ℎ
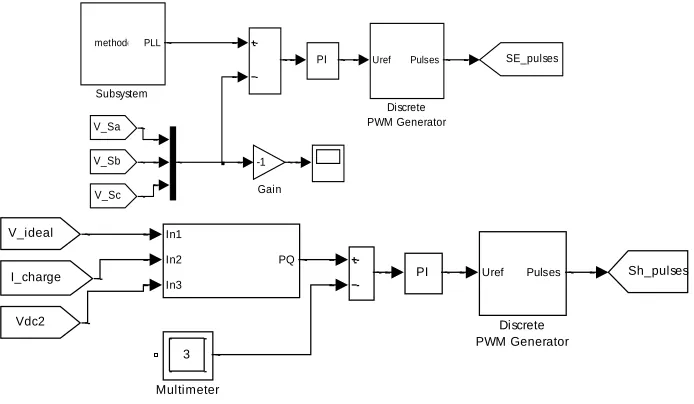
As seen from Figures 3 and 4, the control of UPQC is realized in three stages, in the first stage, the information of the system (voltage and current) is gathered from the measuring units. Using the sensed values of the voltage and current, the compensating commands are derived according to the control methods and configuration of the system. Commonly, the input variables to the controller are error defined as the difference between the desired and real signals. The derived error signal is then processed in a controller. In the last stage, the gating signals for the soft-switches of VSIs are generated. In the shunt APF, a closed loop is employed known as hysteresis control to generate the gate signals of the shunt VSI, while for the series APF an open lope is utilized known as SPWM to generated the gate signals of the series VSI. Referring to Figure 4, the control circuit of shunt APF calculates the compensating current for current harmonic and reactive power compensation. The control circuit of series APF compares the actual voltage and reference voltage to generate the difference to be injected into the system.
Figure 4. Conventional control of UPQC
3. Parameters Extraction Using MF
As it was concluded in the previously published work [20], the classical technique requires great efforts to acquire the actual parameters of the UPQC. Therefore, such technique may not be effective to find the optimal parameters of the system. To overcome this issue, the principle of membership calculation incorporated with the utilization of WF is used to help in extracting the best values of the main parameters, considering the mutual relationship between these parameters. More details about the proposed method are described in this Section.
A. The Concept Of Parameters Extraction
The approach to parameters extraction of UPQC is achieved based on mapping these parameters into MFs in order to determine the membership of each given input. The values of the parameters involved in the system are used to design the membership functions. These functions are calculated for each parameter in the power circuit using a trapezoidal MF. In other words, the fundamental concept behind membership function is that, the extracted parameter based on the calculation of the designed function incorporated with the WF should have the higher value of membership. In this work, Trapezoidal function was chosen as it is more adapted for such application, where simple formulas and computational efficiency are required. It should be noted that the design of MFs for other topologies can be different depending on the system topology and the applied control technique.
methode a PLL
Subsystem
SE_pulses
Goto
-1
Gain V_Sc
V_Sa
V_Sb
Uref Pulses
Discrete PWM Generator PI
In1
In2
In3
PQ
iden PQ
3
Multimeter
Sh_pulses I_charge
Vdc2 V_ideal
Uref Pulses
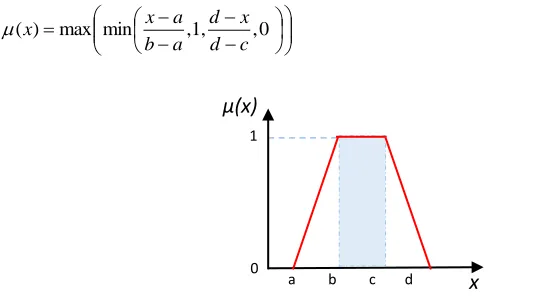
A trapezoidal MF is specified by four parameters (
a
,
b
,
c
,
d
) that determine the “x
”coordinates of the four corners as seen in Figure 5, and expressed mathematically as,
[image:6.516.91.363.96.246.2]
(6)
Figure 5. Selected trapezoidal MF for parameters extraction
The shape of the MF is normally representing the fuzziness of the variables describing the Fuzzy systems [26]. While the approach for parameters extraction as proposed is based on the shape of MF, table of fuzzy sets and defuzzification (including Fuzzy inference system) are not applied in this work. The technique of selecting the best values of the parameters is based on mapping the input data into MFs. The configuration of UPQC with the controlled PWM converters as shown in Figures 3 and 4 was simulated by considering different scenarios to generate a range of values for each parameter of the system. These values are used to design the MFs. The approach for using the proposed technique is summarized by the following steps:
1. The system is analyzed by considering different scenarios to determine a range of values used
to design the MF for each parameter.
2. The values of MFs for the parameters involved in the power circuit are calculated using Eqs.
(7) – (15) as presented in the next subsection.
3. Finally, from the calculated sets with each WF, the memberships that show maximum values
are extracted as the optimal parameters of UPQC.
B. Application Of The Concept: A Case Study
The parameters of the system are selected depending on the scope of study. In this work, the considered parameters to design the MFs are: THD of load voltage, THD of source current, voltage mitigation (VoltM), resistor and inductor. Figures 6 (a, b) and 7 (a, b, c) show the trapezoidal MFs which have been designed from the simulation of the system given in Figures 3 and 4. Note that the range of values are selected based on the capacity of the power filters, the desired input source and the output voltage. Mapping these values through the designed membership functions as seen in the Figures 6 and 7, is used to define how each point in the input space represented by the values of system components is mapped to a degree of membership between 0 and 1 [ 27]. In the next step, the MFs are calculated, in which the WFs are employed as demonstrated for each set in the following examples. Here, extracting the best values of the sensitive parameters utilized in the UPQC, can be achieved using the selected criteria of the highest membership
Example for Set 1:
The optimal parameter values are found through the calculation of MF for each parameter using the WF. First, for resistor with inductor, then THD of the load voltage (THDVL) with THD of the source current (THDIS), these relationships can be written as,
max min ,1, ,0
) (
c d
x d a b
a x x
1
a b c d
µ(x)
x
(7)
(8)
(9)
where, : Weight Factor; ( =0-1) is the length of the WF; : MF of the resistor; : MF
of the inductor; : MF of the selected criteria for the extracted parameters in the first set;
: MF of THD for the load voltage; : MF of THD for source current.
Example for Set 2:
In this considered set, the calculation of MF is made first for resistor with THD of the source current (THDIS), then, the inductor with the THD of the load voltage (THDVL). It can be written for each MF as,
(10)
(11)
(12)
where, is the MF of the selected criteria for the extracted parameters in the second set.
Example for Set 3:
The MF is determined in this considered set for resistor with THD of the load voltage (THDVL), and then for inductor with THD of the source current (THDIS). The calculated MFs can therefore be expressed by,
(13) (14) (15)
[image:7.516.155.383.560.649.2]where, is the MF of selected criteria for the extracted parameters in the third set.
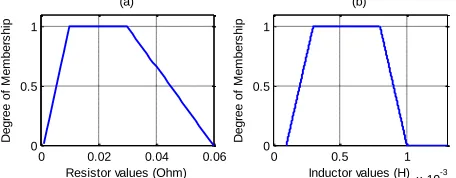
Figure 6. Trapezoidal MFs, a) for resistor values, b) for inductor values
r l
r l
i
i
2 1 , min 1
THDVl THDIs
THDVl THDIs
i
i
2 1 , min 2
1 2
1 2
1
2 1 ,
min
cr i i
i
i
r
l1 cr
THDVl
THDIs
r THDIs
r THDIs
i
i
2 1 , min 3
THDVl l
THDVl l
i
i
2 1 , min 4
3 4
3 4
22 1 ,
min
cr i i
2 cr
r THDVl
l THDVl
i
i
2 1 , min 5
THDIs l
THDIs l
i
i
2 1 , min 6
5 6
5 6
32 1 ,
min
cr i i
3 cr
0 0.02 0.04 0.06
0 0.5 1 D e g re e o f M e m b e rs h ip
Resistor values (Ohm) (a)
0 0.5 1
x 10-3 0 0.5 1 D e g re e o f M e m b e rs h ip
Figure 7. Trapezoidal MFs, a) for THD of load voltage, b) for THD of the source current, c) voltage mitigation
4. Results and Verification
The proposed approach as present in this paper has been implemented and verified using the simulation module shown in Figure 8. The standard values of the parameters used in the simulation are given in Table 1. The power circuit part in Figure 8 is modeled as a 3-phase system with a nonlinear load (diode bridge with RL). The reference signals for PWM switching frequencies of UPQC are obtained from the modeled proportional control using MATLAB/Simulink. The simulation steps started with the generation of the data for designing the shape of the MFs as explained in details in Section 3. The simulation time was set for 1 sec, and during this time, voltage sag and harmonic distortion were applied into the system. The assumed starting time for the operation of series APF is 0.2 sec, while the shunt APF starts at 0.4 sec to operate. Several simulations were carried out in which the values of capacitor for the shunt APF and the values of the resistor and inductor for series APF were varied. In order to avoid the initial transient state in the simulation, the data is collected from 0.08 sec. After the next step which is explained in the next paragraph, the optimal parameters values are found, these values are tested to ensure that UPQC can maintain a desired voltage level and free from distortion at the load bus.
Initially, the MFs for each set as presented in section 3 (subsection 3.2) have been calculated. Ten subsets were considered in each set, where the value of the WF was changed (0 to 1). In other words, for each subset of the same set, deferent WFs were utilized. The extracted parameters in each subset related to each WF, are those values representing higher MFs in the subsets. These chosen values are used to adjust the components of UPQC. Tables 2–4 demonstrate only the selected values based on the higher membership found from the calculation of MFs, in which the WFs were employed.
2 2.5 3
0 0.5 1
D
e
g
re
e
o
f
M
e
m
b
e
rs
h
ip
THD of load voltage values (%) (a)
0.6 0.8 1 1.2
0 0.5 1
D
e
g
re
e
o
f
M
e
m
b
e
rs
h
ip
THD of source current values (%) (b)
304 305 306 307 308 309 310
0 0.2 0.4 0.6 0.8 1
D
e
g
re
e
o
f
M
e
m
b
e
rs
h
ip
Figure 8. Detailed Simulink module of the UPQC using MATLAB environment
Discrete, Ts = 4e-006 s.
pow ergui
v+ -Volt4 v
+ -v +
-v + -Volt1
Vcd g A B C
+
-g A B C
+ -A1+ A1 B1+ B1 C1+ C1
A2+ A2 B2+ B2 C2+ C2 Vabc
Iabc A
B
C a
b
c
Three-Phase V-I Measurement1
Vabc Iabc A
B
C a b c Three-Phase V-I Measurement Out1
Out2
Out3 Source
S_Voltage1
S_Voltage
S_Current2
S_Current
A
B
C +
-Rectifier L_Voltage2
L_Voltage
L_Current2 L_Current
V_Sb
V_Sc V_Sa
Vdc2 V_Source
I_Source
I_charge V_charge
Sh_pulses
SE_pulses Control Series Control Shunt
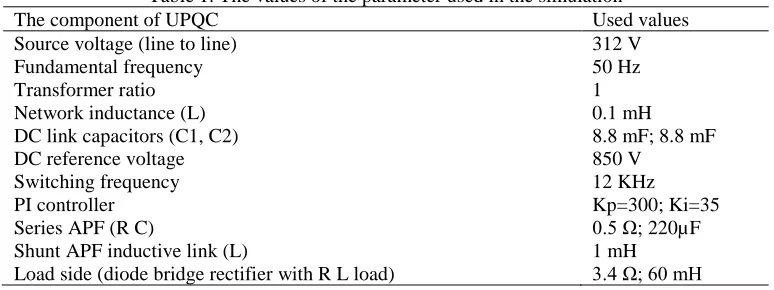
Table 1. The values of the parameter used in the simulation
The component of UPQC Used values
Source voltage (line to line) 312 V
Fundamental frequency 50 Hz
Transformer ratio 1
Network inductance (L) 0.1 mH
DC link capacitors (C1, C2) 8.8 mF; 8.8 mF
DC reference voltage 850 V
Switching frequency 12 KHz
PI controller Kp=300; Ki=35
Series APF (R C) 0.5 Ω; 220µF
Shunt APF inductive link (L) 1 mH
[image:10.516.77.463.242.349.2]Load side (diode bridge rectifier with R L load) 3.4 Ω; 60 mH
Table 2. Results of the extracted parameters for set 1
MF Resistor (Ω) Inductor (H) THDVL (%) THDIS (%) VoltM (V)
λ=0.1
0.0040 3×10⁻³ 0.1×10⁻³ 3.55 1.13 305.5
λ=0.25
0.0029 5×10⁻³ 0.2×10⁻³ 2.83 1.19 307.58
λ=0.50
0.0019 5×10⁻³ 0.2×10⁻³ 2.83 1.19 307.58
λ=0.75
[image:10.516.75.461.377.488.2]0.0010 5×10⁻³ 0.2×10⁻³ 2.83 1.19 307.58
Table 3. Results of the extracted parameters for set 2
MF Resistor (Ω) Inductor (H) THDVL (%) THDIS (%) VoltM (V)
λ=0.1
0.0040 3×10⁻³ 0.1×10⁻³ 3.55 1.13 305.5
λ=0.25
0.0023 5×10⁻³ 0.2×10⁻³ 2.83 1.19 307.58
λ=0.50
0.0014 10×10-3 0.4×10⁻³ 2.04 1.07 308.5
λ=0.75
[image:10.516.72.462.529.639.2]0.0010 10×10-3 0.4×10⁻³ 2.04 1.07 308.5
Table 4. Results of the extracted parameters for set 3
MF Resistor (Ω) Inductor (H) THDVL (%) THDIS (%) VoltM (V)
λ=0.1
0.0040 3×10⁻³ 0.1×10⁻³ 3.55 1.13 305.5
λ=0.25
0.0023 5×10⁻³ 0.2×10⁻³ 2.83 1.19 307.58
λ=0.50
0.0014 30×10-3 0.6×10⁻³ 1.77 1.07 309.1
λ=0.75
Referring to Tables 2–4, it is seen that the selected values of the parameters involved in the UPQC are directly related to the changes in the system components. For instance, in a real system, the values of resistor and inductor are determined based on the design of the UPQC. Therefore, when evaluating the effectiveness of the UPQC by increasing the values of resistor or inductor or even capacitor, it is crucial to take into account the cost and weight including the physical size of the converting system. It is worth to mention here that adding extra components to the UPQC for achieving effective sag compensation and fast harmonic mitigation, these achievements should compensate the extra cost, size and volume due to adding the extra components. As a result, the designer will need to select from the listed parameters in the above Tables those values that have less THD and acceptable voltage mitigation, avoiding the high cost and weight due to unnecessary increase in the size of resistor or inductor.
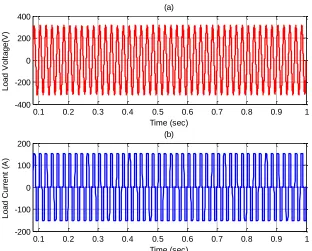
In order to verify the performance of UPQC with the optimal parameters found using the proposed technique, simulations were carried out on the test system as shown in Figure 8 to validate the effectiveness of the extracted parameters. The selected results for system evaluation and verification are shown in Figures 9 (a, b) and 10 (a, b) respectively. To minimize paper length, the results of all extracted parameters listed in Tables 1–3 are not included here as there are only slight changes compared with the selected verified results. The sag at the source voltage is assumed to be occurred at time = (0.2–0.3) sec, and at time = (0.4–0.3) sec, this voltage assumed to be distorted. The voltage and current profiles are shown in Figure 9 (a, b), the disturbances are also indicated in this figure. The UPQC should maintain the voltage and current. As seen from Figure 10 (a, b). The series APF injects the required compensating voltage through the transformer, making the load voltage at desired level. Similarly, the Shunt APF injects the required compensation, making the load current free from distortion. These results show the performance of the UPQC with the optimal parameters obtained using the proposed technique.
Figure 9. System evaluation during disturbances, (a) Source voltage (b) Source current
0.1 0.2 0.3 0.4 0.5 0.6 0.7 0.8 0.9 1 -400
-200 0 200 400
S
o
u
rc
e
V
o
lt
a
g
e
(V
)
Time (sec) (a)
0.1 0.2 0.3 0.4 0.5 0.6 0.7 0.8 0.9 1 -500
0 500
S
o
u
rc
e
C
u
rr
e
n
t
(A
)
Figure 10. UPQC operation with the extracted parameters, (a) Load voltage (b) Load current
Furthermore, the system stability has been investigated when using different optimized and non-optimized values of resistors, inductors for the shunt and series APFs. The results of the control response are depicted in Figures 11. It can be observed from this figure the impact of the resistor and inductor values on the DC link voltage. It can also be seen the change in the system response with various values. It is to be noted that the selected optimal values of the parameters should not impact the system during the normal operation, as the stability of the DC voltage depends on the optimal parameters values of UPQC.
Figure 11. Control response of the DC voltage during voltage sag with different RL values
0.1 0.2 0.3 0.4 0.5 0.6 0.7 0.8 0.9 1 -400
-200 0 200 400
L
o
a
d
V
o
lt
a
g
e
(V
)
Time (sec) (a)
0.1 0.2 0.3 0.4 0.5 0.6 0.7 0.8 0.9 1 -200
-100 0 100 200
L
o
a
d
C
u
rr
e
n
t
(A
)
Time (sec) (b)
0.1 0.2 0.3 0.4 0.5 0.6 0.7 0.8 0.9 1
400 500 600 700 800 900 1000
D
C
V
o
lt
a
g
e
(
V
)
Time (sec)
[image:12.516.128.408.440.654.2]5. Conclusion
A simplified mathematical approach to extract the optimal parameters of UPQC has been proposed in this paper. This proposed technique would be very useful to determine the actual values of the parameters with less effort. Conceptual analyses of the extracted parameters using the controlled UPQC are also presented in this paper. Furthermore, different operating conditions were considered to evaluate the performance of UPQC with the extracted parameters during voltage sag and harmonic distortion. It is revealed from the results that the proposed approach is an effective in identifying the actual parameters of UPQC implemented on a three-phase distribution system.
6. Acknowledgement
The work was partly supported by the F02/FRGS/1497/2016 grant from the Ministry of Higher Education, Malaysia.
7. References
[1]. Khadkikar, V., “Enhancing electric power quality using UPQC: A comprehensive
overview,” IEEE Trans. Power Electronics, vol. 27(5). 2012.
[2]. Khadkikar V., Chandra, A., “A novel structure for three-phase four-wire distribution
system utilizing unified power quality conditioner,” IEEE Trans. Industry Applications,
vol. 45(5), 2009.
[3]. Bruno W. França, Leonardo F. da Silva, Maynara A. Aredes, Maurício Aredes, “An
Improved iUPQC Controller to Provide Additional Grid-Voltage Regulation as a STATCOM”, IEEE Transactions on Industrial Electronics, Vol. 62, No. 3, 1345 – 1352 March 2015.
[4]. Kumar, G. S., Kumar B. K., Mishra, M. K., “Mitigation of voltage sags with phase jumps
by UPQC With PSO-based ANFIS,” IEEE Trans. Power Delivery, vol. 26(4), 2761–2773,
2011.
[5]. Kesler, M., Ozdemir, E., “Synchronous reference-frame-based control method for UPQC
under unbalanced and distorted load conditions,” IEEE Trans. Industrial Electronics, vol.
58 (9), 3967–3975, 2011.
[6]. Ahmed M.A. Haidar and Kashem M. Muttaqi., “Effects of PEV Penetration on Voltage
Unbalance,” Springer Singapore, Plug-In Electric Vehicles in Smart Grid, Book Chapter 10, 279 – 307, 2015.
[7]. Alper, T., et al., “A current source converter-based active power filter for mitigation of
harmonics at the interface of distribution and transmission systems,” IEEE Trans. Industry
Applications, vol. 48 (4), 1374–1386, 2009.
[8]. Khadkikar, V., Chandra, A., UPQC-S: A novel concept of simultaneous voltage sag/swell
and load reactive power compensations utilizing series inverter of UPQC, IEEE Trans.
Industrial Electronics, vol. 26(9), 2414–2425, 2011.
[9]. Khadkikar V., Chandra, A., A new control philosophy for a unified power quality
conditioner (UPQC) to coordinate load-reactive power demand between shunt and series
inverters, IEEE Trans. Power Delivery, vol. 23 (4), 2522–2534, 2008.
[10].Asiminoaei, L, Blaabjerg, F., Hansen, S., Thogersen, P., “Adaptive compensation of
reactive power with shunt active power filters,” IEEE Trans. Industry Application, vol. 44
(3), 867– 877, 2008.
[11].Laxmi, A., Ram, G., Rao, K., “Role of PI and fuzzy controllers in unified power quality
conditioner, Journal of Engineering and Applied Sciences,” vol. 2 (2) 1 – 10, 2007.
[12].Rong, Y, Li, C., Tang, H., Zheng, X., “Output feedback control of single-phase UPQC
based on a novel model,” IEEE Trans. Power Delivery, vol. 24 (3), 1586–1597, 2009.
[13].Karanki, S. B., Mishra, M. K., Kumar, B. K., “Particle swarm optimization-based feedback
controller for unified power-quality conditioner,” IEEE Trans. Power Delivery, vol. 25 (4),
[14].Rao, R.V.D.R., Dash, S. S., “Power quality improvement by using unified power quality
conditioner with PID and fuzzy logic controller,” International Journal of Electronic
Engineering Research, vol 2 (5), 663–676, 2010.
[15].Reaz, M., Choong, F., Sulaiman, M. S., et al., “Expert system for power quality disturbance
classifier, IEEE Trans. Power Delivery, vol. 22 (3), 1979 – 1988, 2007.
[16].Liu, R., Xia, N., Wang, X., “The research on fuzzy-PID control in unified power quality
conditioner,” the 4th IEEE Conference on Industrial Electronics and Applications, 821–
824, 2009.
[17].Benachaiba, C., Abdelkhalek, O., Dib, S., Haidas, M., “Optimization of parameters of the
unified power quality conditioner using genetic algorithm method,” Journal of Information
Technology and Control, vol.36 (2), 242–245, 2007.
[18].Teke, A., Saribulut, L, Tumay, M., “A novel reference signal generation method for
power-quality improvement of unified power power-quality conditioner,” IEEE Trans. Power Delivery,
vol. 26 (4), 2205 – 2214, 2011.
[19].Pedro, E. M, et al., “Analysis, Design and Control of a Unified Power-Quality Conditioner
Based on a Current Source Topology, IEEE Trans. Power Delivery, vol. 27 (4), 1727–1736,
2012.
[20].Haidar, A. M. A., Benachaiba, C., Ibrahim, F. A. F., Hawari, K., “Parameters evaluation
of unified power quality conditioner,” in IEEE International Conference on
Electro/Information Technology, 1–6, 2011.
[21].Akagi. H., “New trends in active filters for power conditioning,” IEEE Trans. Industry
Applications, vol. 32 (6) 1312–1322, 1996.
[22].Santos, R. J. M. D., Mezaroba, M., and da Cunha, J. C., “A dual unified power quality
conditioner using a simplified control technique,” in Proc. Of the COBEP conference, 486–
493 (2011).
[23].Hirofumi Akagi, Edson Hirokazu“Instantaneous Power Theory and Applications to Power
Conditioning” ,2007,IEEE Press ,pp 4338.
[24].F. Mekri, M. Machmoum, N. A. Ahmed, and B. Mazari, “A fuzzy hysteresis voltage and
current control of an unified power quality conditioner,” in Proc. 34th Annu. Conf. IEEE Ind. Electron., Nov. 10–13, 2008, pp. 2684–2689.
[25].Byung-Moon Han, Bo-Hyung Cho, Seung-Ki Sul, Jae-Eon Kim, “Unified Power Quality
Conditioner for Compensating Voltage Interruption,” Journal of Electrical Engineering & Technology, Vol. 1, No. 4, pp. 503-512, 2006 503.
[26].Nazmul Siddique and Hojjat Adeli, “Computational Intelligence: Synergies of Fuzzy
Logic, Neural Networks and Evolutionary Computing,” John Wiley & Sons, 2013.
[27].Ahmed M. A. Haidar, “Computational Intelligence Applications to Power Systems,”
Ahmed M. A. Haidar is currently an Associate Professor with the Universiti Malaysia Sarawak and an Adjunct Associate Professor with the University of Southern Queensland, Australia. He was (2009 - 2015) a member of the academic staff at the University Malaysia Pahang and then, the University of Wollongong, Australia. He worked (1996 – 2005) for the Public Electricity Corporation, Yemen as a Power Grid Control and Maintenance Engineer, and then as the Head of the Transformers Section. His research interests include smart electricity grids, sustainable energy and renewable energy integration, intelligent power system control and optimization, power quality, security, and reliability. He is a Professional Engineer with the Institution of Engineers Australia, and a Senior member of the Institute of Electrical and Electronic Engineers (IEEE).
Benachaiba Chellali is a Professor in Power Engineering. He received the state engineer degree in Electrical Engineering in 1987 from the University of Boumerdes (INH) and the M.S. degree in 1996 from Bechar University Center, Algeria. In 2005, he received the doctorate degree from the University of Sciences and Technology of Oran (USTO), Algeria and currently holding the post of Professor. His current research and teaching interests are in the areas of power quality improvement, active power filters, renewable energy and ICT.
Norhuzaimin Julai received his PhD in Electrical & Electronic Engineering from Newcastle University, UK in 2015. He is with the Faculty of Engineering, Universiti Malaysia Sarawak. His research area of interest is in the soft error in integrated circuit (IC) involving C-Elements.