ResearchOnline@JCU
This file is part of the following work:
Andrade Rodríguez, Natalia Alexandra (2018)
Non-contact competition between
soft and hard corals: a transcriptomic perspective.
PhD Thesis, James Cook
University.
Access to this file is available from:
https://doi.org/10.25903/5bda8f54cf401
Copyright © 2018 Natalia Alexandra Andrade Rodriguez
The author has certified to JCU that they have made a reasonable effort to gain
permission and acknowledge the owners of any third party copyright material
included in this document. If you believe that this is not the case, please email
Non-contact competition between soft and hard
corals: a transcriptomic perspective
Thesis submitted by Natalia Alexandra Andrade Rodríguez
For the degree of Doctor in Philosophy in Coral Reef Studies
College of Public Health, Medical and Veterinary Sciences
ARC Centre of Excellence for Coral Reef Studies
James Cook University
Dedication
I dedicate this thesis to my family and friends.
“L’essentiel est invisible pour les yeux”
Acknowledgements
I would like to start by showing my most profound appreciation to my advisory panel, working
with you has been a fun and enriching journey. I could not have asked for a better team.
David Miller, thank you for your constant support, guidance and trust. I will be forever grateful
to you for coming on board with this project.
Aurélie Moya, my PhD- life would not be possible without your guidance, dedication and care.
Ira Cooke, you are a lifesaver that arrived at a perfect time. Thank you for your infinite patience
when teaching me anything.
Michael Oelgemöller, thank you for your support in the chemistry lab.
I will also like to extend my gratitude to Rhonnda Jones for her help in the statistical analysis
of the polyp activity data.
It has been an honour working with former lab members. Mei Fan and Amin for your advice
and help when needed; Anthony Bertucci, for your support, laughs and the post-doc lectures.
Padma thank you for your guidance in the chemistry lab.
I would also like to extend my thanks to my officemates, past and present: Adrian Arias and
Georgina Gurney, your help and advice have been crucial. Jessica Spijkers, Mbaru Kakunda
and Edmond Sacre, thank you for your patience and kind words on a bad day and the laughs
on the good ones.
This thesis would not be possible without the help of all my field trip volunteers and friends.
Annie Bauer and Michael Civiello, thank you for being always ready to catch me!
Tessa Hill, for your support in the field, in the editing and in life! One of my goals is having
your organisational skills.
Georgina Torras Jorda, I do not know how to express my gratitude enough.
To my Orpheus-family: Jimmy and Mr B, you made my life on the island a happy one.
Marta Espinheira, you get the gold medal for coaching me through my experiments, there is no
Alejandra Gordillo for your help and ideas on figure 5.1.
I owe a great acknowledgement to my PhD cohort:
Dr. Diana Pazminio thank you for being you. You have made this PhD an experience full of
joy and peace.
Dr. Chao-Yang Kuo for being my accomplice, for all those beers, coffees and Tuesday's
specials throughout all these years.
Dr. Alejandra Hernandez, for your joy and the way you make things work.
Dr. Wiebke Wessels, Wiwi for your enormous support! The softie-team will always be with
me =).
Dr. Saskia Jurrians, for opening my eyes to what discipline is, working with you has been
incredibly fulfilling.
Dr. Laura Richardson, it has been a pleasure to be in this with you, thank you for your love and
care.
Dr. Jesse Cheok, I am thrilled that we got to share this experience together. Thank you for all
your encouragement.
I will also like to thank all my friends (including the ones mentioned above =)) for your support,
love and care in good and in bad times: Diego Ortiz, Nicolas Younes, Sandra Infante, Katie
Sambrook, Maria Nayfa, Roger Huerliman, Heather Loxton, Maximillian Hirschfeld, Andrew
Sippel, Sylvain Forêt, Estefanía Erazo, Estefanía Arregui, Alejandra Vargas, Martín Alarcón.
You make me smile with my heart!
I am very grateful to my uncles, aunts and cousins who were always rooting for me.
Finally, I owe my most profound gratitude to my family. To my niece for making me happy no
matter what. To my brother and sister for always showing me the way. To my Dad, for being
my worst critic and my biggest fan, you always make me think bigger. To my Mum for your
unconditional love and encouragement, your example is my guide.
My most special acknowledgement goes to my Grandmother, Mamama. If you hadn’t
introduced me to your friends as “your scientist” after my first week at Uni, I wouldn’t be here.
Statement of contribution of others
Funding of PhD
• '!$&! $&$&!$'&! - - !!* !(&!
01!&!$%!$%#.
Funding of laboratory work
• !!'&- &$ $* %/' %
• '!$&! $&$&!$'&! - - !!* !(&!
01!&!$%!$%#.
• &$!) !$!$&'%
Supervision
• $!.( $-!!'&- &$ $* %-%
!! ($%&*
• $. '$ !*- &$ ! ) !$ !$ &'%- % !!
($%&*
• $.$!!-!!'&- &$ $* %-%!!
($%&*
• $. "$-!! $ -%!! ($%&*
Statistical Support
• #$! ! ! %- (%! ! $!# & - % !!
($%&*
Statement of sources
I certify that the present thesis
Non-contact competition between soft and hard corals: a transcriptomic perspective
is, to the best of my knowledge and belief, original and my own work and has not been
submitted in any form for another degree or diploma at any university or other institution of
tertiary education. Information derived from the published or unpublished work of others has
been acknowledged in the text and a list of references is given.
Abstract
Ecological interactions affect species evolution and, acting in combination with environmental
factors, determine the composition of an ecosystem. In the case of coral reefs, the interactions
of species with the corals (Anthozoa) is essential in shaping the ecosystem. Competition is
particularly intense in coral reef communities because of the limited availability of space where
conditions are appropriate (e.g. depth, substrate, currents) for settlement and growth. Space
limitation makes the interaction between corals an essential element determining coral
assemblages. Competitive interactions are difficult to analyses due to the number and diversity
of factors (e.g. environment, life history, genotype) affecting outcomes. In the case of corals,
research on competitive interactions has mostly focused on visible signs of aggression, such as
measuring the damaged tissue next to a competitor or reporting visual competitive behaviours
(e.g. mesenteric filaments). However, competition (particularly non-contact competition) does
not always lead to visible symptoms, which has led in some cases to the underestimation of the
extent of competitive interactions. For example, many soft corals (Octocorallia) produce
secondary metabolites that may be used to compete for space; the production of secondary
metabolites is unlikely to be visually obvious, and their impact on competitors may be subtle
or cryptic. The outcomes of competitive interactions between individual corals will also be
affected by the health and history of those individuals. For example, individuals that are already
immune-compromised are unlikely to be able to compete as efficiently as healthier individuals.
The immune system is assumed to be a critical component of competitive mechanisms.
Research on coral immunity has focused, with few exceptions, on hard corals (Scleractinia),
very little information being available on soft corals immune systems. The lack of basic
research on soft corals extends to many aspects of their biology, despite the importance and
abundance of these organisms in reef ecosystems. More research on soft corals immunity is
important in order to better understand how these organisms respond to environmental factors
or competition and to better predict the future composition of coral reefs. In this thesis, I have
attempted to advance the knowledge of soft coral biology and non-contact competition between
soft and hard corals. I analysed, at a transcriptomic level, the response of the soft coral
Lobophytum pauciflorum to challenge with the defined immunogen MDP and the effects on
both L. pauciflorum and the hard coral Porites cylindrica (hard corals) when these were in
triggered general stress and immune responses in soft corals, as well as differential expression
of genes likely to function in secondary metabolite production and others genes that may be
involved in tissue remodelling. The transcriptomic response of the hard coral, Porites, on the
other hand, suggested cellular stress combined with resistance and aggressive responses. This
research also highlights the role of the coral nervous system and behaviour in the stress
response, suggesting that neuro-related pathways are closely linked to the immune system.
Similarities between the transcriptomic responses to non-contact competition identified here
and previously reported responses to environmental stressors (e.g. ubiquitination, antioxidant
production), is consistent with the recruitment of common gene repertoires; therefore climate
change is likely to effects competitive interactions in complex ways. Finally, the research
presented in this thesis demonstrates the extent of variation in the responses of individual corals
to stress (immune challenge and competition) and the challenges that this poses particularly for
the investigation of the molecular bases of competition. In the future, individual variation needs
to be better accommodated for molecular investigations into coral research, which means
Table of Contents
Dedication ... i
Acknowledgements ... ii
Statement of contribution of others ... v
Statement of sources ...vi
Abstract ... viii
Table of Contents ... x
List of Tables ... xii
List of Figures ... xv
Chapter 1 - General Introduction ... 18
1.1 Background ... 18
1.2 Thesis structure and objectives ... 23
Chapter 2 - Transcriptomic analysis of Lobophytum pauciflorum under immune challenge .. 24
2.1 Introduction ... 24
2.2 Materials and Methods ... 26
2.3 Results ... 31
2.4 Discussion... 45
Chapter 3 - Transcriptomic analysis of Lobophytum pauciflorum under competition ... 48
3.1 Introduction ... 48
3.2 Materials and methods ... 54
3.3 Results ... 61
3.4 Discussion... 102
Chapter 4 - Transcriptomic analysis of Porites cylindrica under competition ... 107
4.3 Results ... 116
4.4 Discussion... 138
Chapter 5 - General Discussion ... 143
References ... 153
Appendix A: Chapter 2 ... 175
Appendix B: Chapter 3 ... 178
List of Tables
Table 2.1: Lobophytum samples grouped based on PCA results. “ID” corresponds to field and
sequencing labelling of each colony; “Colony” corresponds to the labelling of each colony used
for DESeq analysis and plotting. In the column “Treatment”: “T” represent samples immune
challenged with MDP and “C” control samples that did not receive MDP. “Group” represents
the classification of each colony depending on its behaviour observed in the PCA and “ind.n”
accounts for the colony identity within each one of the groups. ... 30
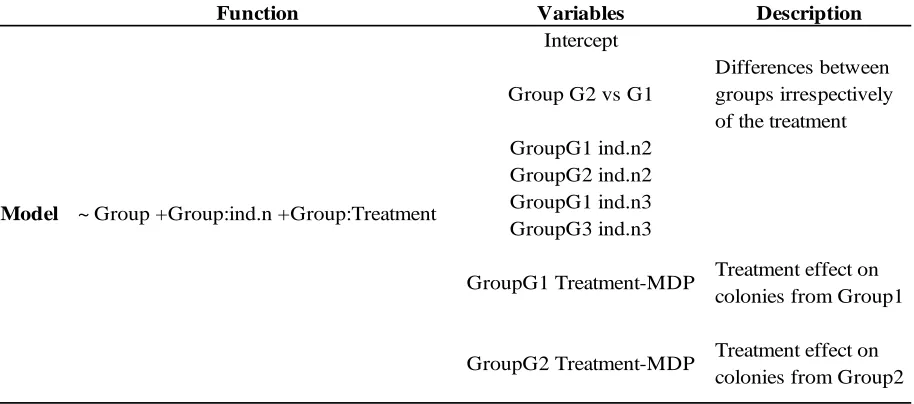
Table 2.2: Model and variables used for gene expression analysis with DESEq2 ... 30
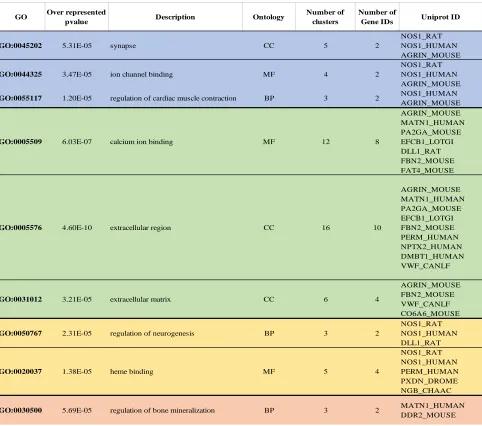
Table 2.3: Nine gene ontology terms overrepresented in DEG found between Group2-MDP
and Group2-control samples. ... 37
Table 2.4: Genes differentially expressed in Group2-MDP. Blue=down-regulated genes and
red=up-regulated genes. ... 40
Table 2.5 Differentially expressed genes in Acropora millepora under MDP treatment that had
homologs amongst the DEG on Lobophytum Group2-MDP. “Protein name Lobophytum”
shows annotation found for the Lobophytum sequence. Blue: in “Fold change A. millepora’
corresponds to genes down-regulated in Weiss et al (2013) and in “Protein name Lobophytum”
represents down-regulates genes in the present experiment. Red= same specification as blue
but genes were up-regulated. ... 44
Table 3.1: Samples of Lobophytum used for gene expression analysis with DESeq2. “Soft
coral” identifies the Lobophytum colony the sample came from, “Hard coral control” shows
which colony of Porites the soft coral sample was interacting with or if it was an isolated
fragment for control. “Pd Other” indicates if the sample was competing with Porites colony Pd
(Pd) or if it was interacting with any other Porites colony or was a control (Other). The column
highlighted in blue corresponded to the variables used to fit model 1 in DESeq2. The column
highlighted in yellow detail the variables used to fit model 2 (see Table 3.2). ... 59
Table 3.2: Models and functions used to find genes differentially expressed in Lobophytum
samples after 30 days of interaction with Porites. ... 60
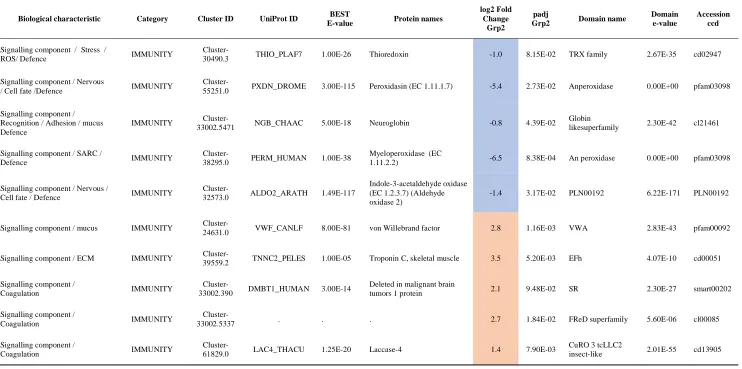
"Biological characteristic" was assigned considering best BLAST hit annotation and the NCBI
domain functions. ... 70
Table 3.4: Genes with potential functions in tissue remodelling. Blue and red indicate genes
down and up-regulated respectively. "Biological characteristic" was assigned considering best
BLAST hit annotation and the NCBI domain functions... 80
Table 3.5: Genes related to secondary metabolite production and transport. Blue and red are
used to indicate genes down and up-regulated respectively. "Biological characteristic" was
assigned considering best BLAST hit annotation and the NCBI domain functions ... 97
Table 4.1: Key used to summarize the three daily observations of polyp activity into a single
activity per day. Variation of polyp activity corresponded to the possible combinations of
activities on a 24h period: open (O), partially open (P), closed (C). ... 111
Table 4.2: Samples of Porites to be used for gene expression analysis with DESeq2. “Hard
coral” denotes the Porites colony the sample came from, “Soft coral control” shows which
colony of Lobophytum the sample was interacting with, “Treatment” indicates if the sample
was competing (T) or was a control (C) and the highlighted column “Hard coral treatment”
corresponds to the variable used to fit the model in DESeq2. ... 114
Table 4.3: Functions to analyse gene expression of Porites under competition using DESeq2.
... 114
Table 4.4 Porites nubbins interacting with Lobophytum that showed a visual aggressive
behaviour. Day of observation shows how long the corals had been interacting before the
behaviour was observed. Day of tissue sampling indicates the day that the nubbins were
collected for genetic analysis. ... 116
Table 4.5: Coefficients for the cumulative link mixed effect model fitted for Porites polyp
activity data. The intercept of the model was: days 0-15, no competition control for Porites and
colony Pd... 119
Table 4.6: Genes differentially expressed in Porites under competition and related with signs
of cellular stress. Blue and red correspond to genes down and up-regulated respectively.
“Biological characteristic” was assigned considering the Best blast hit annotation and the NCBI
domain functions. ... 124
Table 4.7: Genes differentially expressed in Porites under competition and related with coral
characteristic” was assigned considering the Best blast hit annotation and the NCBI domain
functions. ... 129
Table 4.8: Genes differentially expressed in Porites under competition that have been shown
to be differentially expressed in bleached and disease-resistant corals in the literature or that
might have a role in controlling the negative effects of competition. Blue and red text indicate
genes down and up-regulated respectively. “Biological characteristic” was assigned
List of Figures
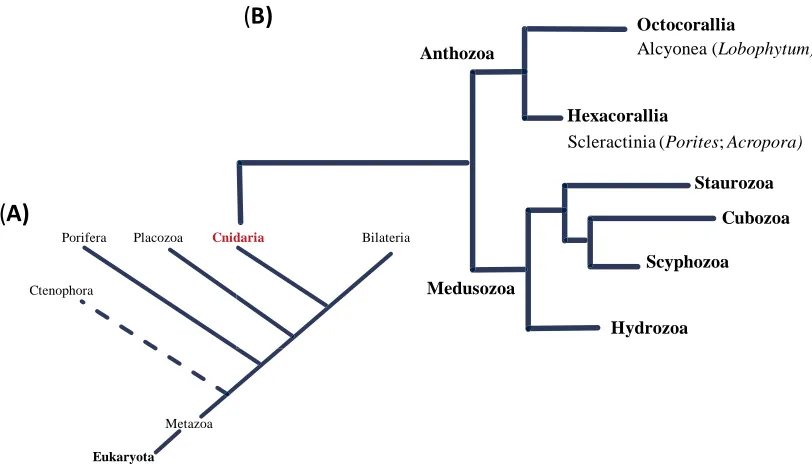
Figure 1.1: Schematic phylogenetic trees showing (A) The position of the phylum Cnidaria in
the kingdom Metazoa and (B) the evolutionary relationship of hard (Scleractinia) and soft
(Alcyonea) corals within Cnidaria (Zapata et al., 2015). ... 19
Figure 2.1: Photograph showing the technique for injection of soft coral fragments (right).
Diagram explaining experimental design, yellow panel corresponds to the time point (one hour
post-injection) analysed in this chapter (left). ... 27
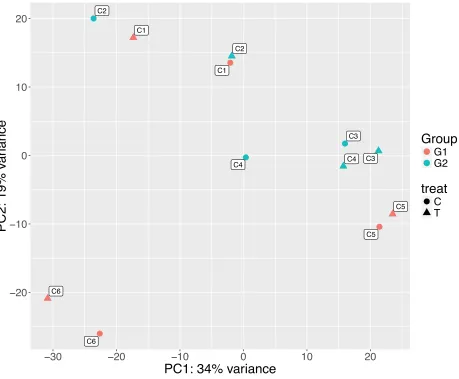
Figure 2.2: Principal component analysis based on normalized, variance stabilized counts for
all Lobophytum samples. Red=colonies from Group1, blue= colonies from Group2, with labels
showing the competing Lobophytum colonies. Circles = control samples, triangle = samples
immune challenged with MDP. ... 33
Figure 2.3: Venn diagram of differentially expressed genes (DEG) in Lobophytum under an
immune challenge. ‘Group1 vs Group2’ corresponds to DEG when comparing Group1 and
Group2 irrespective of treatment. ... 34
Figure 3.1: Example of cytotoxic secondary metabolites from Lobophytum sp. (A) Cembranoid
(Lobophyolide A) extracted from Lobophytum crassum (Lai et al 2017); (B) Sphingolipid
found in Lobophytum sp. (Muralidhar et al 2005). ... 50
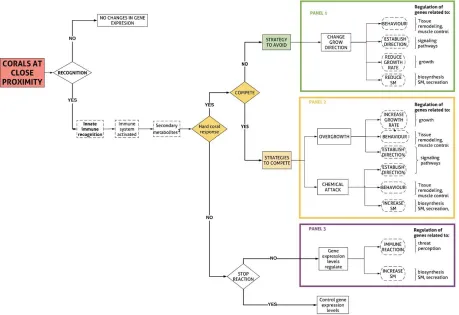
Figure 3.2: Hypothetical steps and cellular responses that a soft coral might experience under
a non-contact competition scenario with a hard coral. Discontinuous lines correspond to
elements that have not been experimentally tested (1Secondary metabolites are constantly
produce but an increase of genes related with vesicle transport and release could be expected).
... 53
Figure 3.3: Coral competition experimental design showing the pair-wise interacting corals and
controls, made with five colonies of Lobophytum and three colonies of Porites. ... 55
Figure 3.4: Common DEG in Lobophytum samples interacting with colony Pd contrasted with
Lobophytum samples interacting with other colonies or in control. ... 63
Figure 3.5: PCA analysis showing the distribution of soft coral colonies based on their gene
expression profiles. The arrows indicate the predominant direction of change between
Figure 3.6: Co-expression network of 339 differentially expressed genes (triangle =padj<0.1;
circles =0.1 <padj<0.5) in Lobophytum-Pd compared Lobophytum-control. Genes up-and
down-regulated in Lobophytum-Pd samples are shown in red and blue respectively. ... 65
Figure 4.1: Hypothetical steps and cellular responses that a hard coral might experience under
a non-contact competition scenario. Discontinuous line corresponds to elements that are not
yet supported by experimental data. ... 109
Figure 4.2: Diagram of the pairwise interacting corals and controls made with three colonies
of Porites (Pd, Pe and Pf) and five colonies of Lobophytum (La, Lb, Lc, Ld, Le). ... 110
Figure 4.3: Aggressive behaviour of Porites towards Lobophytum. (A) Lobophytum (left) being
attacked by mesenteric filaments of Porites (right). (B) Base elongated polyps from the hard
coral interacting with Lobophytum. ... 117
Figure 4.4: Mosaic plot showing the proportion of open (O, green), partially open (P, red) and
closed (C, black) nubbins of Porites in control condition –no competition (A) and in
competition with L. pauciflorum (B) over duration of the experiment. Polyp activity is shown
as a proportion of observations within a given time period (x axis). Changes in bar width at day
30 represents a reduction in the number of samples (n) due to sampling at day 30, n=36 (days
0-30), n=15 (days 31-60). ... 118
Figure 4.5: Mosaic plot showing the proportion of open (O, green), partially open (P, red) and
closed (C, black) nubbins of Porites colonies in control condition –no competition (left panels)
and in competition with Lobophytum (right panels) over the duration of the experiment. Polyp
activity is shown as a proportion of observations within a given time period (x axis). Changes
in bar width at day 30 represents a reduction in the number of samples (n) due to sampling at
day 30. n=36 (days 0-30), n=15 (days 31-60). ... 120
Figure 4.6: Principal component analysis based on normalized, variance stabilized counts for
all samples. C=no-competition control, T=competition treatment of Porites interacting with
Lobophytum, with labels showing the competing Lobophytum colony. Circles = Porites colony
Pd, triangle = Porites colony Pf. ... 122
Figure 5.1: Hypothetical succession of cellular events that occurred during the 30 days of
interaction between Lobophytum and Porites based on gene expression analyses described in
(respectively) in Porites or Lobophytum under non-contact competition compared to control.
Chapter 1 -
General Introduction
1.1Background
Coral reef ecosystems are highly important for human wellbeing and prosperity; activities
related to the Great Barrier Reef (Australia), for example, contribute more than 5 billion dollars
per year to the Australian economy (Day and Dobbs, 2013). Reefs all over the world are the
main source of revenue and food for many communities (Hicks and Cinner, 2014). Therefore
the collapse of these ecosystems would bring catastrophic human and economic consequences
(Hughes et al., 2017a).
The recent series of bleaching events (2015 and 2016) and the associated loss of hundreds of
square kilometres of coral reef highlight the importance to preserve the reefs that are left and
that there is an urgent need to mitigate human impacts on them (Hughes et al., 2017b). Research
on coral reef ecosystem functions is necessary to understand future scenarios. However,
ecosystem-scale research needs to be combined with empirical and molecular investigations of
coral biology to fully understand the potential of corals and reef fishes to adapt to future
environmental conditions.
Cnidarians from the class Anthozoa, including Hexacorallia (hard corals and anemones) and
Octocorallia (soft corals and gorgonians), are responsible for much of the complexity of reef
ecosystems, but these are also amongst the simplest animals (Figure 1.1). Members of the
hexacorallian order, Scleractinia (Bourne, 1900) are often referred to as hard corals or
reef-building corals as the aragonite skeletons that they deposit create much of the structure of the
reef (Graham and Nash, 2013). Shapes and sizes of the different hard coral species are the most
obvious factor determining the structural complexity of a particular reef and much of the
research effort on reef structure so far has focussed on this group (Alvarez-Filip Lorenzo et al.,
2011; Coker et al., 2014; Graham and Nash, 2013; Jones et al., 1994). Octocorallia, on the other
hand, have received much less attention in this respect despite the evidence that they not only
contribute to reef structural complexity (Richardson et al., 2017a), but also to habit diversity –
for example, by providing habitat and refuge to many species of reef fish (Ferrari, 2017; Jeng
Figure 1.1: Schematic phylogenetic trees showing (A) The position of the phylum Cnidaria in the kingdom Metazoa and (B) the evolutionary relationship of hard (Scleractinia) and soft
(Alcyonea) corals within Cnidaria (Zapata et al., 2015).
Much of the focus of molecular studies on octocorals have principally focused on two areas of
research: (1) the use of molecular phylogenetics to resolve taxonomic uncertainties (McFadden
et al., 2010) and, (2) drug discovery – the search for pharmacologically relevant secondary
metabolites (Chapter 3, Introduction). However, we are still very far from getting a full
understanding of octocorals’ ecology and biology. For example; little is known about the
effects of stressors on soft corals and molecular mechanisms by which they respond (Fabricius,
1999). The few recent studies that are available provide some insights into the molecular
defence mechanisms of octocorals. These include the transcriptomic response of the gorgonian
Gorgonia ventolina to a natural parasite (Burge et al., 2013); the effects of environmental stressors on immune responses in the same organism (Mann, 2014) and lesion healing
following artificial wounding in two gorgonians (Shirur et al., 2016). More information about
immunology research in soft corals is provided in chapter 2.
Soft corals are often considered to be relatively resistant organisms due to their high growth
rate and ability to colonise areas where hard corals have been decimated by Acanthaster planci
(crown-of-thorns starfish) outbreaks or other catastrophic events, such as cyclone damage
(Fabricius, 1997). For these reasons, soft corals have sometimes been described in the literature
as better competitors for space than are hard corals (Alino et al., 1992). However, the ability
Eukaryota Metazoa Ctenophora
Porifera Placozoa Cnidariadaria BilateriaBilateria
Alcyonea (Lobophytum)
Octocorallia
Hexacorallia
Scleractinia (Porites; Acropora)
Staurozoa Cubozoa
Scyphozoa Medusozoa
Hydrozoa Anthozoa
[image:21.595.81.487.77.310.2]
of soft corals to opportunistically occupy space provides only limited support for the idea that
they will do far better than other cnidarians in the long term under increasingly severe
environmental conditions (Fabricius, 1999, 1997). In fact, in the mass bleaching events of 2015
and 2016, high mortality was observed on soft coral dominated reefs (Hughes et al., 2017b;
Richardson et al., 2018). Additionally, we have only a very limited understanding of how hard
and soft corals interact, so it would be premature to speculate as to whether one group of corals
has a significant advantage over the other.
1.1.1Interactions between soft and hard corals
Competition for space is a major ecological pressure that shapes ecosystems like coral reefs.
Significant factors in determining the outcome of a competitive interaction are biological
characteristics that have been established over evolutionary time, effectively resulting in a
natural hierarchy amongst species (Abelson and Loya, 1999; Chadwick and Morrow, 2011;
Crowley et al., 2005). Nevertheless, it is the fitness of an individual organism that determines
the outcome of a competitive scenario. For example, an individual whose fitness is already
challenged because of a disease or another external stressor will be less likely to win a
competitive encounter than would be a healthier individual of the same species. Additionally,
the competitiveness of individuals within a species will vary with genotypic diversity (Elliott
et al., 2016; Mitarai et al., 2014).
The variability of environmental or genotypic factors that could affect competitive outcomes
makes it difficult to predict how anthropogenic stressors such as climate change are likely to
compromise the capacity of an organism to compete (Evensen and Edmunds, 2016; Horwitz et
al., 2017; Inoue et al., 2013). Using a reductionist approach to investigate the cellular processes
that corals activate while competing for space is an essential first step in understanding how
additional stressors might affect competitive outcomes (Horwitz et al., 2017).
Since corals are sessile organisms, they compete with each other for the limited space with
appropriate light, substrate and current conditions that they need to grow and reproduce
(Connell et al., 2004; Gambrel and Lasker, 2016). In the evolutionary history, corals have
acquired a diverse range of efficient competitive strategies. At least four distinct competitive
strategies have been identified (reviewed by Lang and Chornesky 1990 and Chardwick and
polyps to enable tentacle contact with competing organisms followed by discharging of
nematocysts and/or (4) development of sweeper tentacles to again enable nematocyst discharge
(Chadwick and Morrow, 2011; Lang and Chornesky, 1990).
Soft corals can overtop other corals (Alino et al., 1992) in order to compete for space, and there
have been reports of sweeper tentacles in gorgonians (Sebens and Miles, 1988). One particular
characteristic of octocorals is the production of a diverse range of toxic chemicals or secondary
metabolites that accumulate in their tissues, and when in contact with other colonies these
compounds can cause tissue necrosis to their neighbours (Coll and Sammarco, 1983;
Sammarco and Coll, 1992; Sammarco et al., 1983). Some soft corals can release those toxins
into the water column to damage a distant enemy or to increase the tissue area affected by their
chemicals (Sammarco et al., 1983). The strategy of using toxic chemicals to compete is known
as allelopathy (Chadwick and Morrow, 2011; Coll et al., 1985).
Although competition clearly occurs between corals that are not in contact, research on
competitive strategies in corals has overwhelmingly focussed on interactions that involve
contact (Chornesky, 1983; Fleury et al., 2004; Sebens and Miles, 1988; Shearer et al., 2012;
Tanner, 1995). Physical contact with a foreign tissue results in activation of the innate immune
system of the coral, involving self- vs non-self-recognition (Frank et al., 1996; Hennessey and
Sammarco, 2014; Hildemann et al., 1977). In a non-contact scenario, however, it is necessary
to consider how the interacting organisms recognise the potential threat. Soft corals are an
interesting group in which to study non-contact competition because they may react to the
presence of another coral by releasing toxic chemicals to overcome the distance barrier. Note,
however, that research on non-contact competition in soft corals has mainly focused on
quantifying the effect of competition rather than understanding how and why the competition
was triggered (Aceret et al., 1995; Coll and Sammarco, 1983; La Bare et al., 1986; Maida et
al., 1995; Sammarco et al., 1983). Investigating the mechanisms used by corals to identify
potential threats and competitors at a distance should, therefore, be a research priority.
Hypothetical schemes for how such interactions might occur between soft and hard corals are
explored in chapters 3 and 4 respectively.
In the work described in the following chapters, transcriptomics was used to investigate the
cellular mechanisms involved in the responses of both soft and hard corals to non-contact
to immune challenge. Lobophytum pauciflorum (Lobophytum; Ehrenberg, 1834) was used as a
representative of soft corals in these investigations (Figure 1.2). Lobophytum is widely
distributed throughout the Indo-West Pacific in shallow waters and is particularly abundant at
specific sites on the Great Barrier Reef (Benayahu, 2002; Tursch and Tursch, 1982). The
genome of Lobophytum pauciflorum has been sequenced by collaborators and was available
for this study, facilitating the process of transcriptome annotation (unpublish). Additionally, it
has been reported that Lobophytum pauciflorum can affect potential competitors, including
Porites cylindrica, at a distance (Sammarco et al., 1983); making this pair of species a
particularly attractive system in which to study non-contact competition. The hard coral Porites
cylindrica (Porites, Dana 1846) is relatively common on the Great Barrier Reef and other Pacific reefs (Dizon and Yap, 2005; Jompa and McCook, 2002; Palmer et al., 2011). Several
competition studies using Porites provide a baseline of the behaviour and potential competitive
outcomes (Aceret et al., 1995; Coll and Sammarco, 1983; Rinkevich and Sakamaki, 2001;
Sammarco et al., 1985).
Transcriptomics analysis has been used in this thesis across all data chapters as a tool to
understand the differences in gene expression between control and treatment samples.
Next-generation sequencing technologies allow obtaining information about the behaviour of
hundreds of thousands of genes due to a specific treatment on a particular time-point. This
large-scale data serve to analyse the cellular response of non-model organisms like corals on a
transcriptomic level. Transcriptomics has been used to understand the corals’ response to
stressors like an infection (Burge et al., 2013; Mohamed et al., 2018) and environmental
stressors (Bellantuono et al., 2012; Oakley et al., 2017). These transcriptomic studies have
demonstrated the power transcriptome-wide gene expression analysis in identifying the cellular
pathways and specific genes that corals might be using to react to the stressor. Other methods
like microarray (Shearer et al., 2012) have been used to characterise the response of the hard
coral Acropora millepora to contact competition with algae; the limitations that this type of
technic presented is that only targeted genes are analysed. Conversely, transcriptomics allows
unbiased analysis of genes affected by a stressor; such broad analysis allow identification of
1.2
Thesis structure and objectives
The primary goal of this thesis was to advance knowledge on the soft coral biology and improve
our understanding of non-contact coral competition using transcriptomics analysis as a tool.
The thesis comprises five chapters: a general introduction (this chapter); three data chapters
(Chapter 2, 3 and 4) and a general discussion (Chapter 5). The three data chapters are intended
for publication in peer-reviewed journals after format modification.
The objectives of Chapter 2 were to investigate differential gene expression in Lobophytum
following challenge with a defined immunogen and to compare those results with the ones
obtained in Acropora millepora challenged with the same immunogen (Weiss et al., 2013).
This was achieved by challenging fragments of Lobophytum with highly purified muramyl
dipeptide (MDP), a bacterial cell wall derivative (immunogen). David Miller, Aurélie Moya
and I developed the experimental design. I performed the experiment and Aurélie contributed
to laboratory analysis. Ira Cooke and I analysed the data. We all contributed to the data
interpretation.
The objective of Chapter 3 was to determine the transcriptomic response of Lobophytum to
non-contact competition with Porites. A non-contact competition experiment was set up to
simulate a competitive scenario; tissue samples were taken for transcriptomics analysis.
David Miller, Aurélie Moya and I developed the experimental design. I performed the
experiment and Aurélie contributed to the tissue sampling and laboratory analysis. Ira Cooke
and I analysed the data. We all contributed to the data interpretation.
Chapter 4 is essentially an investigation of the other side of the Lobophytum/Porites interaction,
focusing this time on the hard coral. The objective of chapter 4 was to improve our
understanding of the molecular mechanisms by which Porites reacts to non-contact
competition. The same experimental approach as we used in the previous chapter was applied
here. Ira Cooke and I analysed the data, and we all contributed to the data interpretation.
Chapter 2 -
Transcriptomic analysis of Lobophytum pauciflorum
under immune challenge
2.1
Introduction
The immune system (IS) is crucially important to animal health. Vital animal traits such as
growth, reproduction and survival, rely on the correct functioning of this system. An unhealthy
animal will be more susceptible to predators, for example, or might not be strong enough to
fight a competitor for space or mating (Vollmer and Kline, 2008; Wright et al., 2017).
Immunity contributes to an organism’s health by acting against pathogens; although many
studies also suggest that the central role of this system is to control the “healthy” microbiome
community associated with each species (Bosch, 2014).
In the face of climate change, understanding immunity in cnidarians is increasingly important
to predict coral reef resilience and resistance in response to pathogens and anthropogenic
stressors (Mydlarz et al., 2010; Pinzón et al., 2015; Reed et al., 2010). Rising ocean
temperatures and ocean acidification put corals under physiological stress making them
susceptible to infections that might be lethal (Bruno et al., 2007). As mentioned in the previous
chapter, octocorals (soft corals) are an essential component of the reef community, providing
food and habitat for many fishes. However, most of the studies on coral disease and bleaching
have focused on scleractinian corals or anemones, with comparatively little attention given to
soft corals despite their ecological importance (Shirur et al., 2016).
Transcriptomic analysis has been used in recent years to characterise the coral innate immune
repertoire, and these studies have provided insights into the evolutionary origins and functions
of the IS. Miller et al. (2007) and Mydlarz et al. (2016) reviewed immunity in cnidarians,
summarising the various gene families shared and likely common cellular mechanisms with
vertebrates and mammals, such as the nucleotide-binding oligomerisation (NOD)-like receptor
(NLR) and Toll-like receptor (TLR) signalling pathway components. Some vertebrate immune
gene families, absent in model organisms like Drosophila and Caenorhabditis elegans, are
present in the hard coral Acropora millepora (Weiss et al., 2013). This fact enhances the
importance of coral research to better understand immunity in higher animals.
G. ventalina shared many homologous genes and immune signalling pathways with scleractinian corals. For example, the immune challenge to the octocoral stimulated the
expression of likely immune receptor pattern recognition molecules (e.g. tachylectin-5A) and
immune effectors including candidate antimicrobial peptides (e.g. a homolog of arenicin) that
have also been found in the immune responses of other cnidarians (Burge et al., 2013).
Conversely, some differences were observed between the octocoral and hexacoral responses.
For example, G. ventalina under parasitic infection up-regulated metabolic processes such as
cellular respiration, while Weiss et al. (2013) suggested that A. millepora was suppressing
metabolism under immune challenge. This and other differences between soft and hard coral
responses to immune challenge highlight the importance of further investigation of soft coral
immunity.
While the work of Burge et al. (2013) on G. ventalina essentially sets a baseline for further
investigation on soft coral immunity, there are limits or caveats to what can be learnt about
immunity by characterising the host response to a parasite. One important consideration is that
the pathogen might be reacting to the host defence mechanisms, altering the host's general
immune response (Norris and Evans, 2000). Since this kind of alteration is specific to the
host-pathogen relationship, it limits our conclusions about the soft coral immune response to
bacterial pathogens or response to symbiotic bacteria.
The coral immune system presumably detects pathogens via receptors that will be activated by
specific molecules associated with bacteria (Miller et al., 2007). Pathogen-associated
molecular patterns (PAMPs) are molecules present in the cell walls and/or membranes of
Gram-negative or/and Gram-positive bacteria that are detected by the host receptors, activating
an immune response. The use of purified PAMPs to immune challenge corals is a technique to
examine a specific aspect of the host response, whereas during challenge with whole bacteria
or pathogens the response will be directed to a diverse and undefined range of molecules
(Girardin et al., 2003).
Muramyl dipeptide (MDP) is a PAMP present in Gram-positive and Gram-negative bacteria
that has been found to activate the NLR signalling pathway in mammalian cells (Girardin et
al., 2003). Weiss et al. (2013) used MDP to immune challenge Acropora millepora nubbins.
Their findings showed that MDP stimulation of A. millepora caused up-regulation of some
immune-related genes one hour after injection and demonstrated the common involvement of
This study aims to break the knowledge imbalance between soft and hard corals, as well as improve the understanding of the similarities and differences of the immune system across the phylum Cnidaria. To archive these aims the specific objectives included : (1) to characterise the early immune response of Lobophytum pauciflorum (soft coral) to PAMPs and (2) to
replicate the Weiss et al. (2013) experiment on L.pauciflorum in an attempt to compare early
immune responses of hard and soft corals.
2.2
Materials and Methods
2.2.1Sample collection and experimental design
Six colonies of the soft coral Lobophytum pauciflorum (Lobophytum) were collected in the
reefs around Orpheus Island (18’34’ S;146’29’E) and transported to Orpheus Island Research Station (OIRS) for fragmentation (GBRMPA Permit No. G16/38499.1). Each colony was divided into 18 pieces of approximately five centimetres in length obtaining a total of 108 fragments of Lobophytum. These soft coral fragments (lobes) were then placed into 36
individual tanks for three weeks to recover from the collection. Each tank had a volume of 1.5L and held three fragments from the same colony.
After the three-week recovery period, the lobes were subjected to the immune challenge experiment. Lobes were either injected with 200ml of a solution of the immunogen muramyl dipeptide (MDP, InvivoGen; Cat# tlrl-mdp) in PBS (immune challenge fragments) or with PBS only (control). The immunogen was prepared at a concentration of 10μl/ml as described in Weiss et al. 2013. Fragments were injected on the top of the lobe, as shown in Figure 2.1. This technique was first tested by injecting cooking dye into spare coral fragments to visualise the spread of dye into the soft coral tissue. During the injection process water flow and air bubbling supply was stopped for all tanks to facilitate manipulation of the lobes and to maximise the time of MDP exposure in case the solution injected was expelled. After all fragments were injected, air bubbling was renewed, and the water temperature was controlled by keeping the tanks on a bain-marie with high water flow.
-80 °C until processed for further analysis. In total three technical replicates of six biological
replicates were sampled per time point.
Figure 2.1: Photograph showing the technique for injection of soft coral fragments (right). Diagram explaining experimental design, yellow panel corresponds to the time point (one hour post-injection) analysed in this chapter (left).
2.2.2RNA extraction, library preparation and sequencing
Previous observations of A. millepora immune challenge with MDP by Weiss et al. (2013)
showed that the hard coral reacted at a gene expression level to the treatment one-hour
post-injection. Lobophytum samples that were exposed for an hour to the immune challenge were
therefore chosen for RNA extraction, sequencing, and analysis. A total of six immune
challenged and six control samples were crushed using a hydraulic press in liquid nitrogen.
The RNA extraction was performed from the tissue powder with TRIzol Reagent (Ambion,
catalogue Number 15596-026) following the supplier protocol (Chomczynski and Sacchi,
[image:29.595.74.552.194.463.2]The quality of the RNA extraction was assessed with the Agilent Tapestation with RNA ScreenTapes, and the concentrations of each extraction were normalised to 80ng in 12.5 μl of miliQ water. Library preparation was done using an Illumina NeoPrep machine with a TruSeq Stranded mRNA Library Prep for NeoPrep kit and yields were verified on the Tapestation using D5000 ScreenTapes. Final library concentrations were set to 15nM in 25 μl and sent to the Australian Genomic Research Foundation (AGRF) for paired-end sequencing on a HiSeq2500 Illumina machine with a target sequencing volume of approximately 20 million reads per sample.
2.2.3Transcriptome analysis
Reads from each sample were corrected for random sequencing errors using the software Rcorrector (Song and Florea, 2015). Sequences were then mapped against the Lobophytum
pauciflorum transcriptome assembled for Chapter 3. Details of the quality of the assembly and
annotation methods are provided in Chapter 3. Bowtie2 version 2.2.4 (Langmead & Salzberg, 2012) was used to map the reads from immune challenged and control samples against the available transcriptome. The mapping used recommended settings (end to end alignments, report all alignments, minimum alignment score 0.3) to suit downstream quantification and clustering with Corset version1.05 (Davidson & Oshlack, 2014).
2.2.4Gene expression analysis
Reads mapped with Bowtie2 (including multi-mapping reads) were analysed with the software Corset to cluster transcripts and aggregate read counts for each cluster. An annotation score based on the length and the information available for each transcript was used to choose one transcript per cluster to transfer annotations from transcripts to clusters.
The package DESeq2 (Love et al., 2014), run in the R software version 3.3.0 (R Core Team, 2016), was used to normalise read counts between samples and to perform differential expression analysis on the basis of cluster counts obtained with Corset.
obtained by examining differences between treated/untreated samples for the same colony, and
observing the distribution pattern that the samples had in the PCA. These observations seemed
to divide the colonies into two consistent groups. These groups were used to create a factor
“Group” to model accounting for different gene expression responses to MDP between groups.
Full details of this model are provided in Table 2.2.
Results were then interpreted by extracting differentially expressed genes for specific model
terms as follows. Results from “Group1-MDP” factor corresponded to differentially expressed
genes (DEG) found in the contrast analysis between samples of Group 1 treated with MDP
(Group1-MDP) when compared to control sample from Group1 (Group1-control). Similarly,
the model factor “Group2-MDP” represented the DEG when contrasting Group 2 samples
treated with MDP (Group2-MDP) to control samples from Group 2 (Group2-control). The
factor “Group1 vs Group2” corresponded to the DEG when comparing samples from Group1
to Group2 irrespectively from the treatment (Table 2.1).
Adjusted p-values (padj) for differential gene expression were obtained using the Benjamini
Hochberg procedure for multiple testing correction. Power to detect differentially expressed
genes was optimised using independent filtering based on the mean of normalised counts as a
filter statistic. The padj threshold recommended by DESeq2 and use for this study was of 0.1
(Love et al., 2014). It is relevant to mention that this is a discovery study where interpretations
are not based on individual genes, but instead, on patterns across multiple related genes. Under
these circumstances, a small number of false positives is unlikely to distort the overall
conclusions. The DEG found in the model factor “Group2-MDP” were used for the analysis to
infer gene function because samples of Group 2 were behaving more consistently in the PCA
Table 2.1: Lobophytum samples grouped based on PCA results. “ID” corresponds to field and sequencing labelling of each colony; “Colony” corresponds to the labelling of each colony used for DESeq analysis and plotting. In the column “Treatment”: “T” represent samples immune challenged with MDP and “C” control samples that did not receive MDP. “Group” represents the classification of each colony depending on its behaviour observed in the PCA and “ind.n” accounts for the colony identity within each one of the groups.
Table 2.2: Model and variables used for gene expression analysis with DESEq2
Function Variables Description
Intercept
Group G2 vs G1
Differences between groups irrespectively of the treatment GroupG1 ind.n2
GroupG2 ind.n2 GroupG1 ind.n3 GroupG3 ind.n3
GroupG1 Treatment-MDP Treatment effect on colonies from Group1
GroupG2 Treatment-MDP Treatment effect on colonies from Group2
2.2.5Analysis to infer gene function
The R package “GOSeq” was used to perform an enrichment analysis to determine whether
differentially expressed genes involved in specific cellular processes, biological components
and molecular functions were overrepresented based on the Gene ontology terms (GO-terms)
of the annotated clusters (Young et al., 2010).
Genes found to be differentially expressed between Group2-MDP and Group2-control samples
were manually classified into four categories: 1. Immune-related genes, 2. Neuro-related genes,
3. Extracellular matrix(ECM)-related genes and 4. Transcription-related genes. The gene
categorisation was based on literature review of the gene function, GO-terms, best BLAST hit,
protein domains and KEGG (Kyoto Encyclopaedia of Genes and Genomes) Orthology
corresponding to the gene annotation for each cluster (See Chapter 3 for details of the
transcriptome annotation process).
The 52 DEG identified by Weiss et al. (2013) in A. millepora when treated with MDP were
BLAST searched (E-value<10-5) against the genes differentially expressed in Lobophytum
(Group2-MDP) using the program Geneious v. 9.1.5 (Kearse et al., 2012). This analysis aimed
to compare the gene expression profile of soft and hard corals in response to MDP challenge.
2.3
Results
2.3.1RNA analysis, sequencing and transcriptome analysis
Five out of six colonies of Lobophytum recovered from the fragmentation stress. One-third of
soft coral fragments from colony C6 died due to unknown reasons. Nevertheless, there were
enough healthy lobes from all the colonies (including C6) to run the experiment and get tissue
samples for the first two time points: 1hr post-injection and 6hr post-injection. The mortality
of colony C6 did not affect the results discussed here because only samples for time point one
were analysed in this chapter.
RNA extraction and library preparation from samples collected an hour post-injection was
carried out successfully. Sequencing of the twelve samples yielded approximately 750 million
paired-end reads (~50 million pairs per sample). The mapping rate of the corrected reads to the
transcriptome assembly generated as described in Chapter 3 was ~ 55%. Approximately 56%
associated gene ontology terms. Finally, use of the Corset software produced 107,087 clusters
that were analysed to identify differentially expressed genes.
2.3.2Gene expression analysis
The exploratory PCA analysis shows that the principal component (PC) 1 explains 34% of the
variance between samples, while the PC2 explains 19% of the variance (Figure 2.2). The PCA
analysis did not resolve samples into control and treatment groups; rather, for each colony,
controls were directed on an angle to the corresponding treatments. Samples grouping by
colony in transcriptomic analysis have frequently been observed in hard coral studies,
illustrating the high colony variability within species regardless of the treatment (Aguilar et al.,
2017; Bertucci et al., 2015). In this PCA plot, two groupings were apparent; colonies C1, C5
and C6 formed one group (Group1) and colonies C2, C3 and C4 the second (Group 2). These
two groups differed in the direction of change between treatment and control in the PCA plot;
in Group 1, Lobophytum samples treated with MDP were situated above the corresponding
colony control sample, whereas the opposite direction of change was observed for colonies in
Group 2 (Figure 2.2, Table 2.1). It is important to note that in Group 1 colony C5 is following
the same directions on the PC2 axes than the other colonies in this group; but in PC1, it is
situated to the right of the control and not to the left like the rest of the group members. Possibly
meaning that this particular colony might be regulating some genes differently than the rest of
Figure 2.2: Principal component analysis based on normalized, variance stabilized counts for all
Lobophytum samples. Red=colonies from Group1, blue= colonies from Group2, with labels
showing the competing Lobophytum colonies. Circles = control samples, triangle = samples
immune challenged with MDP.
Group 1 and Group 2 were used to define the “Group” variable for DESeq2 analysis (Table
2.1), specifying in the model the variation of responses between the sets of samples.
The DESeq2 analysis found that a total of 78 genes were responsible for the differences
between Groups 1 and 2, irrespective of treatment. Only two genes were differentially
expressed when comparing Group1-MDP to Group1-control. Conversely, 75 genes were
differentially expressed between Group2-MDP and Group2-control (Figure 2.3).
C1 C1
C5 C5
C6 C6
C2
C2
C3
C3
C4 C4
−20
−10 0 10 20
−30 −20 −10 0 10 20
PC1: 34% variance
PC2: 19% v
a
riance Group
G1 G2
treat
C
[image:35.595.80.539.127.506.2]A total of 41 genes explained the difference between groups irrespective of treatment and were
also responsible for the variation between treatment and control for samples in Group 2
(Group2-MDP vs Group2-control; Figure 2.3). The overlap in Figure 2.3 was expected because
the grouping was based on the differences observed in the PCA between the two set of samples
in terms of how they responded to the treatment (Figure 2.2).
Figure 2.3: Venn diagram of differentially expressed genes (DEG) in Lobophytum under an immune challenge. ‘Group1 vs Group2’ corresponds to DEG when comparing Group1 and Group2 irrespective of treatment.
The colony grouping performed based on the PCA results helped to find the genes responsible
for the variations between Group2-MDP and Group2-control. Close examination of the PCA
plot shows that the direction of change between controls and treatments was far more consistent
for Group 2 than for Group 1. This explains why very few genes (two) were found to be
differentially expressed between treatments and controls for Group 1, whereas 75 DEG were
[image:36.595.79.537.243.518.2]limited statistical support, data not shown). This opposite response suggests that DEG in
Group2-MDP might also contribute to the differences seen in the PCA analysis between
Group1-MDP and Group1-control samples, but that in general colonies from Group1 had
inconsistent gene expression profiles (different genes up or down-regulated).
2.3.3Analysis to infer gene function 2.3.3.1Ontology enrichment analysis
Enrichment analysis of the genes differentially expressed between MDP and
Group2-control identified nine gene ontology terms (GO-terms) that were overrepresented with at least
three UniProt IDs per term (Table 2.3).
Four clusters that were down-regulated in the Group2-MDP treatment relative to controls were
annotated as homologs of nitric oxide synthase (NOS; Cluster-32814.5; Cluster-56627.2) and
agrin (Cluster-61500.0, Cluster-60630.0), and these were responsible for the enrichment of the
GO-terms “synapse [GO:0045202]”, “ion binding [GO:0044325]” and “regulation of cardiac
muscle contraction [GO:0055117]”.
NOS is an oxidoreductase responsible for the production of nitric oxide (NO) from arginine.
Nitric oxide is an important signalling molecule involved in various cellular processes such as
immune defence and nervous transmission (Colasanti et al., 2010). In Lobophytum
pauciflorum, NOS has been localised predominantly in the gastroderm (i.e. endoderm) (Safavi-Hemami et al., 2010) rather than the ectoderm (as might be expected in the case of a nervous
system function). Safavi-Hemami et al. (2010) suggest that NO signalling is unlikely to be
involved in a nervous reaction in this soft coral (Safavi-Hemami et al., 2010).
Conversely, studies in other cnidarians suggest functions in the nervous system; NO
stimulation caused tentacle retraction in Aiptasia pallida (Salleo et al., 1996), feeding
behaviour in Hydra vulgaris (Colasanti et al., 1997) and peristaltic activity in the sea pansy
Renilla koellikeri (Anctil et al., 2005).
There also appears to be a positive correlation between NOS activity (and NO concentration)
with bleaching (Trapido-Rosenthal et al., 2001) and, on this basis, it has been suggested that
under stress (e.g. heat stress) the host might increase the activity of NOS, resulting in higher
NO levels and thus triggering the disruption of symbiosis (bleaching) (Perez and Weis, 2006;
other genes related to redox activity and nervous responses were annotated under the
enrichment terms “regulation of neurogenesis [GO:0050767]” and “heme binding
[GO:0020037] “. Heme binding is important for cellular oxidant metabolism due to its
relationship with iron cycling and is essential for detoxification (Table 2.3). Most of the
clusters in this group were down-regulated in MDP when compared with
Group2-control.
Agrin homologs and another seven genes down-regulated in response to treatment (Table 2.3),
had the associated GO-terms: “calcium ion binding [GO:0005509]”; “extracellular region
[GO:0005576]” and “extracellular matrix [GO:0005576]”. Amongst these seven genes were
three extracellular matrix (ECM) constituents involved in cell-cell communication (agrin,
collagen alpha-6(VI) and a cartilage matrix protein; Table 2.3). Several other genes implicated
in immune defence and nervous responses, including myeloperoxidase (MPO), phospholipase
A2 (PLA2) and the neural pentaxin-2 (NPTX2), were also down-regulated upon
MDP-challenge (Table 2.3). Conversely, Lobophytum homologs of five other genes IDs annotated
with these same GO-terms (“GO:0005509”; “GO:0005576” and “GO:0005576”) were
up-regulated in Grp2-MDP relative to controls. The up-up-regulated clusters corresponded to genes
potentially involved in mucus production like deleted in malignant brain tumour 1 (dmbt1) and
the von Willebrand factor (vWF); or in cell adhesion and recognition (fibrillin-2 and
protocadherin Fat 4, respectively). Finally, homologs of the cartilage matrix protein
(Matrilin-1) and to a discoidin domain receptor 2 were down-regulated in Lobophytum from
Group2-MDP . These genes were annotated with the GO-term “regulation of bone mineralisation
Table 2.3: Nine gene ontology terms overrepresented in DEG found between Group2-MDP and Group2-control samples.
2.3.3.2Manual gene categorization
The GO-term enrichment analysis (Table 2.3) provides an overview of the biological processes,
cellular components and molecular functions that were overrepresented in the set of DEG.
Nevertheless, manual classification and annotation of the DEG revealed more details about the
reaction of Lobophytum samples from Group-2 to treatment (Table 2.4). As mentioned
previously, four categories of genes can be identified in this dataset: 1. Immune-related genes,
2. Neuro-related genes, 3. ECM-related genes and 4. Transcription-related genes. These
categories are explored in more detail below.
GO Over represented
pvalue Description Ontology
Number of clusters
Number of
Gene IDs Uniprot ID
GO:0045202 5.31E-05 synapse CC 5 2
NOS1_RAT NOS1_HUMAN AGRIN_MOUSE
GO:0044325 3.47E-05 ion channel binding MF 4 2
NOS1_RAT NOS1_HUMAN AGRIN_MOUSE
GO:0055117 1.20E-05 regulation of cardiac muscle contraction BP 3 2 NOS1_HUMAN AGRIN_MOUSE
GO:0005509 6.03E-07 calcium ion binding MF 12 8
AGRIN_MOUSE MATN1_HUMAN PA2GA_MOUSE EFCB1_LOTGI DLL1_RAT FBN2_MOUSE FAT4_MOUSE
GO:0005576 4.60E-10 extracellular region CC 16 10
AGRIN_MOUSE MATN1_HUMAN PA2GA_MOUSE EFCB1_LOTGI FBN2_MOUSE PERM_HUMAN NPTX2_HUMAN DMBT1_HUMAN VWF_CANLF
GO:0031012 3.21E-05 extracellular matrix CC 6 4
AGRIN_MOUSE FBN2_MOUSE VWF_CANLF CO6A6_MOUSE
GO:0050767 2.31E-05 regulation of neurogenesis BP 3 2
NOS1_RAT NOS1_HUMAN DLL1_RAT
GO:0020037 1.38E-05 heme binding MF 5 4
NOS1_RAT NOS1_HUMAN PERM_HUMAN PXDN_DROME NGB_CHAAC
GO:0030500 5.69E-05 regulation of bone mineralization BP 3 2 MATN1_HUMAN
Five genes classified as immune-related were up-regulated in the MDP treatment of Group2
when compared to control samples of the same group (Table 2.4). Three of the five genes were
signalling components related to recognition and cell survival (24631.0;
Cluster-33002.5337; Cluster-39559.2). The remaining two clusters corresponded to the deleted in
malignant brain tumour protein (dmbt1) and laccase-4. Dmbt1 has been found up-regulated in
corals under immune challenge, and it has also been suggested that it has a function in the
recognition and maintenance of symbionts (Wright et al., 2017).
Laccase participates in melanin synthesis, and it has been reported that a laccase homolog was
up-regulated in Pocillopora damicornis exposed to either non-virulent or virulent bacteria after
12 days of exposure (Vidal-Dupiol et al., 2014). Palmer et al. (2012) found less laccase activity
in bleaching and disease-susceptible corals than in non-susceptible. Conversely, five other
genes nominally associated with immune responses were down-regulated in Group2-MDP
versus Group2-control samples (Table 2.4). Most of these genes have functions in removal of
reactive oxygen species (ROS) typically generated during a cellular stress response;
peroxidasin, for example, controls detoxification of ROS. Peroxidasin was up-regulated in
several hard coral species exposed to heat stress (Libro et al., 2013; Louis et al., 2017; Voolstra
et al., 2009) and a peroxidasin homolog was also up-regulated in Gorgonia ventalina following
challenge with Aplanochytrium (a parasite) (Burge et al. 2013).
A total of fifteen clusters potentially involved in nervous system function or development based
on their annotation were differentially expressed upon MDP-challenge. Of these, twelve were
down-regulated and three (homologs of the protocadherin Fat 4 (Fat 4), delta-like protein 1
(delta1) and SCO-spondin) were up-regulated in Group2-MDP compared with Group2-control
(Table 2.4). Protocadherins function in axogenesis in vertebrates (Liebeskind et al., 2017), and
Fat 4 is a component of the ECM that functions in cell adhesion but may also be involved in
Wnt signalling (Magie and Martindale, 2008). Note that Wnt signalling is involved in
patterning the nervous system of Nematostella (Bosch et al., 2017). Delta is the receptor for
the notch ligand, and this signalling system was discovered in the context of early neurogenesis
in Drosophila (Artavanis-Tsakonas et al., 1995; Lehmann et al., 1981). Roles for delta/notch
signalling in neurogenesis are common in metazoans, and in Nematostella the delta homolog
Nvdelta is an inhibitor of embryonic neurogenesis (Layden et al., 2012; Layden and Martindale,
2014). If the similarity between the delta homologs of Lobophytum and Nematostella is
27610.0 implies that it is a homolog of SCO-spondin, a protein involved in the modulation of
neural aggregation (UniProt). A homolog of this gene has been shown (by in situ
hybridization) to be expressed in the head region of Hydra (Hamaguchi-Hamada et al., 2016).
Amongst the twelve down-regulated clusters in the neuro-related genes category, two clusters
were annotated as a homolog of the glycine receptor subunit alpha-2 (GLRA2; Table 2.4).
GLRA2 has roles in the peristaltic contraction of the epitheliomuscular cells and chemosensory
responses of Hydra (Pierobon, 2012; Watanabe, 2017). Thus the down-regulation of the
GLRA2 homolog observed in Lobophytum upon MDP challenge suggests suppression of
neural signalling. Two sox gene homologs were also down-regulated: Sox-8 (Cluster-31038.0)
also annotated as AmSoxE1 from Acropora millepora, and Sox9A (Cluster-52616.0) also
annotated as SoxE1 from Hydractinia echinata (Table 2.4). Cnidarian SoxE genes have been
implicated in neuronal development (Shinzato et al., 2008) and the Lobophytum SoxE
expression data are again consistent with the idea of suppression of neuronal signalling and
development under immune challenge. Two genes previously discussed (Results section
2.3.3.1), agrin and NOS, were also categorized as neuro-related genes. As mentioned above,
NOS being implicated in nervous signalling. Agrin is a ligand produced by motor neurons and
has a role in the mammalian neuro-muscular connection (Zhang et al., 2011) . The Hydra
serine protease inhibitor (kazal1) resembles agrin in terms of domain structure (Chera et al.
2006). Kazal2, a sequence similar but not identical to kazal1, from Hydra magnipapillata has
been found to have antimicrobial properties (Augustin et al., 2009; Mydlarz et al., 2016). The
antimicrobial properties of the Hydra kazal-type protein in the immune defence and the
presence of kazal-type domain in the Lobophytum homolog of agrin suggests that this protein
may have a role or roles in the immune and/or nervous systems.
Six clusters classified as ECM components or involved in ECM-based signalling pathways
were down-regulated upon immune challenge (Table 2.4). Most of the genes in the ECM
category were involved in calcium binding and/or mineralisation based on their associated
GO-terms. The ECM component fibrillin-2 was the only protein in this category to be up-regulated
upon challenge.
Nine clusters differentially expressed upon MDP challenge were classified as being related to
transcription (Table 2.4). Two clusters (Cluster-1141.1; Cluster-56145.5) that lacked
annotation but contained reverse transcriptase domains were up-regulated in this category,
whereas a forkhead domain-containing protein and a homolog of the nucleolar protein 73
Table 2.4: Genes differentially expressed in Group2-MDP. Blue=down-regulated genes and red=up-regulated genes.
Biological characteristic Category Cluster ID UniProt ID BEST
E-value Protein names
log2 Fold Change
Grp2
padj
Grp2 Domain name
Domain e-value
Accession ccd
Signalling component / Stress /
ROS/ Defence IMMUNITY
Cluster-30490.3 THIO_PLAF7 1.00E-26 Thioredoxin -1.0 8.15E-02 TRX family 2.67E-35 cd02947
Signalling component / Nervous
/ Cell fate /Defence IMMUNITY
Cluster-55251.0 PXDN_DROME 3.00E-115 Peroxidasin (EC 1.11.1.7) -5.4 2.73E-02 Anperoxidase 0.00E+00 pfam03098
Signalling component / Recognition / Adhesion / mucus Defence
IMMUNITY 33002.5471 Cluster- NGB_CHAAC 5.00E-18 Neuroglobin -0.8 4.39E-02 Globin likesuperfamily 2.30E-42 cl21461
Signalling component / SARC /
Defence IMMUNITY
Cluster-38295.0 PERM_HUMAN 1.00E-38
Myeloperoxidase (EC
1.11.2.2) -6.5 8.38E-04 An peroxidase 0.00E+00 pfam03098
Signalling component / Nervous /
Cell fate / Defence IMMUNITY
Cluster-32573.0 ALDO2_ARATH 1.49E-117
Indole-3-acetaldehyde oxidase (EC 1.2.3.7) (Aldehyde oxidase 2)
-1.4 3.17E-02 PLN00192 6.22E-171 PLN00192
Signalling component / mucus IMMUNITY
Cluster-24631.0 VWF_CANLF 8.00E-81 von Willebrand factor 2.8 1.16E-03 VWA 2.83E-43 pfam00092
Signalling component / ECM IMMUNITY 39559.2 Cluster- TNNC2_PELES 1.00E-05 Troponin C, ske