University of Southern Queensland
Numerical Evaluation of the Performance of
an Indirect Heating Integrated Collector
Storage Solar Water Heating System
A Dissertation submitted by
Marwaan Awad Hamad AL-Khaffajy
B.Sc. Eng.
Supervised by
Dr. Ruth Mossad
Dr. Ahmad Sharifian-Barforoush
For the award of
Master of Engineering Research
Major Subject: Mechanical Engineering
Minor Subject: Thermal Fluid
Marwaan AL-Khaffajy i
Abstract
Due to the impact of energy usage on the environment and the increase in the price
of fossil fuel, people must be encouraged to use renewable energy sources such as
solar energy, wind power, hydraulic energy, geothermal energy and biomass energy.
The indirect heating integrated collector storage solar water heating system is one of
the compact systems for domestic water heating. It incorporates a solar energy
collection component and a hot water storage component into one unit. The indirect
heating type is characterized by service water passing through a serpentine tube (a
heat exchanger) that is immersed in the stored fluid. The objectives of this study
were to investigate ways to reduce heat losses from the system and enhance heat
gained by the service water with the aim of reducing both the initial and the running
costs.
The continuity, momentum and energy equations were solved in a steady state
condition, using ANSYS 13.0-FLUENT software and using the pressure-based type
solver. The results for particular system using the realizable k-є and standard k-ω
turbulence models were compared to available experimental results to determine the
appropriateness of the turbulence model choice. The percentage error for the
numerical simulation of k-є model was higher than for the k-ω model. The error
varied between zero (no errors) and 15 per cent for k-є, and zero to 8.5 per cent for
k-ω model. The radiation heat transfer was also included by using a
surface-to-surface radiation model.
Marwaan AL-Khaffajy ii To minimise the heat loss from the system, a parametric study was conducted in a
system of double glass covers. The air gap spacing between the absorber and the
lower glass cover (L1) and the gap between the upper and lower glass covers (L2) for
the system were varied within the range of 15-50 mm to investigate which
combination of gap sizes (L1, L2) would result in minimum total heat losses, i.e.
including radiation and convection losses. Three-dimensional CFD models for the
absorber, the double glass covers and the air in between (i.e. the storage and service
water were not included) were developed. The results showed that when the gap size
was small, the heat loss through the gap was mainly due to conduction, while as the
gap size increased, the velocity of the air in the gap increased and this increased the
convection contribution to the heat loss. The optimum lower gap spacing was found
in the range of 15 and 20 mm, while the optimum upper gap was found in the range
of 30 and 35 mm.
To enhance the heat gained by the service water, important parameters of the heat
exchanger were investigated. These parameters are tube length, shape, positioning
and the cross sectional area of the pipe. The tube length was 16.2 m for the double
row heat exchanger and it was varied to 8.1 and 10.8 m for the single row heat
exchanger. Circular and elliptical tubes were also examined. The mass flow rate was
chosen as 500 and 650 L/h. The outlet service water temperature was used as a
measure of the performance, since it is a measure of the energy acquired from the
solar radiation. Three-dimensional CFD models were developed and validated using
the experimental results of Gertzos, Pnevmatikakis and Caouris (2008). A standard
k-ω turbulence model was used in the optimization of the heat exchanger because it
Marwaan AL-Khaffajy iii The results showed an increase in the outlet temperature of the system, and a
significant reduction in the initial and operating costs of the system. The outlet
temperature of the elliptical tube system was higher than the circular tube of similar
length and cross-sectional area. The single row heat exchanger (HX) with 10.8 m
length and elliptical cross sectional area gave a high service water outlet temperature
of 57.9o C with low pumping power. The outlet temperature of the system with tube
length of 10.8 m (single row heat exchanger) was higher than those of 16.2 m
(double row heat exchanger). These resulted in an increase in the thermal
performance and a significant reduction in both the initial and operating costs of the
system.
The study was conducted in steady state condition assuming that the circulating
water mass flow rate was 900 L/h, the storage water temperature was constant at
Marwaan AL-Khaffajy iv
Certification of Dissertation
I certify that the ideas, numerical work, results, analysis, and conclusions reported in
this dissertation are entirely my own effort, except where otherwise acknowledged. I
also certify that the work is original and has not been previously submitted for any
award, except where otherwise acknowledged.
………. / /2012
Signature of candidature
Marwaan Awad Hamad AL-Khaffajy
Date
ENDORSEMENT
………. / /2012
Signature of supervisor/s
Date
………. / /2012
Marwaan AL-Khaffajy v
ACKNOWLEDGEMENT
This dissertation would not have been possible without the guidance, encouragement
and support of several individuals who, in one way or another contributed and
extended their valuable assistance in the preparation and completion of this study.
First and foremost I offer my sincerest gratitude to my father who passed away after
four months of starting my study (after I arrived in Australia). He encouraged me to
study my Master’s degree and he was very proud of me telling his relatives and
friends that “Marwaan started his study in a developed country”. I would like to
acknowledge my mother for her patience while I have been away from her for three
years, and for her prayers to finish this work. I would like to acknowledge my wife
and my daughter “Sadane” for their endless love, continuous support and
encouragement. I gratefully acknowledge my brothers and sisters phoning me and
asking about my progress day-by-day. I would like to express my special
acknowledgment to my wife’s family who supported and encouraged me to provide
a valuable contribution to this field of research. I thank my friends in Australia and
Iraq and my relatives. Special thanks go to all the Iraqi students at USQ who shared
with me, from the early stages, their experience of study and life in Australia.
I would like to record my gratitude to Dr. Ruth Mossad for her supervision, advice,
and guidance from the very early stage of this research as well as giving me
extraordinary experiences throughout the work. I will always remember the time we
Marwaan AL-Khaffajy vi Many thanks go, in particular, to my associate supervisor Dr. Ahmad
Sharifian-Barforoush. I am much indebted to him for using his precious time to read this thesis
and provide his critical comments.
I would also like to acknowledge the support of the Faculty of Engineering. Also, I
thank FoES Associate Dean (Research) Assoc. Prof. Armando Apan and his assistant
Juanita Ryan for their support. Many thanks go to the English for Academic
Purposes programs staff at USQ who taught me the English language. I am indebted
to Ms Angela Windsor, Dr. Lindsay Henderson, Mrs Rosemary Taylor and Dr
Sang-Soon Park. Finally, my thanks go to Ms Sandra Cochrane, who helps me in editing
Marwaan AL-Khaffajy vii
Associated publications
1Journal papers
Mossad, R & Al-Khaffajy, M 2012, 'Investigating two configurations of a heat exchanger in an Indirect Heating Integrated Collector Storage Solar Water Heating System (IHICSSWHS)', Renewable Energies and Power Quality, vol. 10, no. 11, p. 716.
Journal paper under review
Al-Khaffajy, M & Mossad, R 2012, ‘Optimization of the Heat Exchanger in an Indirect Heating Integrated Collector Storage Solar Water Heater System',
Renewable Energies.
Refereed conference proceedings
AL-Khaffajy, M & Mossad, R 2011, 'Optimization of the Air Gap Spacing: in a Solar Water Heater with Double Glass Cover', paper presented to 9th Ausralasian Heat and Mass Transfer Conference - 9AHMTC, Monash University, Melbourne, Vectoria, Australia 2-4 November.
1 Some of the above publications are available through USQ - ePrint:
viii
Table of Content
Abstract i
Certification of Dissertation iv
ACKNOWLEDGEMENT v
Associated publications vii
List of Figures xi
List of Tables xvi
Nomenclature xvii
CHAPTER 1: Introduction
1.1 Background 1
1.2 Solar Resources 5
1.3 Solar Collectors 6
1.4 Flat Plate Collectors 9
1.5 Integrated Collector Storage Solar Water Heating System (ICSSWH)
10
1.6 Research Focus and Scope 13
CHAPTER 2: Literature Review and Research
Gap
2.1 Introduction 16
ix
2.3 Storage Tank Construction 18
2.4 Glass Cover 19
2.5 Heat Transfer Enhancement 21
2.5.1 Agitating the Storage Water 22
2.5.2 Heat Exchanger Design 26
2.5.3 Corrugated Absorber 30
2.6 The Heat Exchanger in other Applications 31
2.7 Research Gap 33
CHAPTER 3: Mathematical Model
3.1 Introduction 37
3.2 The Governing Equations 38
3.3 Computational Fluid Dynamics (CFD) 40
3.4 The Advantages of Using CFD Approaches 41
3.5 Types of Flow 42
3.6 Turbulence Modelling and Direct Numerical Simulation 43
3.6.1 K-є Model 47
3.6.2 K-ω Model 52
3.7 Wall treatment for wall bounded turbulent flow 55
3.8 The Use of CFD Software 57
x
CHAPTER 4: System Modifications using the
CFD Approach
4.1 Introduction 60
4.2 Optimisation of the Air Gap Spacing 61
4.2.1 CFD Model 62
4.2.2 Boundary Condition and Operating Parameters 67
4.3 Optimisation of the Heat Exchanger 67
4.3.1 Validating the CFD Model 68
4.3.1.1 Experimental procedure 68
4.3.1.2 CFD Model for the Experimental Setup 70
4.3.1.3 Boundary Conditions and Operating Parameters 72
4.3.1.4 Validation Results 73
4.3.2 Optimising the Heat Exchanger 78
4.3.2.1 CFD Model 82
4.3.2.2 Boundary condition and operating parameters 82
4.4 Chapter Conclusion 83
CHAPTER 5: Results and Discussion
5.1 Introduction 84
5.2 Optimisation of the Air Gap Spacing 85
xi
5.4 Chapter Conclusion 110
CHAPTER 6: Conclusion
6.1 Research limitations and recommendations 114
References 116
xii
List of Figures
Chapter1: Introduction
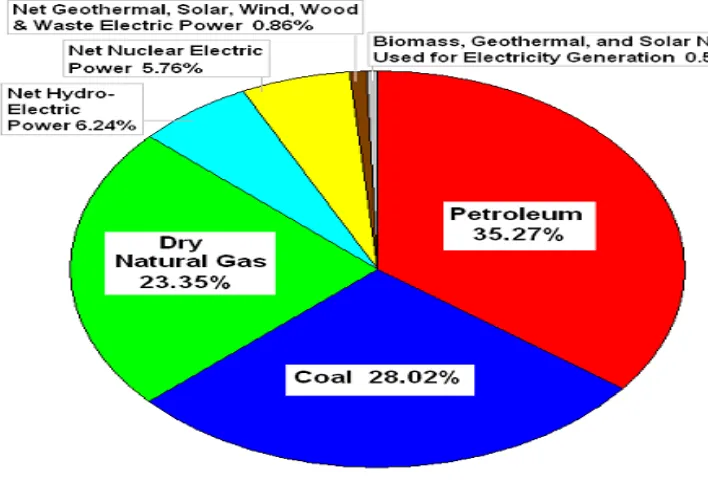
Figure 1.1: World Energy Consumption 2006 by Fuel Type (286W 2009) 2
Figure 1.2: Energy Consumption by Sector (2006) – World and Selected Regions (286W 2009)
3
Figure 1.3: Annual energy bill for typical single family home (Department of Energy 2010)
5
Figure 1.4: Solar collector type (A) Flat plate; (B) Evacuated tube (Fotosearch 2010) 7
Figure 1.5: Solar collector types (A) Parabolic trough (B) Central receiver (Fotosearch 2010)
8
Figure 1.6: Dish concentrator collector (Dreamstime 2012) 8
Figure 1. 7: Cross-section of a basic flat-plate collector (Duffie 2006, p. 239) 9
Figure 1. 8: Conventional type flat plate collector water heating system with storage tank
10
Figure 1.9: Integrated Collector Direct Heating System 11
Figure 1.10: Integrated Collector Indirect Heating System 11
Figure 1.11: Storage tank and service water tube in the Indirect Heating System 11
Figure 1.12: Indirect Heating System with double glass covers 14
Chapter 2: Literature Review and Research Gap
Figure 2.1: Experimental temperatures versus time for the indirect heating system at slopes 0o, 45o, 90o, without recirculation and service water flow rate of 500L/h. Tin: tube water inlet (mains) temperature (Gertzos, Pnevmatikakis & Caouris 2008)
xiii
Figure 2.2: the heat exchanger in the indirect heating system with circulating pump. Key: 1. storage tank; 2. HX; 3. circulating pump; 4. service water inlet; 5. service water outlet; 6. inlet, circulating water; 7. outlet circulating water.
23
Figure 2.3: Experimental and computed temperatures versus time for the system with recirculation flow rate of 923L/hr and service water flow rate of 500L/h (Gertzos, Pnevmatikakis & Caouris, 2008)
23
Figure 2.4: experimental and computed inlet, middle, outlet and average tank temperatures versus time, without recirculation and for service water flow rate of 500L/h (Gertzos, Pnevmatikakis & Caouris, 2008)
24
Figure 2.5: A storage tank with a fin joining the front and back surface 25
Figure 2.6: Optimal arrangement of the connecting fins position (Gertzos & Caouris 2008)
26
Figure 2.7: Cases for HX placement 28
Figure 2.8: Mean tank water, mean tubes water and service water outlet temperature (Gertzos, Caouris & Panidis 2010)
30
Figure 2.9: Cross-section of direct heating system with corrugated absorber 31
Figure 2.10: Geometrical configuration of a reactor. (a) Burst sight of the reactor; (b) Cross-section of the reactor (Mellouli et al. 2007)
33
Chapter 3: Mathematical Model
Figure 3.1: Typical point velocity measurement in turbulent flow (Versteeg & Malalasekera 2007, p. 41)
43
Chapter 4: System Modifications Using the CFD
Approach
Figure 4.1: Cross section of the indirect heating integrated collector storage solar water heating system with double glass cover
62
xiv
Figure 4.3: The computational grid for the air gap spacing 64
Figure 4.4: The system investigated in the experiment of Gertzos, Pnevmatikakis and Caouris (2008)
69
Figure 4.5: (A) Computational grid for the system, (B) The shape and distribution of the elements near the tube wall
72
Figure 4.6: Comparison of the experimental outlet and storage temperatures with the numerical temperatures using the k-є turbulence model
75
Figure 4.7: Comparison of the experimental outlet and storage temperatures with the numerical temperatures using the k-ω turbulence model
75
Figure 4.8: Comparison of the experimental temperatures at points T1 and T2 with the numerical temperatures using the k-є turbulence model
76
Figure 4.9: Comparison of the experimental temperatures at points T1 and T2 with the numerical temperatures using the k-ω turbulence model
76
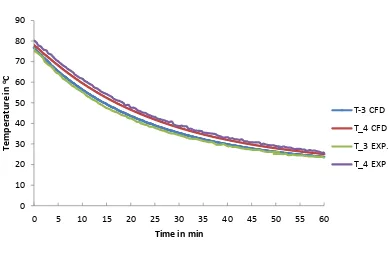
Figure 4.10: Comparison of the experimental temperatures at points T3 and T4 with the numerical temperatures using the k-є turbulence model
77
Figure 4.11: Comparison of the experimental temperatures at points T3 and T4 with the numerical temperatures using the k-ω turbulence model
77
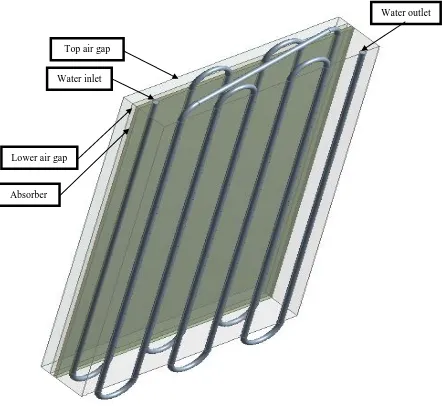
Figure 4.12: Indirect heating system with double row HX (16.2 m) 80
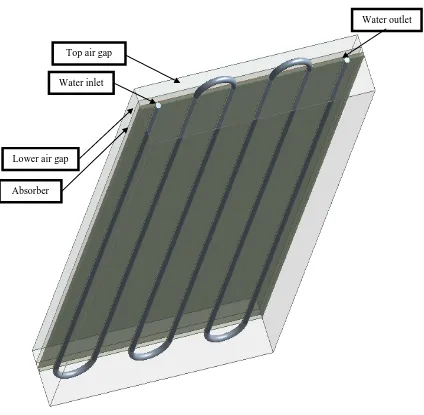
Figure 4.13: Indirect heating system with single row HX (8.1 m) 81
Figure 4.14: Tube placement in the collector 81
Chapter 5: Results and Discussion
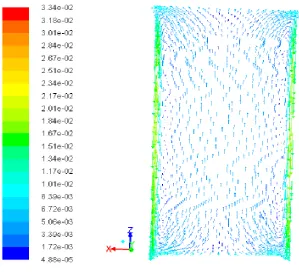
Figure 5. 1: Velocity vector (m/s) for a horizontal plane in the middle of top gap spacing for L1=L2= 15 mm
85
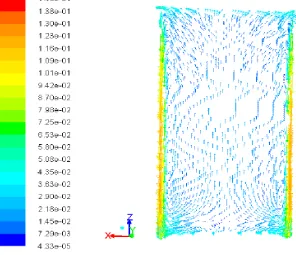
Figure 5. 2: Velocity vector (m/s) for a horizontal plane in the middle of top gap spacing for L1=15 mm and L2= 50 mm
xv
Figure 5.3: The points in which the velocity and temperature are plotted I prefer you bring this before the last two figures
86
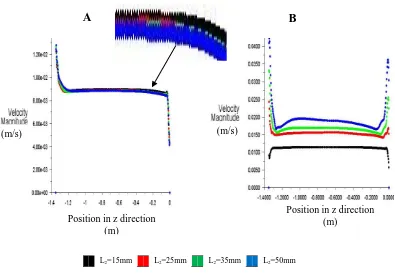
Figure 5.4: (A) Velocity in the middle of lower gap L1=15 mm and different L2, (B) Velocity in the middle of upper gap as L2 changed and L1=15 mm
88
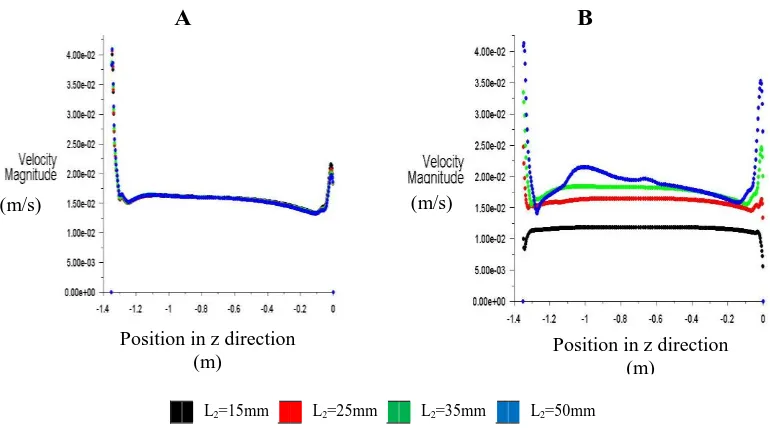
Figure 5.5: (A) Velocity in the middle of lower gap L1=25 mm and different L2; (B) Velocity in the middle of upper gap as L2 changed and L1=25 mm
88
Figure 5.6: (A) Velocity in the middle of lower gap L1=40 mm and different L1; (B) Velocity in the middle of upper gap as L2 changed and L1=40 mm
89
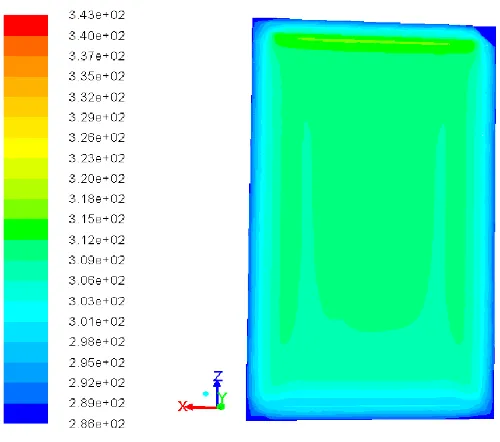
Figure 5. 7: Temperature contours (K) for a plane in the middle of lower gap spacing for L1=15 mm and L2= 50 mm
90
Figure 5. 8: Temperature contours (K) for a plane in the middle of top gap spacing for L1=15 mm and L2= 50 mm
90
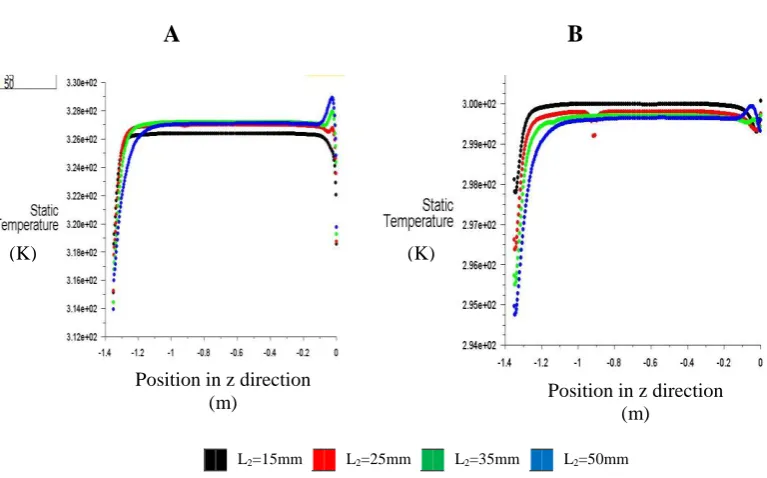
Figure 5.9: (A) Temperature of lower glass (middle of the glass) for L1=15 mm as L2 changed; (B) Temperature of top glass for L1=15 mm and L2 changed
93
Figure 5.10: (A) Temperature of lower glass (middle of the glass) for L1=25 mm as L2 changed; (B) Temperature of top glass for L1=25 mm and L2 changed
93
Figure 5.11: (A) Temperature of lower glass (middle of the glass) for L1=40 mm as L2 changed; (B) Temperature of top glass for L1=40 mm and L2 changed
94
Figure 5. 12: View factor between the lower and upper glasses as L2 changed 94
Figure 5.13: Heat loss from upper glass 96
Figure 5. 14: Heat loss from side wall 97
Figure 5.15: Total heat loss from upper and side wall 97
Figure 5.16: Total heat loss from upper and side wall (L1 changed and L2 constant)
xvi
Figure 5.17: Temperature contours (K) of service water for tube A and flow rate 500L/h
101
Figure 5.18: Temperature contours (K) of service water for tube A and flow rate 650 L/h
102
Figure 5.19: Temperature contours (K) of service water for tube B and flow rate 500 L/h
102
Figure 5.20: Temperature contours (K) of service water for tube B and flow rate 650 L/h
103
Figure 5.21: Temperature contours (K) of service water for single row HX, tube A and length 8.2 m and flow 500 L/h
105
Figure 5.22: Temperature contours (K) of service water for single row HX, tube A and length 10.8 m and flow 500 L/h
105
Figure 5.23: Temperature contours (K) of service water for single row HX, tube B and length 8.2 m and flow 650 L/h
106
Figure 5.24: Temperature contours (K) of service water for single row HX, tube B and length 10.8 m and flow 650 L/h
106
Figure 5.25: Temperature contours (K) of service water for single row HX, elliptical tube and length 8.2 m and flow 650 L/h
107
Figure 5.26: Temperature contours (K) of service water for single row HX, elliptical tube, length 10.8 m and flow 500 L/h
107
Figure 5. 27: Z-X plane of velocity vector (m/s) for tube type B with 10.8 m and 650 L/h mass flow rate
108
Figure 5. 28: Z-Y plane of velocity vector (m/s) for tube type B with 10.8 m and 650 L/h mass flow rate
xvii
List of Tables
Table 4.1: Physical properties of material 61
Table 5.1: Outlet temperature, heat gained by the service water (q), power required and cost for different tubes for inlet water temperature of 17o C and absorber temperature of 60o C
Marwaan AL-Khaffajy xvii
Nomenclature
English Symbols
Speed of sound
View factor between surface j and k
g Acceleration due to gravity
L1 Lower air gap spacing
L2 Upper air gap spacing
Number of surrounding faces in the radiation
Mt Turbulent Mach number
p Fluid pressure
Turbulent Prandtl number
Heat flux due to radiation
Radiation energy flux incident on surface k from the surrounding surfaces
Radiation energy flux leaving surface j
Heat transfer rate to unit k [W]
Ambient temperature
Main fluid velocity
Overall heat transfer coefficient of unit k [W/ (m2K)]
Tensor notation of mean velocity vector of the fluid
Greek symbols
µ Viscosity
Density
Reflectivity in the radiation
υ Kinematic viscosity
β Thermal expansion coefficient
Turbulent kinetic energy
є Turbulent dissipation
Emissivity of surface k in the radiation
Velocity component in x direction
Velocity component in y direction
Velocity component in z direction
Mean velocity component in x direction
Mean velocity component in y direction Mean velocity component in z direction
Components of the random velocities fluctuation in x, y and z direction
Absorptivity in the radiation
Thermal diffusivity
low-Reynolds number correction
Boltzmann’s constant
Turbulent Prandtl number for kinetic energy
Marwaan AL-Khaffajy xviii
Turbulent heat flux
Reynolds stresses tensor
kinetic energy source term
Energy dissipation source term
Mean rate of rotation tensor
Marwaan AL-Khaffajy 1
CHAPTER 1: Introduction
Background
Solar Resources
Solar Collectors
Flat Plate Collectors
Integrated Collector Storage Solar
Water Heating System
Research Focus and Scop
1.1 Background
Energy resources are classified into two types: renewable resources including solar
energy, wind power, hydraulic energy, geothermal energy and biomass energy, and
non-renewable resources that cannot be replenished, such as petrol, nuclear energy,
coal and natural gas. Figure 1.1 presents the world’s energy consumption in 2006 by
fuel type (286W 2009). The world’s energy usage from non-renewable resources
Marwaan AL-Khaffajy 2 Figure 1.1: World Energy Consumption 2006 by Fuel Type (286W 2009)
Due to the massive increase in the non-renewable fuel prices and the increase in
public awareness of its negative impact on the environment, the growth of renewable
energy has accelerated over the past few years. According to British Petroleum (BP)
(2011), power generated from renewable resources has increased to 14% of the total
growth in global power generation. However, because of the enormous growth in the
energy consumption, this growth is not enough to reduce the level of carbon
emissions and to meet the Millennium Development Goals in 2030, that is the carbon
emissions cap to be 30 GtCO2 (Chakravarty et al. 2009).
As a consequence of the increase in the world’s population, human development, the
increase in individual income, and the aspiration for more comfortable life styles, the
power consumption has increased significantly over the last three decades resulting
Marwaan AL-Khaffajy 3 enough for basic needs; while in 2005 the primary need of energy was estimated for
the Swiss to be two kilowatt per capita (Steinberger & Roberts 2010). The world’s
carbon emissions also increased from 21.2 GtCO2/year in 1990 to 25.5 GtCO2/year
in 2003. The United States contributes by far the highest emissions of 5.8
GtCO2/year which is equivalent to 16.8 tCO2 per year per capita. Furthermore, the
world’s population is expected to increase to 8.1 billion by 2030 and hence, the
average carbon emissions cap for each individual must be reduced to 3.7 tCO2/year
to achieve the Millennium Development Goals by 2030 (Chakravarty et al. 2009).
Therefore, carbon emissions must be reduced, and this can be achieved by reducing
power consumption and/or increasing the percentage of the energy generated by
using the clean resources like solar, wind, geothermal and hydraulic energy.
Figure 1.2: Energy Consumption by Sector (2006) – World and Selected Regions (286W 2009)
Increasing the investment of the clean resources involves four sectors: industrial,
Marwaan AL-Khaffajy 4 consumption by sector and region (286W 2009). The highest energy consumption
occurs in the industrial sector. Therefore, much research has been conducted to
reduce the energy consumption in this sector (Ang & Zhang 2000). The lowest
consumption occurs in the commercial sector. The contribution of the present study
will be in the residential sector. This study will focus on using the solar energy for
domestic applications to reduce burning fossil fuel and hence carbon emission.
Research involving cheap and clean sources of energy such as solar energy, has
increased significantly over the last four decades. US research in the solar energy
was initially discouraged by the discovery of natural gas and oil in 1930’s. However,
after the World Oil Crisis in 1973, its research increased (Smyth, Eames & Norton
2006). Recently, the use of solar energy for electricity generation, air conditioning
and water heating has grown. In the domestic applications, households consume
energy by using air conditioning, heating, water heating, lighting and other
applications (Figure 1.3). An environmentally and economically important and costly
use, occurs in the production of domestic hot water, which accounts for
approximately 14% of the domestic energy consumption in the United States
(Department of Energy 2010). Domestic hot water is generally heated to around 60o
C, a temperature which can be easily produced by using solar energy rather than
burning fossil fuel. Therefore, an economic and efficient system is required to
Marwaan AL-Khaffajy 5 Figure 1.3: Annual energy bill for typical single family home (Department of Energy 2010)
1.2 Solar Resources
The sun’s diameter is approximately 1.4 million km and it is 150 million km away
from the earth. It has an effective black body temperature of 5777 Kelvin (Duffie
1991, p. 3) and hence the radiation is emitted from the sun at a rate of 3.8 × 10²³ kW.
Moreover, solar energy is readily available, friendly to the environment and
renewable. During the day time, it is available anywhere in the globe. Solar energy is
expected to continue for very long time due to endless nuclear reactions that are
occurring at the core of the sun. These reactions are estimated to continue several
billion years (Lovegrove & Luzzi 2001).
Marwaan AL-Khaffajy 6 To produce the average world electricity consumption using solar radiation, an area
of 35,000 km2 (roughly the size of Taiwan) is required. To estimate this area, the
following factors have been taken into consideration (Lovegrove & Luzzi 2001):
1. Only a small part of the solar energy reaches the earth: 1.7 × 10¹⁴ kW reaches
the earth’s atmosphere which is 4.5 × 10⁻⁸
per cent of total solar radiation.
This energy is more than 1000 times the average world electricity expenditure
of 1.6 × 10¹¹ kW (Lovegrove & Luzzi 2001)
2. Solar intensity is affected by several factors: the position of the sun in the
sky, the season and location on the globe. The maximum intensity of solar
radiation on a clear sunny day at noon is around 1100 W/ m2 (Duffie &
Beckman 2006, p. 238)
3. The efficiency of converting solar radiation to electricity: the efficiency is
assumed to be 20% for the 35,000 km2 area (Lovegrove & Luzzi 2001).
1.3 Solar Collectors
The solar collectors are devices which transfer solar energy into thermal energy that
increases the internal energy in the fluids, and hence increases their temperature.
They are used to capture the solar energy. According to Lovegrove and Luzzi (2001),
the simplest solar collector is a plate painted black and placed in the sun. The plate
heats up until reaches the stagnation temperature when the heat gained from solar
radiation equals the heat loss to the surrounding by convection and radiation. If water
is sent through the plate, the water will extract energy from the plate, reducing its
stagnation temperature. The water temperature increases and this energy can be used
Marwaan AL-Khaffajy 7 There are several types of solar collectors, including the flat plate collector,
evacuated tube, parabolic trough, central receiver and dish concentrator (Figures 1.4,
1.5 and 1.6). The temperature that the different types produce is a key indicator of
their relevance to a particular use. For example, the evacuated tube type of collector
can produce 90-200o C and the parabolic trough can produce outlet fluid
temperatures between 260-400o C, while the central receiver can produce 500-800o C.
According to Lovegrove and Luzzi (2001), the highest outlet fluid temperature
(500-1200o C) is produced by the dish concentrator type. The flat plate collector is used for
applications that require a temperature lower than 100o C. As mentioned earlier,
households generally have lower temperature requirements. Consequently, in order
to study an economic system for household use, this research will focus on the flat
plate collector.
A B
Marwaan AL-Khaffajy 8
A B
Figure 1.5: Solar collector types (A) Parabolic trough (B) Central receiver (Fotosearch 2010)
Marwaan AL-Khaffajy 9 1.4 Flat Plate Collectors
Flat plate collectors are the cheapest type of collectors. They are classified into two
main types: conventional and integrated collectors. According to Duffie (2006, pp.
238-9), the conventional flat plate collector consists of:
1. A black surface that absorbs radiation and transfers the heat to the fluid
2. A glass cover that allows the solar radiation to reach the absorber surface and
reduce convection and radiation losses
3. Tubes in which the fluid flows
4. Back insulation to reduce the conduction losses (Figure 1.7).
Since demand for hot water may not be continuous and solar energy is not available
at night, a storage tank is needed to store the hot water (Figure 1.8).
Figure 1. 7: Cross-section of a basic flat-plate collector (Duffie 2006, p. 239) Insulation Fluidconduit
Marwaan AL-Khaffajy 10 Figure 1. 8: Conventional type flat plate collector water heating system with storage tank
The integrated collector storage solar water heating systems differ from the
conventional type by incorporating a solar energy collection component and a hot
water storage component into one unit. This reduces the cost of the system as there
are no connection pipes and only a small area is required for installation (Gertzos,
Caouris & Panidis 2010; Khalifa & Abdul Jabbar 2010) . Therefore, this study will
focus on the integrated collector storage solar water heating system.
1.5 Integrated Collector Storage Solar Water Heating System (ICSSWH)
In the late 1800s, some practical individuals in the southwest of the USA produced
warm water for showering by leaving a water tank exposed to the sun. This was
considered to be the first Integrated Collector Storage Solar Water Heating
(ICSSWH) system (Smyth, Eames & Norton 2006). However, there are two types of
ICSSWH. One is the direct heating system in which the service water flows into the
storage tank and is directly heated through the collector (Figure 1.9). The other is the
indirect heating type in which the service water passes through a serpentine tube (a
heat exchanger) that is immersed in the stored fluid (Figures 1.10 and 1.11). Coldfluid
HotWater
ColdWater inlet StorageTank
Marwaan AL-Khaffajy 11 Figure 1.9: Integrated Collector Direct Heating System
Figure 1.10: Integrated Collector Indirect Heating System
Figure 1.11: Storage tank and service water tube in the Indirect Heating System Inlet service water Outlet service
water Service water tube
Water inlet Absorber
Water
Insulation Air gap
Hot water outlet Glass cover
Glass cover
Air gap
Absorber
Storage water
Insulation
Hot water outlet
Marwaan AL-Khaffajy 12 Construction of the storage tank in the direct heating type is relatively expensive.
Since the storage tank is connected directly to municipal water pressure, the pressure
inside the tank is relatively high. Therefore, the storage tank in this type needs to be
manufactured from a high corrosion resistance material that is able to withstand high
pressures. This leads to increased tank construction costs to more than 50 percent of
the total system price (Gertzos & Caouris 2007).
Since the storage tank in the indirect heating system is not exposed to municipal
pressure, its capital cost is lower than the direct heating system (Gertzos & Caouris
2007). However, the storage fluid is static in the indirect heating system, which
results in a low heat transfer rate between the storage fluid and the service water.
Enhancing the heat gained by the service water will improve the system’s efficiency
so that it provides an acceptable outlet service water temperature.
The aim of the present study is to show that the thermal performance of the indirect
heating integrated collector storage solar water heating system can be improved,
while keeping the collector construction costs low. This can be achieved by
enhancing the heat gained by the service water and reducing heat loss from the
system.
In order to identify a way to maximize the heat gained by the service water and to
minimize the heat loss, it is important to understand heat balance in the indirect
heating integrated collector storage solar water heating system. The absorber surface
is heated from the solar radiation which has been transmitted through the glass
Marwaan AL-Khaffajy 13 service water. When there is no solar radiation, the energy in the storage water flows
to the absorber and service water. In both cases, the absorber loses some of the heat
due to convection to the air in the gap spacing, radiation to the side walls (the
side-wall surrounding the air gap spacing, Figure 1.10) and radiation to the top glass
cover. The top glass cover loses heat due to convection to the ambient air and due to
radiation to the sky.
1.6 Research Focus and Scope
There are different ways to improve the performance of the indirect heating
integrated collector storage solar water heating system. These are:
1. Increasing the heat gained by the service water (Chen et al. 2010; Gertzos
& Caouris 2008; Gertzos, Pnevmatikakis & Caouris 2008; Kumar & Rosen
2010).
2. Reducing heat losses to the environment (Kumar & Rosen 2011).
3. Increasing the system’s ability to store energy (Smyth, Eames & Norton
2006).
4. Optimizing the angle of the collector for the reference point (Elminir et al.
2006; Gunerhan & Hepbasli 2007).
The present study will investigate ways to reduce heat losses from the system and
enhance heat gained by the service water.
A. Heat Loss Reduction
Using a double glass cover instead of single one is an efficient strategy to reduce the
heat loss (Kumar & Rosen 2011). The present study investigated the optimum air gap
Marwaan AL-Khaffajy 14 the absorber surface (Figure 1.12). A parametric study has been conducted in a
system with double glass cover. The lower air gap spacing (L1) and the upper air gap
spacing (L2) for the system with 0.7 m x 1.35 m absorber area were varied within the
range of 15-50 mm to investigate which combination of gap sizes (L1, L2) would
result in minimum total heat losses, i.e. including radiation and convection losses.
Figure 1.12: Indirect Heating System with double glass covers
B. Heat Transfer Enhancement
The heat gained by the service water can be enhanced by methods such as:
1. Agitating the storage water using a circulating pump. This will not be investigated
in the present study because using a circulating pump increases the capital and
running costs of the system. The pump requires electricity and continuous
maintenance
Lower air gap
Absorber
Storage water
Insulation Upper air gap
Hot water outlet
Service Water inlet
Upper glass
Lower glass
L2
Marwaan AL-Khaffajy 15 2. Using the phase change material technique. Chen et al (2010) studied an indirect
collector that is operated with paraffin instead of storage water. Their objective
was to increase the thermal conductivity of the paraffin by adding aluminum foam
with high thermal conductivity, 202.4 W/mK. Adding aluminum foam enhanced
the heat transfer between the storage fluid and the service water. This method is
out of the scope of the present study.
3. Changing the heat transfer surface design which includes adding fins, surface
roughness, twisted-tape inserts and coiled tubes. The surface treatment technique
enhances the heat transfer because it increases the turbulence, increases the
surface area and improves the mixing or flow swirl (Kreith, Frank & Bohn 2001,
pp. 514-7). This technique will not be used in this study because it increases the
cost of the system.
The present study focuses on changing the length and cross sectional area of the
service water tube to enhance the heat gained by the service water. The outlet service
water temperature is used as a measure of the performance as it is a measure of the
energy acquired from solar radiation. Single and double raw heat exchangers with
different lengths are investigated. Circular and elliptic tube cross section pipes are
also examined. The service water mass flow rate is chosen as 500 and 650 L/h, as
average flow rates used in the investigation of the indirect heating system (Gertzos &
Caouris 2008; Gertzos, Caouris & Panidis 2010; Gertzos, Pnevmatikakis & Caouris
Marwaan AL-Khaffajy 16
CHAPTER 2: Literature Review and
Research Gap
Introduction
Collector Angle and Inlet Position
Storage Tank Construction
Glass Cover
Heat Transfer Enhancement
The Heat Exchanger in other
Applications
Research Gap
2.1Introduction
This chapter provides a review of the previous work aimed at investigating the
parameters that have an effect on the collector performance. These parameters are the
collector angle, the service water inlet position, storage tank construction, glass
cover, and methods of heat transfer enhancement. As the heat exchanger is a major
component in the indirect heating system, the last section of this chapter is devoted to
summarising the research conducted on general heat exchangers.
2.2Collector Angle and Service Water Inlet Position
Gertzos, Pnevmatikakis & Caouris (2008) conducted an experimental and numerical
study investigating the heat transfer between the service and storage water in the
Marwaan AL-Khaffajy 17 position and the slope of the collector on the outlet service water temperature. They
built the heat exchanger (storage tank and service water tube) for the system. The
storage water was heated, using successive passages through the external heater.
When the temperature of the storage water reached 80o C, they stopped the heating
process, allowed the service water to flow through the tube, and measured the outlet
and the average storage water temperature for one hour period of the energy
withdrawal (Figure 2.1).
In the numerical simulation, they developed a 3D CFD model (using CFD package
FLUENT 6.3) and solved the continuity momentum and energy equation in transient
condition, using a standard k-omega turbulence model. They used the SIMPLE
algorithm (Semi-Implicit Method for Pressure Linked equation) for the
velocity-pressure coupling and the second order upwind scheme for momentum, turbulent
kinetic energy, specific turbulent dissipation ratio and energy. They examined the
case with free convection heat transfer (i.e. when the storage water is static).
Their findings:
1. In an investigation of two cases of the inlet position; one the inlet is placed in the
front of the collector and one in the back. The inlet position of the service water
has no effect on the outlet service water temperature
2. For the collector angle, in the first ten minutes when the average storage water
temperature (Tta) was higher than 50o C, the service water outlet temperature (Tout)
increased, as the collector angle increased, due to the buoyancy effect. While,
after ten minutes, the outlet temperature was not affected by changing the
Marwaan AL-Khaffajy 18 Their numerical model was validated against their experimental results. The
experimental inputs of initial temperature of storage water, mass flow inlet and inlet
temperature were used in the CFD model and there was a good agreement between
the experimental and the numerical results.
Figure 2.1: Experimental temperatures versus time for the indirect heating system at slopes 0o, 45o, 90o, without recirculation and service water flow rate of 500L/h.T1n : tube water inlet
(mains) temperature (Gertzos, Pnevmatikakis & Caouris 2008)
2.3Storage Tank Construction
In the indirect heating system, thin steel metal sheets (0.8-1.2 mm thick) can be used
to build the tank, without any corrosion protection (Gertzos, Caouris & Panidis
Marwaan AL-Khaffajy 19 pressure similar to municipal pressure. The fluid in the tank is not connected to
municipal water and it is not refreshed. The municipal water (service water) passes
through a serpentine tube that is immersed in the storage tank.
According to Smyth, Eames and Norton (2006), the tank depth has an effect on the
performance of the system. For example, an increase in the water depth leads to an
increase in the time taken to heat the water. A decrease in the tank depth leads to a
decrease in the system’s capacity to store energy. Moreover, in a cold climate, a
depth decrease could result in the storage water being frozen. Smyth, Eames and
Norton (2006) conducted a review study in which they state that the best
“volume/aperture area” ratio is 100 L/ m2
or the best tank depth is 10 cm. Tiller and
Wochatz (1982) concluded that in hot weather, the performance of 102 L/m2 is better
than 51-69 L/m2 unless the water is withdrawn fairly continuously through the
daylight hours. Gertzos, Caouris and Panidis (2010) studied the indirect heating
system and took the tank depth as 10 cm or the “volume/aperture area” ratio as 100
L/m2.
2.4 Glass Cover
The glass cover has several functions:
1. It reduces convection heat losses to the surroundings
2. It protects the absorber surface from the environment
3. It reduces the radiation heat losses by reflecting the radiation emitted from
the absorber surface. As the wave length of solar radiation is shorter (in the
range 0.3-3 µm) than the radiation that emits from other surfaces at lower
Marwaan AL-Khaffajy 20 the radiation emitting from the absorber surface is not able to transmit back
through the glass cover.
However, the glass material has to be highly transparent for the solar radiation, since
any loss in the transmittance results in a direct decrease in the collection efficiency
(Smyth, Eames & Norton 2006).
Kumar and Rosen (2011) numerically investigated five strategies for reducing the top
heat losses. They applied an energy balance equation for each case and solved these
equations numerically using a “forward time step marching finite difference
technique”. Their study aimed to find the best strategy for enhancing the thermal
performance of the system. The 100 L tank capacity model and 1 m2 absorber area
was used to assess five cases:
(1) Single glass cover without night insulation.
(2) Single glass cover with a night insulation cover.
(3) Double glass cover without a night insulation cover.
(4) Transparent insulation with a single glass cover.
(5) Insulating baffle plate with a single glass cover.
Case 3 gave the highest thermal performance, while Case 5 gave the lowest. The
water temperature in the storage tank for Case 3 was higher than the temperature for
Case 4 and 5 by 5-7o C and the thermal efficiency was higher by 12-14%. In Cases 1,
2, 3 and 5, the high and low thermal efficiency resulted from low and high heat loss
respectively. However, in Case 4 the relatively low efficiency resulted from the
decreased incoming solar radiation on the absorber surface due to the presence of the
Marwaan AL-Khaffajy 21 According to Kumar and Rosen (2011), using a double glass cover in the integrated
collector system is an efficient strategy for reducing the top heat losses. However, the
air spacing between the upper and lower glass, and between the lower glass and the
absorber surface, has an effect on the amount of heat losses. Manz (2003)
investigated numerically the convective heat flow through an air layer in cavities of
facade elements. The Rayleigh number was varied between 1000 and 106 in this
study. It was changed by altering the temperature difference between the walls
surrounding the air or by altering the distance between the walls. The result of
Manz’s study suggested that the increasing Rayleigh number resulted in an increase
in the velocity of the air which in turn increased the convective heat transfer.
Therefore, at a high Rayleigh number the gap is not as effective in reducing the heat
loss.
Mossad (2006) investigated the effect of the air gap spacing of double glassed doors
in closed refrigerated vertical display cabinets. The results showed that when the size
of the air gap was very small, the heat transfer was mainly due to conduction: as the
gap spacing increased, air begins to move due to natural convection which leads to
an increase in the convective heat loss. Therefore, the sizes of the top and lower air
gap spacing have an effect on the amount of heat loss from the system.
2.5 Heat Transfer Enhancement
Previous studies in the indirect heating integrated collector system showed that the
heat gained by the service water is enhanced by agitating the storage water and
Marwaan AL-Khaffajy 22 corrugated absorber surface was found to increase the heat gained. A summary of the
research aimed at investigating different techniques to enhance the heat transfer in
the integrated collector storage solar water heating system is given below.
2.5.1 Agitating the Storage Water
Gertzos, Pnevmatikakis and Caouris (2008) used a pump circulating the storage
water to enhance the heat transfer between the storage and service water (Figure 2.2).
The experimental and numerical methods of this study were summarized in Section
2.1. The inlet, outlet service water temperature and the average temperature of the
storage water were measured at one second time intervals and were averaged and
recorded every 30 seconds, for energy withdrawal periods of one hour.
Gertzos, Pnevmatikakis and Caouris (2008) reported that the outlet service water
temperature was higher in the case with circulating pump than without circulating
pump. Figures 2.3 and 2.4 present the experimental and computational temperatures
of the service water inlet and outlet (Tin, Tout), storage tank (Tta) and temperature in
the middle of the service water tube (Tmed) during a one hour period, for the system
with and without circulating pump, respectively. When the circulating pump was
used with a 923 L/h flow rate (Figure 2.3), the outlet temperature was 55o C at time
equals zero, but when the circulating pump was not used (Figure 2.4), the outlet
Marwaan AL-Khaffajy 23 Figure 2.2:the heat exchanger in the indirect heating system with circulating pump. Key: 1. storage tank; 2. HX; 3. circulating pump; 4. service water inlet; 5. service water outlet; 6. inlet,
circulating water; 7. outlet circulating water.
Figure 2.3:Experimental and computed temperatures versus time for the system with recirculation flow rate of 923L/hr and service water flow rate of 500L/h (Gertzos,
Pnevmatikakis & Caouris, 2008) 1 2
3
4
5
100
mm 337.5
mm
Solar radiation
Marwaan AL-Khaffajy 24 Figure 2.4: experimental and computed inlet, middle, outlet and average tank temperatures
versus time, without recirculation and for service water flow rate of 500L/h (Gertzos, Pnevmatikakis & Caouris, 2008)
Gertzos & Caouris (2008) conducted a study on the same system (Figure 2.2) with
circulating pump. The objective of the study was to reduce the construction cost
without reducing the thermal efficiency of the system. The storage tank was
constructed from thin steel material to minimise cost. However, the water weight and
pressure inside the storage tank tended to deform the plate. To prevent deformation,
fins were used to connect the back and front plates of the storage tank (Figure 2.5).
These fins should be placed in a position that has a minimal influence on the velocity
of the storage water (Gertzos & Caouris 2008).
Gertzos and Caouris (2008) investigated four parameters that have effect on the
mean water velocity in the tank, and hence on the outlet service water temperature.
These parameters are the inlet and outlet position of circulating pump (number 6 and
7 in Figure 2.2), the diameter of the inlet and outlet of the circulating tube and the
Marwaan AL-Khaffajy 25 condition assuming that the circulating water mass flow rate was 900 L/h, the storage
water temperature was constant at 60oC and for two service water inlet
temperatures’; 15 and 20 o C.
Figure 2.5: A storage tank with a fin joining the front and back surface
Gertzos and Caouris (2008) found that the influence of the inlet diameter and
position of the circulating water on the storage water velocity are more important
than the influence of the outlet diameter and its position.The optimum inlet diameter
was 8 mm, while the optimum position was 100 mm from the top right side. The
optimum position of the outlet was 337.5 mm from the lower left side (Figure 2.2).
For the interconnecting fins, they found that the case using five fins of 10 cm length
(f.1-f.5 in Figure 2.6) was the best option. If extra strength is required, the case of
nine fins with 5 cm length (f.1-f.5 and f.6-f.9) was found to the second best option.
The optimal arrangement of the interconnecting fins and the circulating pump inlet
and outlet led to increase in the main storage water velocity by 65 % which in turn
increased the outlet service water temperature by 8o C.
Marwaan AL-Khaffajy 26 Figure 2.6: Optimal arrangement of the connecting fins position (Gertzos & Caouris 2008)
2.5.2 Heat Exchanger Design
The heat exchanger in the indirect heating system includes a storage tank which
contains the storage water and the service water tube through which the service water
flows. Gertzos, Caouris and Panidis (2010) investigated the effect of three
parameters in the model given earlier (Gertzos & Caouris 2008), with the presence of
a circulating pump (Figure 2.2). These parameters were the service water tube
positions relative to the tank wall, the tube length and the tube diameter. They
developed various steady CFD models to identify the optimum magnitude of these
Marwaan AL-Khaffajy 27 In regard to the tube placement, they investigated five different positions for the
service water tube (Figure 2.7). In Case 1, the tube was placed inside the tank
touching the upper and lower walls of the tank, while in Case 2, half of the tube was
placed outside the tank and half inside the tank. The advantage of Case 2 was to
increase the storage water velocity inside the tank because the tube resistance to the
storage water decreased in this case. As a result an increase in the heat transfer
coefficient can be obtained. The tube in Case 3 was soldered to the walls with the
aim of introducing better thermal conductivity. In Case 4, the tube was placed in the
middle of the tank depth and in Case 5, the tube at the top plate was placed across at
the middle between the tubes the lower plate of the tank.
For each case, a CFD model was developed to evaluate the outlet service water
temperature which was used as a measure for the thermal efficiency. They solved the
continuity, momentum and energy equation in steady state using the k-omega
turbulence model and used the following assumptions:
1. The storage water temperature was fixed at 60o C
2. The service water mass flow rate was chosen to be 300, 500 and 700 L/h
3. The inlet temperature was at 20o C
4. The circulating water mass flow rate was varied to 100, 450 and 810 L/h,
5. The service water tube diameter and length was 13 mm, 16.26 m respectively.
Cases 1, 3 and 5 provided the same outlet service water temperature, which was
Marwaan AL-Khaffajy 28 Case 1 and they had the same outlet service water temperature, Gertzos, Caouris and
Panidis (2010) rejected Case 3. Case 1 was found to be the optimum case because it
gave a slightly better result than Case 5 and its fabrication is simpler. Moreover, the
service water outlet temperature increased by 4-6o C as the circulating water flow
rate was increased by 350 L/h and decreased by 4-8o C as the service water flow rate
was decreased by 200 L/h.
Figure 2.7: Cases for HX placement
For the service water tube diameter, Gertzos, Caouris and Panidis (2010) examined
four inside diameters: 10, 13, 16 and 20 mm. They solved the continuity, momentum
and energy equation in a steady state condition. They used the same assumptions for
investigating the tube placement. The optimum tube diameter was found to be 16
mm, as it gave the highest outlet temperature. Case 1
Case 2
Case 5 Case 3
Marwaan AL-Khaffajy 29 In regard to the service water tube length, they examined the heat exchanger with
tube lengths of 16.26 m and 21.68 m. They investigated the system in a steady state
condition and found that in the case where the tube length was 21.68 m, the
difference between the average temperature of storage water and the outlet service
water varied between 1o C to 6o C for the service water mass flow rate 300 and 700
L/h, respectively. In this case, the tube diameter was 16 mm and the circulating water
mass flow rate was 810 L/h. They considered this temperature difference to be
acceptable for heat exchanger systems. Therefore, they concluded that there is no
need for a further increase in the tube length.
Gertzos, Caouris and Panidis (2010) developed a transient CFD simulation to
examine the behaviour of the system during a one hour period of the energy
withdrawal. They used the following assumptions:
1. The initial temperature of the storage water was 60o C
2. The service water mass flow rate was 500 L/h
3. The inlet temperature was 20o C
4. The circulating water mass flow rate was 810 L/h
5. The tube length was 21.68 m
6. The tube inside diameter was 16 mm
7. The tube position was as for Case 1.
Figure 2.8 presents the outlet temperature of the service water (Tout), the average
temperature of the storage water (Tta) and the temperature of the service water in the
middle of the tube length (Tmed) for a one hour period of energy withdrawal. During
Marwaan AL-Khaffajy 30 the outlet temperature of the service water was less than 4o C. The outlet temperature
decreases to 30o C after 20 min, whereas Tta and Tout are equal after 50 min.
Figure 2.8: Mean tank water, mean tubes water and service water outlet temperature (Gertzos, Caouris & Panidis 2010)
2.5.3 Corrugated Absorber
In the direct heating type, the service water flows through the collector and there is
no service water tube. Therfore, using a corrugated absorber instead of plain one can
increase the heat transfer between the absorber and the service water. Kumar and
Rosen (2010) studied the effect of introducing a corrugated absorber surface for the
direct heating integrated collector storage solar water heating system. Introducing a
corrugated absorber surface increased the area in contact with the service water side
(Figure 2.9), and hence increased the system operating temperature and increased the
Marwaan AL-Khaffajy 31 changed from 0.4 to 1 mm, the maximum service water temperature increased from
53 to 64o C. In contrast, increasing the operating temperature resulted in an increase
in heat loss, which in its turn reduced efficiency. According to this study, the
efficiency reduction was marginal and could be overcome by continuous water
withdrawal from the system. Kumar and Rosen (2010) concluded that the
performance of the integrated solar collector is better when using a corrugated
absorber than when using a plain absorber.
Figure 2.9: Cross-section of direct heating system with corrugated absorber
2.6 The Heat Exchanger in other Applications
As the heat exchanger is a major component in the indirect heating system, this
section is devoted to summarising research conducted on general heat exchangers.
The heat exchanger is defined as an apparatus in which heat transfers between a
warmer and colder substance, usually fluids (Kreith, Frank & Bohn 2001, p. 485).
There are two important factors when designing a heat exchanger: the economic Glass Cover
Water Corrugated Absorber
Marwaan AL-Khaffajy 32 factor which is important in every engineering design, and the thermal performance
of the heat exchanger. Gebreslassie et al. (2010) proposed a general equation
(equation 2.1) for a thermal system to estimate the optimal area of a heat exchanger
considering both economic and thermal factors. This equation depends on parameters
directly related to the heat exchanger. These parameters are cost, the overall heat
transfer coefficient, the logarithmic mean temperature difference and the heat
transfer rate. Thus, it indicates how the area should be changed if these parameters
are modified.
The geometry of the heat exchanger, the temperature of the cold and hot fluid, and
the velocity of the fluid affects the thermal performance of the heat exchanger.
Prabhanjan, Raghavan and Rennie (2002) compared the heat transfer rates of a
straight tube heat exchanger and a helical tube heat exchanger. They concluded that
the heat transfer coefficient is also affected by the geometry of the heat exchanger.
Mellouli et al. (2007) examined experimentally the effect of using a spiral heat
exchanger in a metal-hydrogen reactor (Figure 2.10). The reactor consists of a
cylindrical stainless steel tank containing 1 kg of LaNi5 (hydride bed). The benefit of
using the spiral tube is that a centrifugal force is generated as the fluid flows through
a carved tube. This force can cause a significant increase in the heat transfer rate
(Mellouli et al. 2007).
Marwaan AL-Khaffajy 33 Figure 2.10: Geometrical configuration of a reactor. (a) Burst sight of the reactor; (b)
Cross-section of the reactor (Mellouli et al. 2007)
2.7 Research Gap
More research is needed to improve the performance of the integrated collector
storage solar water heating system, reduce its operating cost and introduce a system
with a more aesthetic configuration (Smyth, Eames & Norton 2006). Studies of the
indirect heating system are limited, and of these only a small number refer to the heat
transfer in the indirect heating system. For example, Gertzos, Pnevmatikakis and
Caouris (2008) examined experimentally and numerically the outlet service water
temperature in a heat exchanger (storage and service water) of an indirect heating
system with and without agitating the storage water. They found that when the
storage water was static, the difference between the average temperature of the
storage water and the outlet service water temperature was between 15o and 20o C.
When the storage water was moved using a circulating pump, the temperature
Marwaan AL-Khaffajy 34 2008). The low temperature difference between the storage water and the outlet
service water means that the heat transfer between the two fluids is high.
Gertzos and Caouris (2008) and Gertzos, Caouris and Panidis (2010) achieved the
optimum value of the interconnecting fin placement, service water tube position
relative to the tank wall, and the diameter and length of the service water tube for the
system with circulating pump. Consequently, the temperature difference decreased to
4o C, which is acceptable in heat exchanger design (Gertzos, Caouris & Panidis
2010).
Kumar and Rosen (2011) found that using a double glass cover is an effective
strategy for reducing the heat losses, and that the heat gained from the solar radiation
was the same whether using a single or double glass cover. To the author’s best
knowledge, the optimum air gap spacing in the integrated collector storage solar
water heating system with double glass cover has not been investigated.
This study will investigate numerically the optimum size of the upper and lower air
gap (Figure 1.12). In this investigation, the following assumptions were used:
1. The continuity, momentum and energy equations were numerically solved in a
steady state condition
2. The absorber temperature was assumed to be 82o C. This temperature is the
maximum temperature that the absorber surface can reach when solar incident
radiation is 850 W/m2 in the flat plate collectors (Gertzos & Caouris 2007).
This value was chosen mainly to identify the best air gap spacing that gives the
Marwaan AL-Khaffajy 35 determine the design parameters of the exchanger at the worst case scenario
(i.e. when the losses are at maximum).
3. The collector angle was chosen to be 45o from the horizontal
4. Radiation between surfaces was calculated by using the surface-to-surface
(S2S) radiation model.
The previous studies in the indirect heating system by Gertzos and Caouris (2007);
Gertzos, Pnevmatikakis and Caouris (2008); Gertzos and Caouris (2008); Gertzos,
Caouris and Panidis (2010) investigated heat transfer in the heat exchanger. Namely,
the heat transfer between the storage and service water. They used the assumptions
that the temperature of the storage water was fixed at 60o C for the steady state
investigation. While for the transient investigation, the initial temperature of the
storage water of 60o C or 80o C was used. The present study will investigate the heat
exchanger in the indirect heating system using different assumptions:
1. The whole collector (double glass covers and heat exchanger) were included in
the calculations
2. A circulating pump of the storage water was not used
3. The absorber surface temperature was assumed to be 60o C, as an average
absorber temperature.
In the heat exchanger investigations, these assumptions were considered to be more
realistic than the previous studies’ assumptions because:
Marwaan AL-Khaffajy 36 2. Based on energy balance, the absorber temperature can reach 60o C when solar
incident radiation is 650 W/m2, but there is no evidence that the whole system
can reach this temperature
3. The average absorber temperature was chosen to identify the best heat
exchanger configurations at average incident radiation.
Therefore, to investigate the best heat exchanger design assuming that, the absorber
temperature is constant at 60o C and including the effect of the double glass covers
Marwaan AL-Khaffajy 37
CHAPTER 3: Mathematical Model
Introduction
The Governing Equations
Computational Fluid Dynamics (CFD)
The Advantages of Using CFD
Approaches
Types of Flow
Turbulence Modelling
The Use of CFD Software
Chapter Conclusion
3.1 Introduction
The objective of the present study is to numerically investigate ways to improve the <