Developing a Method to Accurately Estimate the Electricity
Cost of Grid-Connected Solar PV in Doha
Ahmad Zahedi
College of Science, Technology and Engineering, James Cook University, Australia [email protected]
Abstract: Solar photovoltaic electricity is more expensive compared with conventional electricity at retail level. As a result, general public members do not find the solar PV electricity an attractive option to use for generating a portion of their electricity need. To promote PV electricity utilization and to make it more attractive, Governments of some countries like Germany, Japan, USA, Australia, and etc. have introduced solar PV incentive programs. Most of grid-connected photovoltaic (PV) systems on residential or commercial buildings in these countries are installed by individuals interested in generating part of their electricity emission-free. For some of these people the economics of the PV electricity is likely to be of secondary importance, while majority of them would like to see financial return to become interested to use PV electricity. The objective of this paper is to present the results of a study conducted on the economic aspects of solar PV to estimate the electricity price of grid-connected rooftop PV system under climate conditions and geographical location of Doha, to see if the use of PV electricity is attractive and affordable by residential customers. The results of this study will help to determining an appropriate feed-in tariff for solar PV electricity in Doha.
Keywords- Economic aspect; electricity; solar photovoltaic
Introduction
Worldwide, power sector provides 18,000 terawatt-hours of electric energy every year, around 40% of world’s total energy use. In doing this it produces more than 10 giga-tonnes of carbon dioxide every year, the largest sector contribution of humanity's fossil-fuel derived emissions (Gilbert, 2004).
Obviously, the easiest way to cut the carbon released by electricity generation is to increase efficiency of electric appliances and electric systems. But there are limits to such gains, and there is the familiar paradox that greater energy efficiency can lead to greater energy consumption. Thus, the response to reduce emissions released by electricity generation and reduction of climate change must involve a move to de-carbonizing power sector and using carbon-free sources of electricity. This requires serious thinking about the extensive use of new and renewable energy sources and technologies such as solar and wind.
Solar Energy
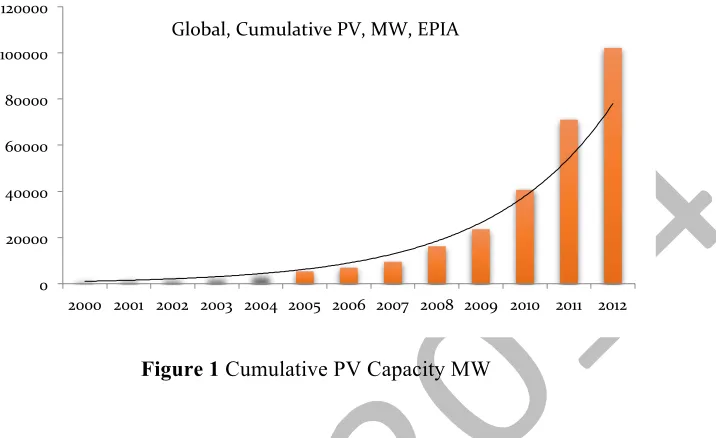
Solar energy is a vast and largely untapped resource. The World Energy Council estimates the earth’s surface, on average, has the potential to capture around 5.4 GJ (1.5 MWh) of solar energy every year. Solar energy accounted for 0.1% of the world’s total primary energy consumption in 2007, although its use has increased significantly in recent years (Global wind energy outlook 2011).
been shown in Figure 1. According to this Figure, installation of solar PV system has been growing at an annual average of more than 25% since 2000.
Figure 1
Cumulative PV Capacity MW
Solar PV technology converts sunlight directly into electricity using photovoltaic phenomena. PV systems can be installed on rooftops, integrated into building designs, or scaled up to megawatt scale power plants. PV systems can also be used in conjunction with concentrating mirrors or lenses for large scale centralised power.
The amount of solar energy incident on the world’s land area far exceeds total world energy demand. Solar energy thus has the potential to make a major contribution to the world’s energy needs. However, large scale solar energy production is currently limited by its high capital cost.
The cost issues related to solar energy has always been a major negative point for solar energy in general and solar photovoltaic in particular. Increasing manufacturing capacity has led to remarkable reduction in cost of solar PV electricity, but the PV electricity production cost is still far above the electricity price from conventional energy technologies.
This price difference is very high particularly in those countries, where price of electricity from conventional power plants is relatively low. Government policies investment costs and risks are projected to be the main factors underpinning future growth in world solar energy use (Global wind energy outlook, 2011).
Solar energy, although expensive but it has the potential to play a crucial role in the world’s energy supply, now and in the future (Renewable Energy World, 2013, and Heydt, 2010). The last five years has been a period when PV energy changed from being a small-scale contributor to energy supply to being a more substantial one, and the next five years look like being a period when the technology could have an even more substantial impact.
Cost calculations show that even in sunniest place it is impossible for PV to be able to compete with conventional electricity without reasonable government subsidies or reasonable fee-in tariff.
Solar radiation is intermittent because of daily and seasonal variations. However, the correlation between solar radiation and daytime peak electricity demand means that solar energy has the potential to provide electricity during peak demand times. Photovoltaic systems are well suited to off-grid electricity generation applications, and where costs of electricity generation from other sources are high (such as in remote communities). Relatively high capital costs and risks remain the primary limitation to more widespread use
0" 20000" 40000" 60000" 80000" 100000" 120000"
Solar Exposure in Doha
The potential for using solar energy at a given location depends largely on the solar radiation, the proximity to electricity load centres, and the availability of suitable sites. The annual solar resource varies considerably around the world. These variations depend on several factors, including proximity to the equator, cloud cover, and other atmospheric effects.
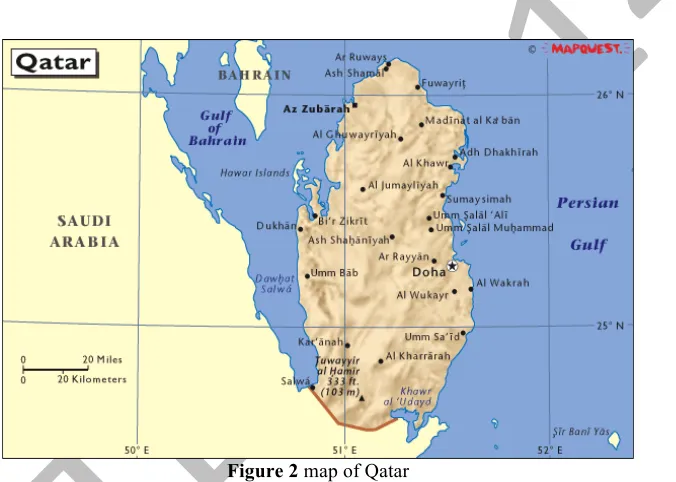
The amount of solar power available per unit area, which is known as irradiance or radiant flux density, varies with latitude, longitude, elevation and season of the year in addition to time in a particular day. Sun radiation data used in this study are the data valid for latitude and longitude of Doha. Latitude of Doha is 25.28o N, and longitude of Doha is 51.52o E. This has been shown in Figure 2. The amount of sun radiation received in Doha is between 14.44 MJ/m2 in August to 23.44 MJ/m2 in March with the annual average of 19.66 MJ/m2 [3]. This has been shown in the Table 1. It is important to mention that unlike high latitude regions the seasonal sunlight hour changes are not significant. This means, Doha receives the sun radiation relatively uniform throughout the whole year.
Figure2 map of Qatar
Table 1: Monthly Averaged Radiation Incident On An Equator-Pointed Tilted Surface (kWh/m2/day) of
Doha
Tilt:25
oJan
Feb
Mar
Apr
May
Jun
kWh/m
24.17
4.99
5.19
5.68
6.32
6.51
MJ/m
215.01 17.96 18.68 20.45 22.75 23.44
Jul
Aug
Sep
Oct
Nov
Dec
Ave.
6.28
6.23
6.05
5.57
4.55
4.01
5.46
[image:3.612.147.485.255.496.2]Solar PV Production Estimation
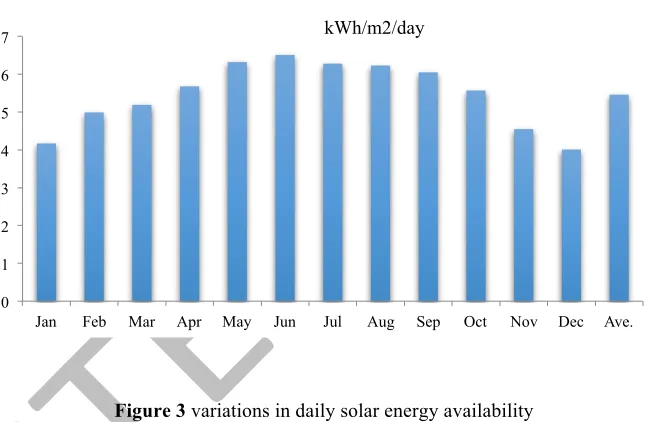
The sun data for Doha, which were provided by NASA, give the average daily solar exposure for each month and the year. Typical values for daily global solar exposure range between 14 MJ/m2 and 23 MJ/m2 (mega-joules per square meter per day). For high latitudes of Doha, the values are usually highest in clear sun conditions during June, July, and August and lowest during November, December, and January. This has been shown in Figure 3.
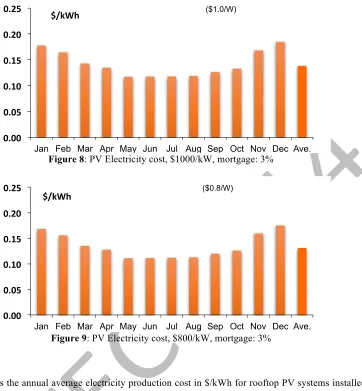
[image:4.612.144.467.300.511.2]Cost calculation of grid-connected solar PV electricity in Doha as the main objective of this paper for the purpose of determining the actual production cost of PV electricity. The results of this calculation gives idea about what the reasonable feed-in tariff for Doha would be. These results have been presented in the Figures 4 to 9 for different assumptions in installation cost. Figures 4, 5, and 6 show the solar PV production cost for 3 different installation costs (for example) from $12,00, $1,000 and $800 installation cost for a 1 kW PV system for mortgage rate of 5%, while Figures 7, 8, and 9 show the solar PV production costs for different installation costs $12,00, $1,000 and $800 for a one kW PV system for mortgage rate of 3%.
Figure 3 variations in daily solar energy availability
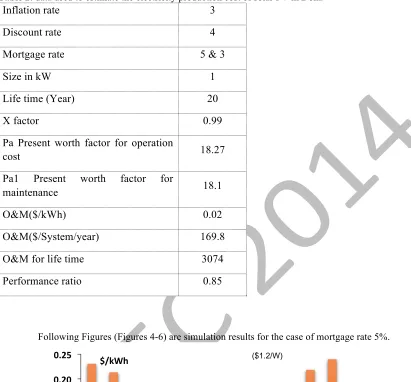
Time value of money has been considered in this study, assuming Inflation rate: 3%, Discount rate: 4%, Mortgage rate: 5% and 3% (it is assumed that fund to install PV system is borrowed from a bank).
Table 2 shows the information and data used to estimate the electricity production cost of solar PV in Doha for different capital upfront costs.
As solar PV power generation is investment capital intensive, so the mortgage rate, at which the money is borrowed from a financial institute, has significant effect on solar PV electricity production cost. For this reason simulation results show for 2 different mortgage rates namely 5% and 3%.
0 1 2 3 4 5 6 7
Jan Feb Mar Apr May Jun Jul Aug Sep Oct Nov Dec Ave.
Table 2: data used to estimate the electricity production cost of solar PV in Doha
Inflation rate
3
Discount rate
4
Mortgage rate
5 & 3
Size in kW
1
Life time (Year)
20
X factor
0.99
Pa Present worth factor for operation
cost
18.27
Pa1 Present worth factor for
maintenance
18.1
O&M($/kWh)
0.02
O&M($/System/year)
169.8
O&M for life time
3074
Performance ratio
0.85
[image:5.612.107.461.457.600.2]Following Figures (Figures 4-6) are simulation results for the case of mortgage rate 5%.
Figure 4: PV Electricity cost, $1200/kW, mortgage: 5%
0.00" 0.05" 0.10" 0.15" 0.20" 0.25"
Jan Feb Mar Apr May Jun Jul Aug Sep Oct Nov Dec Ave.
Figure 5: PV Electricity cost, $1000/kW, mortgage: 5%
Figure 6: PV Electricity cost, $800/kW, mortgage: 5%
[image:6.612.133.458.490.653.2]Following Figures (Figures 7-9) are simulation results for the case of mortgage rate 3%
Figure 7: PV Electricity cost, $1200/kW, mortgage: 3%
0.00" 0.05" 0.10" 0.15" 0.20" 0.25"
Jan Feb Mar Apr May Jun Jul Aug Sep Oct Nov Dec Ave.
$/kWh" ($1.0/W)
0.00" 0.05" 0.10" 0.15" 0.20" 0.25"
Jan Feb Mar Apr May Jun Jul Aug Sep Oct Nov Dec Ave.
$/kWh" ($0.8/W)
0.00" 0.05" 0.10" 0.15" 0.20" 0.25"
Jan Feb Mar Apr May Jun Jul Aug Sep Oct Nov Dec Ave.
Figure 8: PV Electricity cost, $1000/kW, mortgage: 3%
Figure 9: PV Electricity cost, $800/kW, mortgage: 3%
[image:7.612.145.507.75.466.2]Table 3 shows the annual average electricity production cost in $/kWh for rooftop PV systems installed in Doha. The figures shown in this Table are simulation results of a computer program developed by the author. In this simulation it has been assumed that the installed unit if a 1kW system and installation cost ranges from AD$1200 to AD$400 depending on the quality of PV products.
Table 3
: Annual average solar PV electricity cost for different PV installation costs
In $1000 /
5kW Peak
Mortgage:3%
Mortgage: 5%
1.2
0.15
0.18
1.1
0.14
0.17
1
0.14
0.17
0.9
0.13
0.17
0.8
0.13
0.16
0.7
0.13
0.16
0.00" 0.05" 0.10" 0.15" 0.20" 0.25"
Jan Feb Mar Apr May Jun Jul Aug Sep Oct Nov Dec Ave.
$/kWh" ($1.0/W)
0.00" 0.05" 0.10" 0.15" 0.20" 0.25"
Jan Feb Mar Apr May Jun Jul Aug Sep Oct Nov Dec Ave.
0.6
0.12
0.15
0.5
0.12
0.15
0.4
0.12
0.14
Conclusions
This paper has presented the results of a study conducted to estimate an accurate unit price of solar PV electricity ($/kWh) in Doha. The PV electricity prices obtained in this study are based on the location-dependent sun radiation data as well as country’s economic factors. As one can see from the Figure 4 to 9, the cost of PV electricity is most probably far above the conventional electricity price. In order to make solar PV utilization attractive to the public, the Qatar’s Government needs to offer high incentive or to develop an attractive feed-in tariff to encourage house owners to come forward with interest of using rooftop solar PV systems. In conclusion, the government policy settings will continue to be an important factor in the solar energy market outlook. Research, development and demonstration by both the public and private sectors will be crucial in accelerating the development and commercialization of solar energy, especially large-scale solar power stations.
References
Gilbert M. Masters, “Renewable and Efficient Electric Power Systems”, Wiley and Inter-science, 2004 Global wind energy outlook 2011
GWEC Annual Report 2011
Shin Ichi Inage, “Modeling load shifting using electric vehicles in a smart grid environment”, International Energy Agency (IEA), 2010
Renewable energy world/Wind, 2013 http://www.renewablwenergyworld.com/rea/home
Heydt, G.T., “The Next Generation of Power Distribution Systems”, IEEE Transactions on Smart Grid, volume 1, issue 3, 2010