nutrients
ISSN 2072-6643 www.mdpi.com/journal/nutrients ArticleA Comparison of Regular Consumption of Fresh Lean Pork,
Beef and Chicken on Body Composition: A Randomized
Cross-Over Trial
Karen J. Murphy 1,*, Barbara Parker 2, Kathryn A. Dyer 1, Courtney R. Davis 1, Alison M. Coates 1, Jonathan D. Buckley 1 and Peter R. C. Howe 1,3
1 Nutritional Physiology Research Centre, University of South Australia, GPO Box 2471 Adelaide,
South Australia 5001, Australia; E-Mails: kate.dyer@unisa.edu.au (K.A.D.);
courtney.davis@mymail.unisa.edu.au (C.R.D.); alison.coates@unisa.edu.au (A.M.C.); jon.buckley@unisa.edu.au (J.D.B.)
2 School of Nursing and Midwifery, University of South Australia, GPO Box 2471 Adelaide,
South Australia 5001, Australia; E-Mail: barbara.parker@unisa.edu.au
3 Clinical Nutrition Research Centre, University of Newcastle, Callaghan, NSW 2308, Australia;
E-Mail: peter.howe@newcastle.edu.au
* Author to whom correspondence should be addressed; E-Mail: karen.murphy@unisa.edu.au; Tel.: +61-8-8302-2097; Fax: +61-8-8302-2853.
Received: 15 January 2014; in revised form: 7 February 2014 / Accepted: 7 February 2014 / Published: 14 February 2014
Nutrients 2014, 6 683
intakes between diets. After three months, regular consumption of lean pork meat as compared to that of beef and chicken results in similar changes in markers of adiposity of overweight and obese Australian middle-aged men and women.
Keywords: pork; beef; chicken; body composition; energy intake; DEXA
Abbreviations: BMI, body mass index; CHD, coronary heart disease; CV, cardiovascular; DEXA, dual energy xray absorptiometry; FFQ, food frequency questionnaire; SEM, standard error of mean; SD, standard deviation; WC, waist circumference; WHR, waist to hip ratio.
1. Introduction
The global prevalence of obesity is increasing [1–3]. In Australia 63% of the population is overweight or obese [4]; this poses a major health concern as obesity clusters with other cardiovascular (CV) risk factors including type 2 diabetes, hypertension, hypercholesterolemia, poor mental health and physical disability, increasing risk of mortality [5]. Key strategies employed to reduce weight involve lifestyle intervention including caloric restriction and regular exercise. Particular dietary strategies shown to be effective for weight loss include energy restricted high protein diets [6–9] and using lean beef as the major protein source [8]. Until recently there has been an almost complete absence of research examining the consumption of pork and potential health benefits. This is surprising given it is the most widely eaten meat in the world [10]. In the past meat generally was perceived as a high fat food and consequently was subject to concerns regarding its potential adverse impact on health [11,12], whereas lean meat is actually low in fat and an important source of protein, iron, vitamins and minerals. There is little evidence to explain why pork consumption is low in Australia; Australians mainly consume beef and chicken. Pork is a good source of protein and recent evidence has shown that lean pork may provide CV and metabolic health benefits [13,14].
control groups but this was not significantly different. Despite these reductions in dietary intake in both groups, there were only improvements in body composition in the pork group. However, it was not possible to determine if the changes in body composition were specific to pork consumption or whether regular consumption of other high protein meats may have had the same benefit. There appears to be little difference between the nutrient (including amino acid) profile of pork and other commonly studied meats (e.g., beef, chicken etc.) [15], hence we sought to compare the effect of regular consumption of lean pork with that of two other commonly consumed meats in the Australian diet, namely chicken and beef, on indices of adiposity. Given there is little nutritional compositional difference between pork, beef and chicken, we did not expect any difference in body composition between the three meat groups.
2. Subjects and Methods 2.1. Participants
Free-living overweight/obese, non-smoking men and women were recruited through local media advertisements to participate in a nine month, randomised, cross-over trial. Participants were excluded if they reported one of the following: diagnosed diabetes or CV disease; history of myocardial infarction or stroke; peripheral vascular disease; blood pressure >160/100 mmHg; liver or renal disease; anti-inflammatory, hypothyroidism, antihypertensive or hypocholesterolemic drug therapy that was not stable in the previous three months; eating >100 g fresh pork per week; inability to consume pork as required. The first eligible participant was allocated at random to one of the three meats. Subsequently, eligible participants were stratified according to gender, BMI and age by the process of minimization [16]. This study was conducted according to the guidelines laid down in the Declaration of Helsinki and all procedures involving human participants were approved by the Human Research Ethics Committee (22 June 2010) at the University of South Australia, Adelaide, Australia. Written informed consent was obtained from all participants. The trial was registered on the Australia New Zealand Clinical Trials Register (ACTRN12610000612011, 28 July 2010).
2.2. Study Design
Nutrients 2014, 6 685
Figure 1. Consort diagram.
2.3. Dietary Intervention
including lean beef or pork steak or chicken breast, stir fry, diced and mince. All participants kept a weekly log of study meat consumption.
2.4. Dietary Intake
Participants were asked to record their dietary intake (consecutive two weekdays/one weekend day) in a semi-quantitative 3-day weighed food record at baseline and then at the mid-point of each three month period. Participants were asked to weigh and measure their food using scales provided. Dietary composition was analysed using a computerised database (Foodworks Professional Edition, 2009 using food composition data from AUSNUT 2007 and NUTTAB 2006; Xyris Software, Highgate Hill, Australia) where updated nutrient profiles of the study pork, beef and chicken were added to generate values for energy, macro and micronutrient consumption. The energy, moisture, ash and macronutrient composition of the meats were initially analysed by the National Measurement Institute (Victoria, Australia) to match energy composition to determine portion sizes of each type of meat. Throughout the intervention fat content was monitored from batch to batch in our laboratory using a modification of the Bligh and Dyer [17] method. An average of values determined from different batches was used to determine the study meat profile. Frequency of consumption of energy and macro and micronutrients were estimated using a 74-item food frequency questionnaire (FFQ) [18] at baseline and at the end of each meat phase. The FFQ requests information relating to food choices, portion size, quantity and consumption frequency of different food and beverage items and is a validated and reliable measure of dietary intake for use in epidemiological studies within the Australian population [19–21]. Compliance was assessed by comparison of daily meat consumption logs and 3-day weighed food records and FFQ collected at baseline and at the end of each meat phase.
2.5. Physical Activity
Participants recorded a diary of all physical activity conducted in a 24 h period over three days (two weekdays and one weekend day) [22]. Energy expenditure (kcal) was then calculated for every 15 min period in a 24 h day according to nine categories of different types of activity (e.g., sleeping, playing sports, gardening etc.) and multiplied by the appropriate physical activity level factor for the reported intensity of exercise. This was multiplied by body weight and then averaged for three days [22].
2.6. Body Mass Index and Body Composition
Nutrients 2014, 6 687
top of the iliac crest, with the lateral borders extending to the edge of the abdominal soft tissue, and the upper margin 20% above the pelvis between the pelvis and the neck borders.
2.7. Statistical Analysis
Based on previous determinations of the variance in the primary outcome measure (change of % body fat from baseline to three months), we estimated that a total of 51 participants would give 80% power to detect a significant (p < 0.05) 1% difference in change in percentage body fat between dietary treatments or a 2 kg change in body weight at an alpha level of 0.05. Data of participants who completed the trial were checked for normality and then analysed using Random-effects GLS Regression to identify differences between means where significant main effects were seen. Analysis focused on changes in indices of adiposity at the end of each dietary phase using STATA Statistics Data analysis 11 (StataCorp, Texas, USA). Data are presented as means ± SEM (standard error of mean). To allow for multiple comparisons, significance was set at p < 0.003 for dietary intake data and p < 0.006 for anthropometry and body composition data.
3. Results
3.1. Participant Characteristics
[image:6.595.118.478.613.767.2]75 participants were enrolled from the 101 participants deemed eligible, to allow for an approximate 40% withdrawal rate. Of the 75 participants who were enrolled in the intervention, 11 withdrew prior to commencement (due to change of mind and increased personal commitments) and 15 withdrew after commencement (Figure 1). Reasons for withdrawal included inability to commit to the study (n = 5), personal illness (n = 4), relocated interstate (n = 2) increased time commitments (n = 3) and one participant was withdrawn due to lack of compliance with the protocol. Thus 49 participants completed the full 9-month intervention period with characteristics presented in Table 1. This population were on average middle aged (50 ± 2 years), obese (BMI 30.5 ± 0.5 kg/m2) with waist circumferences (WC) above the recommended cut off point (103 ± 11 cm) [5,24]. 49% of the population was obese and 51% overweight.
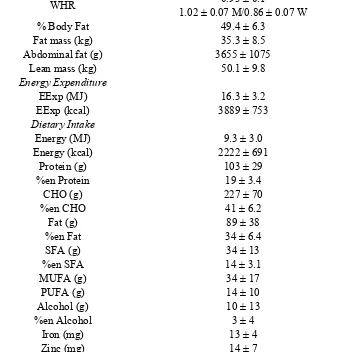
Table 1. Gender, age, anthropometric measurements, body composition, daily dietary intake and energy expenditure of study population at baseline.
Mean ± SD
Gender n 24 M/25 W
Age (years) 50 ± 2
Height (m) 1.72 ± 0.1
Weight (kg) 90 ± 14
BMI (kg/m2) 30.5 ± 3.6
WC (cm) 102.6 ± 11.3
108.5 ± 8.2 M/96.9 ± 11.0 W
HC (cm) 110.3 ± 10.1
Table 1.Cont.
WHR 0.93 ± 0.1
1.02 ± 0.07 M/0.86 ± 0.07 W
% Body Fat 49.4 ± 6.3
Fat mass (kg) 35.3 ± 8.5
Abdominal fat (g) 3655 ± 1075
Lean mass (kg) 50.1 ± 9.8
Energy Expenditure
EExp (MJ) 16.3 ± 3.2
EExp (kcal) 3889 ± 753
Dietary Intake
Energy (MJ) 9.3 ± 3.0
Energy (kcal) 2222 ± 691
Protein (g) 103 ± 29
%en Protein 19 ± 3.4
CHO (g) 227 ± 70
%en CHO 41 ± 6.2
Fat (g) 89 ± 38
%en Fat 34 ± 6.4
SFA (g) 34 ± 13
%en SFA 14 ± 3.1
MUFA (g) 34 ± 17
PUFA (g) 14 ± 10
Alcohol (g) 10 ± 13
%en Alcohol 3 ± 4
Iron (mg) 13 ± 4
Zinc (mg) 14 ± 7
Dietary intake was captured using 3-day weighed food records and energy expenditure was estimated using three day physical activity diaries.
3.2. Pork, Beef and Chicken Consumption
Nutrients 2014, 6 689
Figure 2.Average meat and fish consumption (grams per day ± SEM) from the Cancer Council of Victoria Food Frequency Questionnaire at baseline and for each dietary phase (beef, pork, chicken) n = 49.
SEM, standard error of the mean. a Total meat consumption is the sum of: pork + beef + chicken + veal + lamb + bacon + ham + sausages + salami + fish +
fried fish + tinned fish; b Total fish consumption is the sum of: fish + fried fish + tinned fish; c Total “other meat” consumption is the sum of: pizza + pasta
Table 2. Mean values for energy and nutrient intake from weighed food records * at the end of each diet phase (Pork, Beef, Chicken), n = 49 and difference between meats (95% confidence intervals).
Pork Beef Chicken ΔBeef-Porka P value ΔChicken-Porkb p value
Energy (kJ) 8830 ± 373 8414 ± 383 8370 ± 392 −416 (−1119, 286) 0.245 −460 (−1162, 242) 0.199 Energy (kcal) 2111 ± 89 2011 ± 92 2001 ± 94 −100 (−267, 68) 0.245 −110 (−278, 58) 0.199 Protein (g) 103 ± 4 104 ± 4 100 ± 5 0.8 (−7.2, 8.8) 0.848 −2.9 (−10.9, 5.1) 0.475 %en Protein 20 ± 0.5 21 ± 0.5 21 ± 0.5 1.2 (0.1, 2.3) 0.036 0.5 (−0.6, 1.7) 0.343 CHO (g) 218 ± 10 207 ± 12 201 ± 10 −10.8 (−32.2, 10.7) 0.325 −16.8 (−38.3, 4.7) 0.125 %en CHO 42 ± 1 41 ± 1 40 ± 1 −0.8 (−3.1, 1.4) 0.472 −1.4 (−3.6, 0.8) 0.222 Fat (g) 77 ± 5 71 ± 5 75 ± 5 −5.7 (−14.6, 3.2) 0.207 −1.2 (−10.1, 7.7) 0.789 %en Fat 31 ± 1 30 ± 1 33 ± 1 −0.8 (−2.8, 1.3) 0.458 1.5 (−0.6, 3.5) 0.157 SFA (g) 30 ± 2 27 ± 2 29 ± 2 −3.5 (−8.0, 1.0) 0.128 −0.9 (−5.4, 3.6) 0.689 %en SFA 12 ± 0.6 11 ± 0.5 13 ± 0.5 −0.9 (−2.1, 0.2) 0.104 0.3 (−0.8, 1.5) 0.573 MUFA (g) 30 ± 2 27 ± 2 29 ± 2 −2.3 (−6.3, 1.8) 0.272 −1.0 (−5.1, 3.0) 0.615 PUFA (g) 11 ± 1 12 ± 1 12 ± 1 0.3 (−1.3, 1.8) 0.714 1.2 (−0.4, 2.7) 0.143 Alcohol (g) 14 ± 3 12 ± 2 10 ± 3 −1.7 (−5.4, 2.0) 0.366 −3.2 (−6.9, 0.5) 0.089 %en Alcohol 4.3 ± 0.8 4.5 ± 0.9 3.5 ± 0.8 0.2 (−0.9, 1.2) 0.732 −0.8 (−1.8, 0.3) 0.139 Iron (mg) 12.3 ± 0.5 14.0 ± 0.7 11.9 ± 0.6 1.7 (0.5, 2.9) 0.005 −0.4 (−1.6, 0.8) 0.533 Zinc (mg) 11.6 ± 0.5 15.7 ± 0.8 11.5 ± 0.8 4.1 (2.4, 5.7) p < 0.0001 −0.2 (−1.8, 1.5) 0.844 EExp (MJ) 16.5 ± 0.5 16.2 ± 0.5 16.3 ± 0.5 −0.268 (−0.76, 0.22) 0.284 −0.086 (−0.58, 0.41) 0.734 EExp (kcal) 3933 ± 116 3870 ± 112 3903 ± 119 −64 (−182, 53) 0.284 −21 (−139, 98) 0.734
Nutrients 2014, 6 691
Table 3. Mean values for anthropometric measurements and body composition * at the end of each diet phase (Pork, Beef, Chicken), n = 49 and difference between meats (95% confidence intervals).
Pork Beef Chicken Difference between
Pork and Beef a p value
Difference between
Pork and Chicken b p value
Weight (kg) 89 ± 2 89 ± 2 89 ± 2.0 −0.003 (−0.609, 0.602) 0.991 −0.018 (−0.624, 0.587) 0.953 BMI (kg/m2) 30.1 ± 0.5 30.1 ± 0.5 30.1 ± 0.5 −0.009 (−0.223,0.205) 0.934 −0.006 (−0.220, 0.208) 0.957
WC (cm) 101.0 ± 1.6 101.3 ± 1.6 101.3 ± 1.6 0.360 (−0.455, 1.18) 0.387 0.314 (−0.501, 1.13) 0.450 HC (cm) 109.8 ± 1.5 109.3 ± 1.5 109.7 ± 1.4 −0.475 (−1.064, 0.115) 0.115 −0.148 (−0.738, 0.441) 0.622 WHR 0.925 ± 0.016 0.932 ± 0.016 0.929 ± 0.016 0.007 (0.0001, 0.014) 0.046 0.004 (−0.003, 0.011) 0.222 % Body Fat 49.0 ± 0.9 48.9 ± 0.9 49.0 ± 0.9 −0.02 (−0.558, 0.518) 0.942 0.052 (−0.486, 0.590) 0.850 Fat mass (kg) 35.3 ± 1.3 35.4 ± 1.3 35.4 ± 1.3 0.098 (−0.418, 0.613) 0.710 0.057 (−0.459, 0.573) 0.828 Abdominal fat (g) 3495 ± 149 3486 ± 149 3500 ± 147 −8.68 (−82.15, 64.79) 0.817 5.47 (−68.0, 78.94) 0.884 % Lean Mass 60.4 ± 1.0 60.3 ± 1.0 60.4 ± 1.0 −0.078 (−0.482, 0.327) 0.707 −0.008 (−0.413, 0.397) 0.968 Lean mass (kg) 53.7 ± 1.5 53.6 ± 1.5 53.6 ± 1.5 −0.096 (−0.445, 0.253) 0.590 −0.07 (−0.419, 0.280) 0.696
3.3. Dietary Intake and Physical Activity
Total energy and macronutrient intakes were adjusted for the nutrient profile of the provided pork, beef and chicken. There was no difference in intake of energy, macronutrients (total fat, protein or carbohydrate) or micronutrients in either group over time (Table 2) with the exception of zinc. The difference between the beef and pork group (p < 0.0001) most likely represents the greater zinc composition of beef (beef 3.7 mg/100 g vs. pork 1.7 mg/100 g, Foodworks Professional Edition). These data indicate that all participants were substituting meats in their diet without altering total energy or total protein intake. There was no difference in total energy expenditure (MJ/day) according to the physical activity diaries, indicating that participants did not change their physical activity levels and subsequent energy expenditure during the intervention (Table 2).
3.4. Body Composition
There was no difference in any index of adiposity, nor was there any change in lean mass, between groups over time (Table 3). While there was a slight reduction in WC and WHR in the pork group compared to beef and chicken groups (p = 0.046), these were not significant when allowing for multiple comparisons.
4. Discussion
Previous research has focused on relationships between the consumption of lean beef and increased satiety and weight loss [25] however several of these studies have utilised hypocaloric, high protein diets specifically designed for weight loss. Until recently there has been little research published demonstrating the cardiometabolic health benefits of consuming pork. Despite pork being the most frequently consumed meat in Europe, it is consumed less frequently than other meats in some cultures such as Australia. We can only speculate the reason why pork consumption is low in Australia, such as it may be perceived as a fattier and less healthy meat choice or be associated with increased disease risk (i.e., cardiovascular disease) [12]. For example a study by Lea and Worsley [26] surveyed 707 Australians (n = 601 omnivores, n = 106 vegetarians) and showed 10%–12% of non-vegetarian men and women (n = 540) thought red meat such as beef or lamb was fattening. While there is a lack of evidence linking pork with this perception, anecdotal evidence suggests that Australians may perceive pork as an unhealthy meat choice, which may explain why pork consumption is relatively low in Australia while beef and chicken are the major meats consumed [27].
Nutrients 2014, 6 693
pork compared with a customary diet [11]. The extremely small differences in the present study indicate that neither a larger study nor a longer intervention period would be likely to demonstrate differences in adiposity following consumption of these different meats matched for energy content.
Our study is in agreement with results from Melanson et al. [28] who conducted a 12-week randomised, controlled trial where overweight women consumed an energy restricted diet with either lean beef or chicken as the major protein source together with undertaking moderate exercise. The authors reported no difference in weight loss or % body fat or blood lipid profiles following a beef or chicken diet. Similarly, Mahon and colleagues [29] compared consumption of lean beef or chicken as the primary protein source in a hypocaloric diet in 61 obese females. These authors found no difference in the amount of weight loss, fat loss and reduction in low density lipoprotein cholesterol after 12 weeks consumption of either a chicken or beef diet. Similarly, a cholesterol-lowering study by Davidson et al. [30] compared a NCEP Step 1 diet (National Cholesterol Education Program Step 1 diet) containing 170 g of lean meat (pork, veal and beef) with a diet containing lean poultry and fish as the primary meat for 36 weeks. The authors showed no difference in the change in serum lipid levels between groups. Moreover Coates et al. [31] showed that consumption of 1 kg of fresh pork per week for 12 weeks did not change body weight. Finally an acute satiety study by Charlton and colleagues [32] compared the consumption of pork, beef and chicken on acute satiety and appetite regulatory hormones and showed no difference between meats.
5. Conclusions
We acknowledge limitations of this study, firstly of cross-over design and no implementation of a washout period. This design did not include a wash-out period as it was deemed that three months on each phase was sufficient for volunteers to reach steady state prior to the assessment conducted at the end of the three month meat phase. Secondly, there are well known limitations associated with collecting accurate dietary data hence why we collected FFQ data together with 3-day WFR and daily meat consumption logs to monitor compliance and calculate energy and nutrient intake.
The current study provides further evidence that three months of regular consumption of lean pork as compared to that of lean beef and chicken results in similar changes in body composition. Thus the perception that pork is an inferior meat in terms of nutrition should be reconsidered.
Author Contributions
KJM, PRCH, JDB, BP and AMC initiated and designed the study and secured the funding. KJM managed and co-ordinated the project, recruited subjects, conducted clinic sessions and performed statistical analyses and prepared the drafts of the paper. PRCH and JDB supervised the project. KAD and BP conducted clinic visits. AMC supervised the dietary analysis. CRD designed, administered and analysed questionnaires and assisted with clinical data collection. All authors contributed interpretation of the data and to the drafts of the publication and approved the submission. PRCH had primary responsibility for final content.
Acknowledgments
This study was funded by Australian Pork Ltd. and the Pork Co-operative Research Centre (Roseworthy, SA, Australia), an Australian Government funding initiative. The authors would like to thank Jasna Tepsic, Alice Murray and Adrian Esterman for their assistance with various aspects of the study. The authors also thank Graham Giles of the Cancer Epidemiology Centre of The Cancer Council Victoria, for permission to use the Dietary Questionnaire for Epidemiological Studies (Version 2), Melbourne: The Cancer Council Victoria, 1996. At the time the research was conducted Karen Murphy was a National Health and Medical Research Council (NHMRC) Industry Research Fellow.
Conflicts of Interest
The authors declare no conflict of interest.
References
1. Flegal, K.M.; Carroll, M.D.; Ogden, C.L.; Curtin, L.R. Prevalence and trends in obesity among US adults, 1999–2008. JAMA 2010, 303, 235–241.
2. Kelly, T.; Yang, W.; Chen, C.S.; Reynolds, K.; He, J. Global burden of obesity in 2005 and projections to 2030. Int. J. Obes. (Lond.) 2008, 32, 1431–1437.
Nutrients 2014, 6 695
4. Australian Bureau of Statistics. Australian Health Survey, Profiles of Health, Australia, Cat. No. 4338.0; ABS: Canberra, Australia, 2011–2013. Availiable online: http://www.abs.gov. au/ausstats/abs@.nsf/mf/4338.0?OpenDocument (accessed on 1 November 2013).
5. Alberti, K.G.; Zimmet, P.; Shaw, J. Metabolic syndrome—A new world-wide definition. A consensus statement from the international diabetes federation. Diabet. Med. 2006, 23, 469–480. 6. Brinkworth, G.D.; Noakes, M.; Keogh, J.B.; Luscombe, N.D.; Wittert, G.A.; Clifton, P.M. Long-term
effects of a high-protein, low-carbohydrate diet on weight control and cardiovascular risk markers in obese hyperinsulinemic subjects. Int. J. Obes. Relat. Metab. Disord. 2004, 28, 661–670.
7. Noakes, M.; Clifton, P. Weight loss, diet composition and cardiovascular risk. Curr. Opin. Lipidol. 2004, 15, 31–35.
8. Noakes, M.; Keogh, J.B.; Foster, P.R.; Clifton, P.M. Effect of an energy-restricted, high-protein, low-fat diet relative to a conventional high-carbohydrate, low-fat diet on weight loss, body composition, nutritional status, and markers of cardiovascular health in obese women. Am. J. Clin. Nutr. 2005, 81, 1298–1306.
9. Parker, B.; Noakes, M.; Luscombe, N.; Clifton, P. Effect of a high-protein, high-monounsaturated fat weight loss diet on glycemic control and lipid levels in type 2 diabetes. Diabetes Care 2002, 25, 425–430.
10. Resano, H.; Perez-Cueto, F.J.; de Barcellos, M.D.; Veflen-Olsen, N.; Grunert, K.G.; Verbeke, W. Consumer satisfaction with pork meat and derived products in five European countries. Appetite 2011, 56, 167–170.
11. Biesalski, H.K. Meat as a component of a healthy diet—Are there any risks or benefits if meat is avoided in the diet? Meat Sci. 2005, 70, 509–524.
12. Pereira, P.M.; Vicente, A.F. Meat nutritional composition and nutritive role in the human diet. Meat Sci. 2013, 93, 586–592.
13. Murphy, K.J.; Thomson, R.L.; Coates, A.M.; Buckley, J.D.; Howe, P.R. Effects of eating fresh lean pork on cardiometabolic health parameters. Nutrients 2012, 4, 711–723.
14. Wycherley, T.P.; Noakes, M.; Clifton, P.M.; Cleanthous, X.; Keogh, J.B.; Brinkworth, G.D. A high-protein diet with resistance exercise training improves weight loss and body composition in overweight and obese patients with type 2 diabetes. Diabetes Care 2010, 33, 969–976.
15. Giugliano, D.; Esposito, K. Mediterranean diet and metabolic diseases. Curr. Opin. Lipidol. 2008, 19, 63–68.
16. Altman, D.G.; Bland, J.M. Standard deviations and standard errors. BMJ 2005, 331, 903.
17. Bligh, E.G.; Dyer, W.J. A rapid method of total lipid extraction and purification. Can. J. Biochem. Physiol. 1959, 37, 911–917.
18. Giles, G.G.; Ireland, P.D. Dietary Questionnaire for Epidemiological Studies (Version 2); The Cancer Council Victoria: Melbourne, Australia, 1996.
19. Ambrosini, G.L.; van Roosbroeck, S.A.; Mackerras, D.; Fritschi, L.; de Klerk, N.H.; Musk, A.W. The reliability of ten-year dietary recall: Implications for cancer research. J. Nutr. 2003, 133, 2663–2668. 20. Hodge, A.; Patterson, A.J.; Brown, W.J.; Ireland, P.; Giles, G. The Anti Cancer Council of
21. Xinying, P.X.; Noakes, M.; Keogh, J. Can a food frequency questionnaire be used to capture dietary intake data in a 4 week clinical intervention trial? Asia Pac. J. Clin. Nutr. 2004, 13, 318–323. 22. Bouchard, C.; Tremblay, A.; Leblanc, C.; Lortie, G.; Savard, R.; Theriault, G. A method to assess
energy expenditure in children and adults. Am. J. Clin. Nutr. 1983, 37, 461–467. 23. Norton, K.; Olds, T. Anthropometrica; UNSW Press: Sydney, Australia, 1996.
24. Australian Government The Measure Up Campaign. Available online: http://www.measureup.gov .au/internet/abhi/publishing.nsf/Content/How+do+I+measure+myself-lp (accessed on 28 June 2013). 25. Adam-Perrot, A.; Clifton, P.; Brouns, F. Low-carbohydrate diets: Nutritional and physiological
aspects. Obes. Rev. 2006, 7, 49–58.
26. Lea, E.; Worsley, A. The cognitive contexts of beliefs about the healthiness of meat. Public Health Nutr. 2002, 5, 37–45.
27. McLennan, W.P.A. National Nutrition Survey 1995. Available online: http://www.abs.gov.au/ ausstats/abs@.nsf/mf/4802.0 (accessed on 1 November 2013).
28. Melanson, K.; Gootman, J.; Myrdal, A.; Kline, G.; Rippe, J.M. Weight loss and total lipid profile changes in overweight women consuming beef or chicken as the primary protein source. Nutrition 2003, 19, 409–414.
29. Mahon, A.K.; Flynn, M.G.; Stewart, L.K.; McFarlin, B.K.; Iglay, H.B.; Mattes, R.D.; Lyle, R.M.; Considine, R.V.; Campbell, W.W. Protein intake during energy restriction: Effects on body composition and markers of metabolic and cardiovascular health in postmenopausal women. J. Am. Coll. Nutr. 2007, 26, 182–189.
30. Davidson, M.H.; Hunninghake, D.; Maki, K.C.; Kwiterovich, P.O., Jr.; Kafonek, S. Comparison of the effects of lean red meat vs lean white meat on serum lipid levels among free-living persons with hypercholesterolemia: A long-term, randomized clinical trial. Arch. Intern. Med. 1999, 159, 1331–1338.
31. Coates, A.M.; Sioutis, S.; Buckley, J.D.; Howe, P.R. Regular consumption of n-3 fatty acid-enriched pork modifies cardiovascular risk factors. Br. J. Nutr. 2009, 101, 592–597.
32. Charlton, K.E.; Tapsell, L.C.; Batterham, M.J.; Thorne, R.; O’Shea, J.; Zhang, Q.; Beck, E.J. Pork, beef and chicken have similar effects on acute satiety and hormonal markers of appetite. Appetite 2011, 56, 1–8.
33. Santos-Garcia, D.; Blanco, M.; Castillo, J. The role of flow-mediated dilatation in ischemic stroke: Time for action. Eur. Neurol. J. 2010, 2, 35.
34. Micha, R.; Wallace, S.K.; Mozaffarian, D. Red and processed meat consumption and risk of incident coronary heart disease, stroke, and diabetes mellitus: A systematic review and meta-analysis. Circulation 2010, 121, 2271–2283.
35. Grunert, K.G. Future trends and consumer lifestyles with regard to meat consumption. Meat Sci. 2006, 74, 149–160.