energies
ISSN 1996-1073 www.mdpi.com/journal/energies ArticleBiodiesel Production from Non-Edible Beauty Leaf
(
Calophyllum inophyllum
) Oil: Process Optimization
Using Response Surface Methodology (RSM)
Mohammad I. Jahirul 1,*,Wenyong Koh 1, Richard J. Brown 1, Wijitha Senadeera 1, Ian O’Hara 2 and Lalehvash Moghaddam 2
1 Biofuel Engine Research Facility (BERF), Science and Engineering Faculty, Queensland University of Technology (QUT), Brisbane 4000, Australia;
E-Mails: wenyong.koh@connect.qut.edu.au (W.K.); richard.brown@qut.edu.au (R.J.B.); w3.senadeera@qut.edu.au (W.S.)
2 Centre for Tropical Crops and Biocommodities (CTCB),Queensland University of Technology (QUT), Brisbane 4000, Australia; E-Mails: i.ohara@qut.edu.au (I.O.); l.moghaddam@qut.edu.au (L.M.)
* Author to whom correspondence should be addressed; E-Mail: md_jahirul@yahoo.com or m1.islam@qut.edu.au; Tel.: +61-4-1380-9227.
Received: 20 January 2014; in revised form: 23 June 2014 / Accepted: 29 July 2014 / Published: 18 August 2014
30:1 methanol to oil molar ratio, 10% (w/w) sulfuric acid catalyst loading and 75 °C reaction temperature. In the alkali catalysed transesterification process 7.5:1 methanol to oil molar ratio, 1% (w/w) sodium methoxide catalyst loading and 55 °C reaction temperature were found to result in the highest FAME conversion. The good agreement between model outputs and experimental results demonstrated that this methodology may be useful for industrial process optimization for biodiesel production from beauty leaf oil and possibly other industrial processes as well.
Keywords: biodiesel; beauty leaf; transesterification; response surface methodology (RSM)
1. Introduction
The current global energy supply is heavily dependent on finite reserves of fossil fuels (oil, natural gas, coal) which represent 88% of total global energy consumption. Based on current production scenarios, it is expected that the peak of global oil production will occur between 2015 and 2030 [1]. Therefore, fossil resources have practical limitations in their capacity to supply future global energy requirements, and there are currently few large scale alternatives available. Moreover, combustion of fossil fuels results in greenhouse gas emissions and contributes to anthropogenic climate change. Despite global measures such as the Kyoto Protocol and scientific innovation, atmospheric CO2 concentration continues to increase and is exceeding benchmark levels much earlier than had previously been predicted [2].
With a growing world population, increasing energy consumption per capita, and the impacts of global warming resulting from greenhouse gas emissions, the need for long-term alternative energy source is acute [3–5]. Over the past few decades, biodiesel produced from oilseed crops and animal fat is receiving much attention as a renewable and sustainable alternative for automobile engine fuels, particularly for petroleum diesel [6]. It is currently produced in commercial quantities from edible oil feedstocks such as soybean, palm, rapeseed and canola oil. Biodiesels produced from these feedstocks are generally referred to as first generation biodiesels [7]. Although biodiesels from these feedstocks offer reductions in greenhouse gas emissions (GHG) and improve domestic energy security, first generation biodiesels are unlikely to be sustainable in the longer term due to land use impacts and the price and social impacts associated with using a food-based feedstock. Second generation biodiesels produced from non-edible feedstocks have the potential to overcome the disadvantages associated with first generation feedstocks, while addressing many of the climate change and energy availability challenges [8].
Transesterification is a chemical reaction in which oils (triglycerides) react with alcohols (e.g., methanol, ethanol) under acid or alkali catalysed conditions, producing fatty acid alkyl esters and glycerol. A catalyst is used to improve the reaction rate and ester yield. Because the transesterification reaction is reversible, excess alcohol is used to shift the equilibrium to favour production of esters. After the reaction is completed, glycerol is removed as a by-product and the esters are purified into biodiesel [12].
One limitation with the alkali catalysed transesterification process is that this process is not suitable for vegetable oils containing high levels of free fatty acids (FFA). This is because FFAs react with the catalyst to form soaps, resulting in emulsification and separation problems [13]. In addition excessive soap formation reduces biodiesel yield and obstructs subsequent purification processes including glycerol separation and water washing [14]. However, the maximum limit of FFA in vegetable oil for alkali catalysed transesterification is still uncertain with different benchmarks being reported. For example, Van Gerpan reported that vegetable oils containing up to 5% FFA can be transesterified using an alkali catalyst while Dorodo et al. [15] and Ramadhas et al. [16] reported that FFA content should not be greater than 3% and 2%, respectively. Many researchers have also reported that FFA should be kept less than 1% for alkali catalysed transesterification [17–19]. In order to overcome the difficulties related to transesterifying high FFA oils, a pre-esterification process can be used in which a homogeneous acid catalysed process is used prior to transesterification [14,20].
The yield and quality of biodiesel are affected by several pre-esterification and transesterification reaction parameters such as the quantity of alcohol, reaction temperature, FFA content of the oil and the type and concentration of catalyst [21,22]. For the stoichiometric transesterification reaction, three moles of methanol are required per mole of triglyceride to yield three moles of methyl esters and one mole of glycerol. The theoretical molar ratio of methanol to triglyceride should, therefore, be 3:1 [18]. However, the ratio of alcohol to oil used in the reaction is much higher than this to promote complete conversion of oils to FAME and varies with oil quality and the type of catalyst used. For example, the molar ratio of alcohol to oil for alkali catalysed reactions is typically 6:1, and for acid catalysed reactions it may be 15:1 or higher. An increase in the concentration of catalyst generally increases the conversion of triglycerides into fatty acid esters [18]. Insufficient catalyst leads to an incomplete conversion reaction and lower levels of fatty acid esters, whereas excess catalyst has a negative impact on end product yield, because of the formation of soaps.
On the other hand, a higher reaction temperature increases the reaction rate and decreases the reaction time due to the reduction in viscosity of the oils. High reaction temperatures above optimal levels, however, leads to a decrease in biodiesel yield, as higher reaction temperatures accelerate the saponification of triglycerides [23]. Therefore, researches seek to optimise the important reaction parameters for different biodiesel feedstock in order to achieve an efficient and economical biodiesel production process.
has been identified as the most suitable feedstock for future generation biodiesel [26,27]. It is a moderately sized tree that grows between 8–20 m tall and is most notable for its decorative leaves and fragrant flowers. The tree grows in tropical and sub-tropical climates close to sea level. It is a moderately quick growing tree reaching up to 1 m tall within a year. It has also been seen to flourish even with the presence of weeds and other species, so the plant can be grown in mixed cultures. The Beauty leaf tree has the ability to produce about 4800 kg of non-edible oil per year per hectare [27]. However, the potential of beauty leaf as a source of future generation biodiesel is yet to be established in part due to a lack of knowledge of its optimum production process.
Response surface methodology (RSM) is a collection of mathematical and statistical techniques that are useful for modelling, analysis and optimisation problems in which the response of interest is influenced by several factors [28,29]. In this technique, a well-designed experiment can substantially reduce the number of tests, and yet provide the essential information required for process optimisation. RSM uses statistical methods for experimental design to identify important factors by characterizing the response surface using a polynomial model [30]. In the practical application of RMS it is necessary to develop a statistically valid approximating model for the true response surface. The relationship of the response variable Y and the dependent variables X1, X2, … Xk, in the RSM application is generally
expressed as in the following equation [31]:
Y = f(X1, X2, ……… Xk) + ε (1)
where ε is the noise or error observed in the response Y; and f is the response surface.
This study aims to investigate the effect of several reaction parameters on the production of biodiesel from high FFA vegetable oil obtained from the beauty leaf seed. This study also implemented RSM in developing linear and full quadratic polynomial equations for predicting FFA and FAME content and predicting the optimum reaction condition for pre-esterification and transesterification processes.
2. Materials and Method
2.1. Beauty Leaf Oil Extraction Method
2.2. Analysis Methods
FFA content of the beauty leaf oil was analysed using D5555-95 (2011) standard test method. Ester content of the FAME was analysed by gas chromatography and flame ionization detection (GC-FID) in accordance with EN 14103 standards. The gas chromatograph (GC) was a Hewlett-Packard 6890 System fitted with Varian Select™ 30 m × 0.32 mm × 0.25 µm column. Oil density and surface tension were analysed following ASTM D1298 and ASTM D971-12 standard test methods using a KSV Sigma 702 Tensiometer Viscosity was measured using Brookfield DV-III Rheometer and following the ASTM D445 standard test method. The fatty acid compositions of the oils were analysed using a Hewlett Packard Plus 6890 series GC-FID and a capillary column of acidified polyethylene glycol (HP-INNOWax 19091N-133, 30 m × 250 μm × 0.25 μm).
2.3. Pre-Esterification and Transesterification Methods
[image:5.595.91.514.547.744.2]Both acid-catalysed pre-esterification and base-catalysed transesterification were conducted in a 500 mL triple neck bottom flask reactor (Figure 1a). An oil quantity of 40 g was used for the acid-catalysed pre-esterification experiments, and 30 g was used for each base-catalysed transesterification trial. For each experiment, oil was carefully transferred into the reaction flask and preheated in an oil bath to the reaction temperature. For acid-catalysed esterification trials, sulfuric acid (H2SO4) was used as catalyst. The sulphuric acid and methanol solution were freshly prepared and added to the preheated oil, and the mixture was agitated for two hours. At the completion of the two hours, the mixture was centrifuge in a self-sanding tube for 7 min to separate the methanol-water and esterified oil phases as shown in Figure 1b. The majority of the excess methanol, sulfuric acid and impurities were separated into the top phase. The bottom phase containing the oil was collected for base-catalysed transesterification.
Figure 1. (a) Esterification and transesterification reactor; (b) Layer of Methanol-Water (top) and oil (bottom) after acid-catalysed pre-esterification; (c) Layer of beauty leaf oil methyl ester (top) and glycerol (bottom) after base-catalysed Transesterification.
(a) (b) (c)
In the based-catalysed transesterification trials, sodium methoxide (NaOCH3) was used as a catalyst with a reaction time of 1.5 h. Similarly to the acid-catalysed pre-esterification trials, the phases of
Methanol-water solution
Pre-esterified oil
the transesterification product were separated using a centrifuge and the bottom layer drained using a separation funnel as shown in the Figure 1c. The top layer containing beauty leaf methyl ester was collected for analysis.
[image:6.595.60.539.231.386.2]Experiments were carried out according to a Box-Behnken response surface design which involves 3 factors and requires 3 levels and a total of 15 runs. The factors and the ranges and levels used in this study are shown in Table 1. The Minitab 16 statistical software package was used to randomly generate runs orders of the experiments which are shown in Table 2.
Table 1. Experimental range and levels of independent variables.
Variables Unit Symbol coded Range & levels
−1 0 1 Acid-catalyzed pre-esterification
MeOH: Oil mole M 10:1 20:1 30:1
H2SO4 wt% oil C 5 10 15
Temperature °C T 45 60 75
Base-catalyzed transesterification
MeOH: Oil mole M' 4:1 6:1 8:1
CH3ONa wt% oil C' 0.6 0.8 1
Temperature °C T' 45 60 75
Table 2. Coded experimental design.
Run Acid-catalysed pre-esterification Base-catalysed transesterification
M C T M' C' T'
1 0 −1 1 0 0 0
2 −1 −1 0 1 0 −1
3 −1 0 −1 −1 −1 0
4 1 −1 0 −1 1 0
5 0 0 0 −1 0 −1
6 1 1 0 −1 0 1
7 0 1 1 1 1 0
8 0 0 0 0 1 1
9 0 0 0 0 −1 −1
10 0 −1 −1 0 −1 1
11 0 1 −1 1 0 1
12 −1 0 1 1 −1 0
13 1 0 −1 0 0 0
14 −1 1 0 0 0 0
15 1 0 1 0 1 -1
Since the key focus of acid-catalysed esterification reaction is on reducing the free fatty acid content to be <3–5 wt%, a full quadratic model was used for statistical analysis in order to correlate the %FFA with the operating variables. The form of the full quadratic model for the first step is as shown in Equation (2):
2 2 2
0 1 1 2 2 3 3 1,2 1 2 1,3 1 3 2,3 2 3 1,1 1 2,2 2 3,3 3
[image:6.595.84.512.420.679.2]where Y is the %FFA; β0 is a constant; β1, β2, β3 are regression coefficients and X1, X2, X3 are independent variables. For the base-catalysed transesterification reaction, the same form of the full quadratic model is used; however, in this case Y is the ester content of the biodiesel (%).
3. Results, Analysis and Discussion 3.1. Beauty Leaf Oil Characterizations
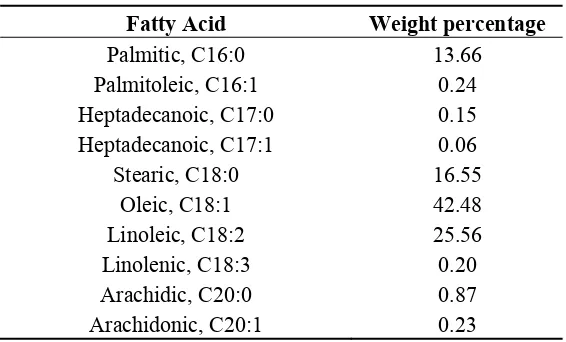
The quality of beauty leaf oil has been characterised in terms of chemical composition and physical properties in order to identify its suitability as a feedstock for biodiesel for diesel engine combustion. The results of analyses of the chemical composition and properties of the crude beauty leaf oil used in this study are shown in Tables 3 and 4. The compositional analysis shows that beauty leaf oil contains high levels of stearic (C18:0), oleic (C18:1) and linoleic (C18:2) acids (Table 3). This indicates the potential for high combustion quality and hence suitability of beauty leaf oil as a fuel [32]. However, kinematic viscosity and surface tension are significantly higher than other oils which may lead to poor atomisation and volatility characteristics. Therefore, beauty leaf oil may not be suitable as fuel for direct use in conventional diesel engines [21].
Table 3. Fatty acid composition of beauty leaf oil.
Fatty Acid Weight percentage
Palmitic, C16:0 13.66 Palmitoleic, C16:1 0.24 Heptadecanoic, C17:0 0.15 Heptadecanoic, C17:1 0.06 Stearic, C18:0 16.55
[image:7.595.157.440.383.554.2]Oleic, C18:1 42.48 Linoleic, C18:2 25.56 Linolenic, C18:3 0.20 Arachidic, C20:0 0.87 Arachidonic, C20:1 0.23
Table 4. Properties of beauty leaf oil.
Properties Values
Density, kg/m3 936
Surface tension (mN/s) 35.6 Kinematic Viscosity @40 °C, cSt 40.05
Free fatty acid (wt%) 12
3.2. Acid-Catalysed Pre-Esterification
Table 5 summarizes the experimental conditions and results from each pre-esterification experimental run. The results indicate a significant reduction in FFA content of the beauty leaf oil following acid-catalysed pre-esterification. FFA content of the pre-esterified samples ranged from 3.25 to 1.83. The minimum FFA content resulted from the esterification condition with 30:1 MeOH to oil molar ratio, 10% weight concentration of catalyst and 75 °C reaction temperature (Test 15). An FFA content of less than 2% was also achieved for Test 6 (30:1 MeOH to oil molar ratio, 15% weight concentration of catalyst and 60 °C reaction temperature). Based on the experimental results, a linear and a quadratic equations have been developed using Minitab 16 software in order to predict the FFA percentages as a function of methanol to oil molar ratio, catalyst concentration and reaction temperature in acid catalyst esterification. The developed quadratic models equations are shown in Equations (3) and (4):
FFA(%) 3.97617 0.0528 M 0.0055C0.00542T (3)
2 2 2
FA(%) 1.493 0.00498 0.02487 0.06596 0.000085 0.0007083 0.0002233 0.0001554 0.001558 0.000458
M C T MC MT
CT M C T
[image:8.595.67.533.377.620.2] (4)
Table 5. Experimental conditions and results for acid-catalysed pre-esterification.
Test MeOH: Oil Molar Ratio H2SO4 Conc. (wt%) Temp (°C) FFA (wt%)
1 20 5 75 2.39
2 10 5 60 3.25
3 10 10 45 2.88
4 30 5 60 2.10
5 20 10 60 2.61
6 30 15 60 1.97
7 20 15 75 2.39
8 20 10 60 2.61
9 20 10 60 2.53
10 20 5 45 2.61
11 20 15 45 2.67
12 10 10 75 3.02
13 30 10 45 2.12
14 10 15 60 3.10
15 30 10 75 1.83
Table 6 also shows that all p-values were fairly high, considerably above 0.05 which infer that the coefficients in full quadratic model are not statistically insignificant in 95% confidence interval.
Table 6. Regression coefficients for %FFA prediction.
Predictor Linear Full quadratic Coefficient p-value Coefficient p-value
Constant 3.97617 0 1.493 0.212
MeOH:Oil (M) −0.0528 0 −0.00498 0.874 H2SO4 (C) −0.0055 0.511 −0.02487 0.695
Temp (T) −0.00542 0.07 0.06596 0.069 MeOH:Oil × H2SO4 (MC) 0.000085 0.934
MeOH:Oil × Temp (MT) −0.0007083 0.080
H2SO4 × Temp (CT) −0.0002233 0.744
MeOH:Oil × MeOH:Oil (M2) −0.0001554 0.771
H2SO4 × H2SO4 (C2) 0.001558 0.476
Temp × Temp (T2) −0.000458 0.097
[image:9.595.191.407.503.679.2]The accuracy of the prediction model obtained by the regression analysis was verified by a scattered diagram (Figure 2), where experimental results for FFA were compared to predicted values from the model. In linear model, the regression coefficient (R2) and the adjusted regression coefficient (R2 (adj)) of 0.983 and 0.949 shows a good fit between actual and predicted results whereas in full quadratic model, those parameters were 0.981 and 0.949 respectively. Therefore, it is apparent that the linear model is statistically more appropriate than that of full quadratic model. Moreover, the full quadratic model is over-specified as none of the coefficients are significant in 95% confident interval.
Figure 2. Scatter diagram of experimental FFA (%) and predicted FFA (%) of a linear model.
concentrations. Reaction temperature has a small effect on FFA content at lower values and effect on FFA reduction is significant after 65 °C, which was more evident in Figure 3b.
Figure 3. Response surface of FFA content against (a) methanol to oil molar ratio and reaction temperature at 10% acid catalyst (H2SO4); (b) against catalyst concentration and reaction temperature at 30:1 methanol to oil molar ratio.
(a) (b) 3.3. Base-Catalysed Transesterification of Pre-Esterified Beauty Leaf Oil
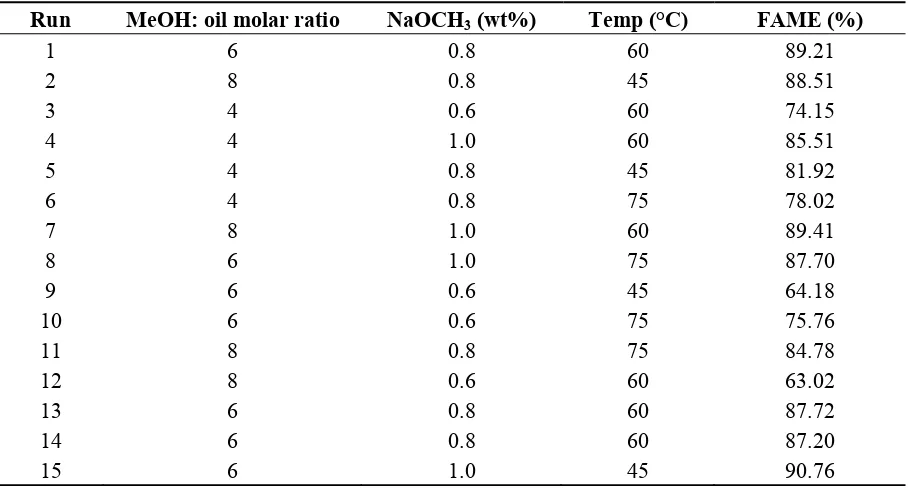
[image:10.595.72.526.529.774.2]All samples produced from the acid-catalyzed esterification process were thoroughly mixed to produce a homogenous feedstock for transesterification. The FFA content of the mixture was found to be 2.46% (w/w). Similarly to the acid-catalysed pre-esterification trials, 15 experimental runs were undertaken based on Box-Behnken design as shown in Table 2. The results obtained from those experiments are shown in Table 7.
Table 7. Experimental data for base-catalysed transesterification.
Run MeOH: oil molar ratio NaOCH3 (wt%) Temp (°C) FAME (%)
1 6 0.8 60 89.21
2 8 0.8 45 88.51
3 4 0.6 60 74.15
4 4 1.0 60 85.51
5 4 0.8 45 81.92
6 4 0.8 75 78.02
7 8 1.0 60 89.41
8 6 1.0 75 87.70
9 6 0.6 45 64.18
10 6 0.6 75 75.76
11 8 0.8 75 84.78
12 8 0.6 60 63.02
13 6 0.8 60 87.72
14 6 0.8 60 87.20
In the transesterification experiments, the ester content of the FAME ranged from 63.02% to 90.76% with the highest content resulting from reaction conditions with 6:1 methanol to oil molar ratio, 1 wt% NaOCH3 and 45 °C temperature.
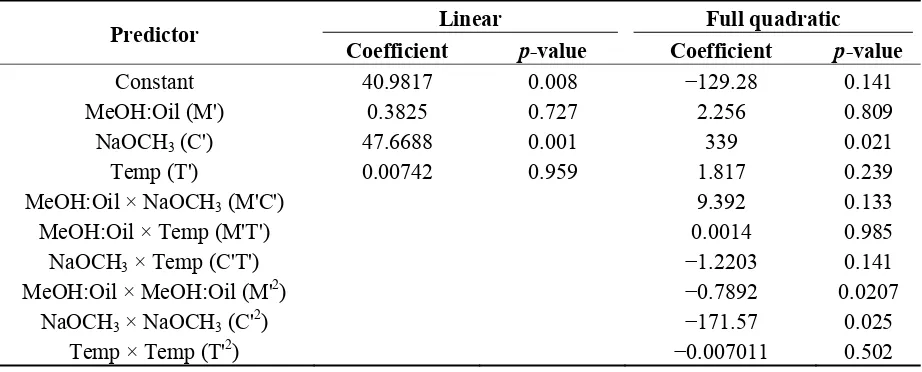
As from the experimental data processed using Minitab 16 software to generate the linear and quadratic model for statistical prediction of ester content as a function of methanol to oil molar ratio, catalyst concentration and reaction temperature. The linear and quadratic model equation resulting from this is shown in Equations (5) and (6) respectively and Table 8 summarises the resulting regression coefficients and corresponding p-value:
%FAME 40.9817 0.3825 M' 47.6688 ' 0.00742 C T (5)
2 2 2
%FAME 129.28 2.256 ' 339 ' 1.817 9.392 ' ' 0.0014 ' ' 1.2203 ' ' 0.7892 ' 171.57 ' 0.007011 '
M C T M C M T
[image:11.595.69.530.313.499.2]C T M C T (6)
Table 8. Regression coefficients for FAME (%) prediction.
Predictor Linear Full quadratic Coefficient p-value Coefficient p-value
Constant 40.9817 0.008 −129.28 0.141
MeOH:Oil (M') 0.3825 0.727 2.256 0.809
NaOCH3 (C') 47.6688 0.001 339 0.021
Temp (T') 0.00742 0.959 1.817 0.239
MeOH:Oil × NaOCH3 (M'C') 9.392 0.133
MeOH:Oil × Temp (M'T') 0.0014 0.985
NaOCH3 × Temp (C'T') −1.2203 0.141
MeOH:Oil × MeOH:Oil (M'2) −0.7892 0.0207
NaOCH3 × NaOCH3 (C'2) −171.57 0.025
Temp × Temp (T'2) −0.007011 0.502
The regression coefficient (R2) and the adjusted regression coefficient (R2 (adj)) of linear model were 0.6465 and 0.55 demonstrated that the linear model may not be suitable for estimate FAME in given reaction condition. Whereas full quadratic model with 0.9224 of regression coefficient (R2) and 0.8413 of adjusted regression coefficient (R2 (adj)) shows better model for FAME estimation. Figure 4 shows the accuracy of the prediction model in a scattered plot between experimental and predicted ester contents. All points are close to straight line demonstrate a good agreement between experimental results and those ones calculated by the model.
Figure 4. Scatter diagram of experimental and calculated FAME (%) of full quadratic model.
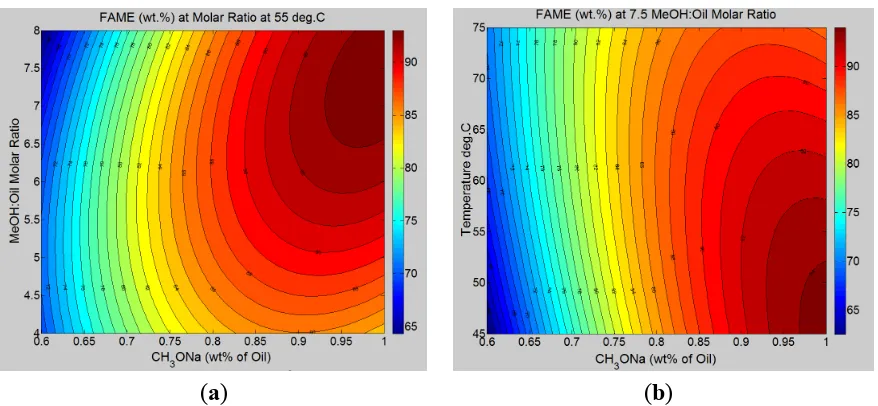
Figure 5. Response surface ester content against catalyst concentration vs. (a) methanol to oil molar ratio at 55 °C; (b) reaction temperature at 7.5:1 methanol to oil molar ratio.
(a) (b) 4. Conclusions
[image:12.595.81.520.344.547.2]lowering FFA content of beauty leaf oil. In terms of a linear effect on FFA reduction for the first step, methanol to oil molar ratio was found to be highly significant and reaction temperature moderately significant. For transesterification, catalyst concentration was found be the most dominant variable in achieving high ester contents. The limitation of the developed response surface model is that all the p-values are greater than 0.05. Therefore, the developed models might be over-specified and some that terms can be omitted. However, the information contained in the model and experiment in this study is very significant in industrial biodiesel production.
Acknowledgments
The authors wish to express their thanks to QUTPRA scholarship for providing fund for conducting this research. The authors would also like to thanks the Biofuel Engine Research Facility (BERF), QUT and Centre for Tropical Crops and Biocommodities (CTCB), QUT for providing experimental facilities.
Author Contributions
All of the authors have contributed toward developing the ideas, establishing research design, method and analysis. Mohammad I. Jahirul and Wenyong Koh have been involved in sample preparation, experimental design and develop the model. Lalehvash Moghaddam has been involved in conducting experiment. Richard J. Brown, Wijitha Senadeera and Ian O’Hara have been involved in result analysis and editing. All of the authors have been involved in preparing the manuscript. All of authors are responsible for the integrity of the work as a whole.
Conflicts of Interest
The authors declare no conflict of interest.
References
1. Jahirul, M.I.; Brown, R.J.; Senadeera, W.; O’Hara, I.M.; Ristovski, Z.D. The use of artificial neural networks for identifying sustainable biodiesel feedstocks. Energies2013, 6, 3764–3806. 2. Weitzman, M.L. A review of the stern review on the economics of climate change. J. Econ. Lit.
2007, 45, 703–724.
3. Jahirul, M.I.R.; Rasul, M.G.; Chowdhury, A.A.; Ashwath, N. Biofuels production through biomass pyrolysis—A technological review. Energies2012, 5, 4952–5001.
4. Jahirul, M.I.; Hasanuzzaman, R.S.M.; Masjuki, H.H.; Kalam, M.A. A comparison of the air pollution of gasoline and CNG driven car for Malaysia. Int. J. Mech. Mater. Eng.2009, 2, 130–138. 5. Jahirul, M.I.; Masjuki, H.H.; Saidur, R.; Kalam, M.A.; Jayed, M.H.; Wazed, M.A. Comparative
engine performance and emission analysis of CNG and gasoline in a retrofitted car engine. Appl. Therm. Eng.2010. 30, 2219–2226.
6. Reijnders, L. Conditions for the sustainability of biomass based fuel use. Energy Policy2006, 34, 863–876.
8. Posten, C.; Schaub, G. Microalgae and industrial biomass as a source for fuel—A process view. J. Biotechnol.2009, 142, 64–69.
9. Sinha, S.; Agarwal, A.K.; Garg, S. Biodiesel development from rice bran oil: Transesterification process optimization and fuel characterization. Energy Convers. Manag.2008, 49, 1248–1257. 10. Haseeb, A.S.M.A.; Fazal, M.A.; Jahirul, M.I.; Masjuki, H.H. Compatibility of automotive
materials in biodiesel: A review. Fuel2011, 90, 922–931.
11. Lin, L.; Zhou, C.; Vittayapadung, S.; Shen, X.; Dong, M. Opportunities and challenges for biodiesel fuel. Appl. Energy2011, 88, 1020–1031.
12. Fernandoa, S.; Karraa, P.; Hernandezb, R.; Jhaa, S.K. Effect of incompletely converted soybean oil on biodiesel quality. Energy2007, 32, 844–851.
13. Rajendra, M.; Jena, P.C.; Raheman, H. Prediction of optimized pretreatment process parameters for biodiesel production using ANN and GA. Fuel2009, 88, 868–875.
14. Lam, M.K.; Lee, K.T.; Mohamed, A.R. Homogeneous, heterogeneous and enzymatic catalysis for transesterification of high free fatty acid oil (waste cooking oil) to biodiesel: A review. Biotechnol. Adv.2010, 28, 500–518.
15. Dorado, M.P.; Ballesteros, E.; Almeida, J.A.; Schellert, C.; Löhrlein, H.P.; Krause, R. An alkali-catalyzed transesterification process for high free fatty acid waste oils. Trans. ASABE 2002, 45, 525–529.
16. Ramadhas, A.S.; Jayaraj, S.; Muraleedharan, C. Biodiesel production from high FFA rubber seed oil. Fuel2005, 84, 335–340.
17. Kumar, T.A.; Kumar, A.; Raheman, H. Biodiesel production from jatropha oil (Jatropha curcas) with high free fatty acids: An optimized process. Biomass Bioenergy2007, 31, 569–575.
18. Ma, F.; Hanna, M.A. Biodiesel production: A review. Bioresour. Technol.1999, 70, 1–15.
19. Zhang, Y.; Dubé, M.A.; McLean, D.D.; Kates, M. Biodiesel production from waste cooking oil: 1. Process design and technological assessment. Bioresour. Technol.2003, 89, 1–16.
20. Zhang, J.; Jiang, L. Acid-catalyzed esterification of Zanthoxylum bungeanum seed oil with high free fatty acids for biodiesel production. Bioresour. Technol.2008, 99, 8995–8998.
21. Balat, M.; Balat, H. A critical review of bio-diesel as a vehicular fuel. Energy Convers. Manag. 2008, 49, 2727–2741.
22. Demirbas, A. Comparison of transesterification methods for production of biodiesel from vegetable oils and fats. Energy Convers. Manag.2008, 49, 125–130.
23. Leung, D.Y.C.; Guo, Y. Transesterification of neat and used frying oil: Optimization for biodiesel production. Fuel Proc. Technol.2006, 87, 883–890.
24. Bozbas, K. Biodiesel as an alternative motor fuel: Production and policies in the European Union. Renew. Sustain. Energy Rev.2008, 12, 542–552.
25. Haas, M.J.; McAloon, A.J.; Yee, W.C.; Foglia, T.A. A process model to estimate biodiesel production costs. Bioresour. Technol.2006, 97, 671–678.
26. Ashwath, N. Evaluating Biodiesel Potential of Australian Native and Naturalised Plant Species. Available online: https://rirdcinfoservicescomau/downloads/10-216 (accessed on 24 August 2012). 27. Jahirul, M.I.; Brown, J.R.; Senadeera, W.; Ashwath, N.; Laing, C.; Leski-Taylor, J.; Rasul, M.G.
28. Jeong, G.; Don-Hee Park, D.H. Optimization of biodiesel production from castor oil using response surface methodology. Appl. Biochem. Biotechnol.2009, 156, 1–11.
29. Vicente, G.; Coteron, A.; Martinez, M.; Aracil, J. Application of the factorial design of experiments and response surface methodology to optimize biodiesel production. Ind. Crop. Prod. 1998, 8, 29–35.
30. Ferella, F.; Mazziotti di Celso, G.; de Michelis, I.; Stanisci, V.; Vegliò, F. Optimization of the transesterification reaction in biodiesel production. Fuel2010, 89, 36–42.
31. Saidur, R.; Jahirul, M.I.; Hasanuzzaman, M.; Masjuki, H.H. Analysis of Exhaust Emissions of Natural Gas Engine by Using Response Surface methodology. J. Appl. Sci.2008, 8, 3328–3339. 32. Refaat, A.A. Correlation between the chemical structure of biodiesel and its physical properties.
Int. J. Environ. Sci. Technol.2009, 6, 677–694.