www.sciedu.ca/jbgc Journal of Biomedical Graphics and Computing 2015, Vol. 5, No. 2
ORIGINAL RESEARCH
Computed tomography volume measurements of
the liver using a liver segmentation and analysis
package: an intra- and inter-rater reliability study
Jessie T Childs∗1, Kerry A Thoirs2, Adrian J Esterman3 1
University of South Australia, Adelaide, Australia
2International Centre of Allied Health Research, University of South Australia, Adelaide, Australia 3
FACE, University of South Australia, Adelaide, Australia and Centre for Research Excellence in Chronic Disease Prevention, James Cook University, Cairns, Australia
Received: May 27, 2015 Accepted: July 2, 2015 Online Published: July 28, 2015
DOI: 10.5430/jbgc.v5n2p17 URL: http://dx.doi.org/10.5430/jbgc.v5n2p17
Abstract
Introduction: Recent advances in technology have seen the introduction of software assisted image post-processing (SAIP) tools to calculate the volume of the liver from Computed Tomography (CT) images. One such SAIP tool is the semi-automated Philips liver segmentation and analysis package (Endhoven, The Netherlands). The intra- and inter-rater reliability of the liver volumes of 16 participants calculated using this tool was assessed.
Methods:Two CT Technologists accessed Abdominal CT data sets and calculated the volume of the liver using the Philips liver segmentation and analysis package. One technologist repeated their calculation.
Results:Results demonstrated high intra-rater reliability (ICC 0.9997) and high inter-rater reliability (ICC 0.99994). Analysis with Bland Altman plots showed the mean bias for both intra- and inter-rater reliability to be close to zero with acceptable limits of agreement.
Conclusions:This study has shown that liver volume measurements using the Philips SAIP (Endhoven, The Netherlands) can be taken reliably by CT technologists, with confidence that the same results would be obtained between different CT technologists.
Key Words:Computed tomography, Liver, Reliability, Software assisted image post-processing, Volume
1
Introduction
The ability to measure the size of the adult liver improves patient outcomes by aiding in surgical planning and follow-up, disease diagnosis and tracking of disease progression or response to treatment over time.[1–4] For patients undergo-ing major hepatic resection, the likelihood of post – hepa-tectomy liver failure is three times higher in patients who are left with < 25% of their initial liver volume compared to those who are left with≥25% of their initial liver volume.[5]
Mortality and morbidity rates for major hepatic resection have been reported to be as high as 30% with post hep-atic liver failure being the major cause. Therefore, knowl-edge of the pre and post-surgical liver volumes are essential for superior patient outcomes.[6] In some instances,
hep-atic resection is performed in two separate surgeries. Ap-propriate increase in liver volume 6 days following initial surgery enables the second part of the surgery to be safely performed.[7] Liver volume is also commonly assessed
3-∗Correspondence:Jessie T Childs; Email: [email protected]; Address: Room BJ1-18 University of South Australia City East Campus, Frome Road Adelaide 5000, Australia.
4 weeks following portal vein embolization, which is done as part of resection, to assess for appropriate liver hypertro-phy. An increase in size of 5% is associated with improved patient outcomes.[8] In addition to this, liver volume
cal-culations are commonly used to estimate drainage volume prior to endoscopic biliary drainage.[9] Liver volume is also
commonly assessed six weeks and one week prior to gastric banding surgery to ensure adequate volume reduction.[10]
Computed Tomography (CT) is currently considered the gold standard for assessment of the volume of the adult liver.[11]Magnetic Resonance Imaging (MRI) has also been
shown to be accurate in taking volume measurements of the liver.[12]Despite the advantage MRI offers in the form of not using ionising radiation, in comparison CT is more readily available, faster and less expensive to perform than MRI.
Prior to the introduction of automated methods of CT liver measurement, measurement of liver volume from CT im-ages was performed using manual volumetry, a technique performed by manually tracing the liver boundary on each CT slice to determine the volume of liver on each slice. The individual slice volumes were then summed to calcu-late an overall liver volume. Recent advances in CT imaging technology have seen the introduction of software programs that automatically calculate liver volume; a less operator de-pendent method. Multiple automated and semi-automated liver segmentation tools have been developed and are collec-tively referred to as software assisted image post-processing (SAIP) tools.[13]
SAIP tools are increasing in popularity and have been proven to be very accurate in predicting liver volumes.[14, 15] Studies have shown that measurement of liver volume us-ing SAIP tools correlate well with manual volumetry,[16]
and with the added advantage of being a substantially faster method of volume calculation,[17] they are being touted as
the new gold standard for liver volumetry.[18]
The purpose of this study was to investigate the intra-and inter- rater reliability of a specific SAIP tool, namely, the Philips liver segmentation and analysis package (Eind-hoven, The Netherlands). The reliability testing of this tool was undertaken as a preliminary investigation to establish the reliability of two observers who were to take part in a larger study. This Philips liver segmentation and analy-sis package (Eindhoven, The Netherlands) provides an au-tomatic volume calculation of the liver by highlighting the liver tissue within each slice (instead of requiring the tech-nologists to hand trace the slices as seen in manual vol-umetry) and then summing the individual slice volumes. A CT operator then provides a subjective component to the calculation by accessing the individual slices and manually adding or removing highlighted tissue which may have been missed by the software or included in error.
CT operator intra- and inter- rater reliability for volume measurements of the liver using the Philips liver
segmenta-tion and analysis package (Eindhoven, The Netherlands) has not been published. Reliability testing of this SAIP tool will inform researchers and clinicians of the magnitude of vari-ance of liver volume measurements that can be attributed to any imprecision of this measurement technique.
2
Methods
Ethics approval was sought and granted from the ethics committee of the University of South Australia.
A sample size calculation was performed using PASS 11 (NCSS, Utah USA) which determined a sample size of 16 participants was required with 2 raters per participant to achieve 80% power to detect an alternative hypothesis, intra-class correlation (ICC) of 0.7 against the null hypoth-esis that the ICC is 0.2, using an independent samples t-test with a significance level of 0.05.
The 16 participants were recruited as a sample of conve-nience from the CT patient population that had been referred by their General Medical Practitioner to a private radiology firm for an abdominal CT as part of their medical care. An information sheet was provided to potential participants and once they had agreed to take part, written consent was ob-tained prior to their CT. Participants were excluded if the CT they had been referred for would not image their entire liver, if they were unable to read and comprehend the information sheet, or if they were under 18 years of age.
There were nine female and seven male participants, mean age (standard deviation) 62 (16) years (range 24 – 89 years). Participants were not asked questions regarding their med-ical history. A formal radiology report for each scan was prepared by the onsite radiologist and returned to the partic-ipant’s general medical practitioner.
The examinations were undertaken by one of two qualified CT technologists (SR & BW) on a Philips Ingenuity 128 slice low dose CT machine with iDose 4 software (Philips Medical Systems, Best, Netherlands). A standard adult ab-dominal imaging protocol was used with the patient lying supine on a CT table in a state of respiratory inspiration during image collection. The studies were a combination of contrast enhanced and non-contrast depending on the clini-cal question being asked. kV was set at 120, mA was set at a preset Philip DoseRight Index of 16, collimation 64×0.625, pitch 1.172, rotation time 0.4 seconds with a gantry angle of 0 degrees. The slice thickness used was 1.0 mm with a slice increment of 0.5 mm. A standard B filter was used with iDose level 4, render mode set to average and a 512 matrix. The participant’s images were saved to the CT workstation hard drive.
www.sciedu.ca/jbgc Journal of Biomedical Graphics and Computing 2015, Vol. 5, No. 2
[image:3.612.72.307.124.306.2]Netherlands). Figure 1 depicts a CT image where the soft-ware has identified and highlighted the liver tissue; guided by liver segments and surrounding vascular landmarks.
Figure 1:An example of the liver volume calculation. The liver is highlighted pink on the cross sectional slices (right column) and cross sectional areas are then summed to form a 3D liver model and volume calculation.
Each technologist then assessed each slice of the liver and deleted or added highlighted liver tissue that had been in-cluded incorrectly or missed (see Figure 2). The technolo-gists recorded their time taken to calculate liver volume as less than 5 minutes, between 5-10 minutes, or between 10-15 minutes. One week later, blinded to her initial results, the first technician (SR) then accessed the images again and repeated her measurements.
Intra- and inter- rater reliability was initially assessed for the liver measurements using single rater intraclass correlation coefficients (ICC’s) for absolute agreement using MedCalc 14 software (MedCalc, Mariakerke, Belgium). Bland Alt-man plots were then performed to assess the limits of agree-ment and to assess for any patterns in the bias. Mean bias in the measurements was assessed using paired samplest -tests. A pvalue of≤.05 was taken to indicate statistical significance. Analyses were undertaken using MedCalc 14 software (MedCalc, Mariakerke, Belgium).
3
Results
Mean liver volume (standard deviation) was 1615.9 (390 cc). Studies have reported healthy liver volumes to lie be-tween 1300 cc and 1600 cc.[18–23] Six participants had liver
volumes above this range, two below this range and eight within this range. Review of the radiologist reports revealed
three of the participants having visually pathological livers. One contained small granulomas, one with fatty change and the third containing tiny cysts. Further testing would be re-quired to determine if the three remaining livers with vol-umes above the normal range were pathological.Visually, these livers were normal and were reported as such.
The results of the intra- and inter- rater reliability testing are shown in Table 1 and the results of the statistical analy-ses are shown in Table 2. The time taken for each volume calculation was recorded as being less than 5 minutes in all cases.
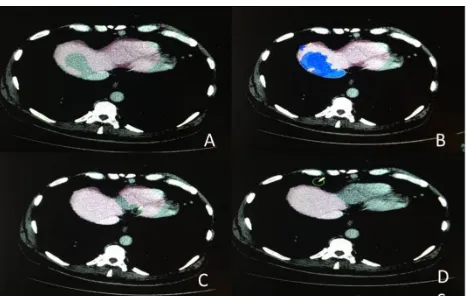
Figure 2:(A) A CT slice with some liver that has been omitted from the cross sectional area measurement and a part of the heart that has been incorrectly included. (B) The previously omitted liver tissue has now been included in the meausrement (marked in blue). (C) Using the erase tool, the incorrectly included heart tissue is erased. (D) The liver is now all correctly included and the heart tissue deleted from the measurement.
Intraclass correlation coefficients are usually interpreted as follows: values of 0.7 and below are considered as hav-ing poor agreement. Values of 0.7-0.8 are considered to have strong agreement, and values of 0.81 and above are considered as having very strong agreement.[24] The results
of 0.997 and 0.99994 show near perfect agreement for both intra- and inter - rater reliability respectively.
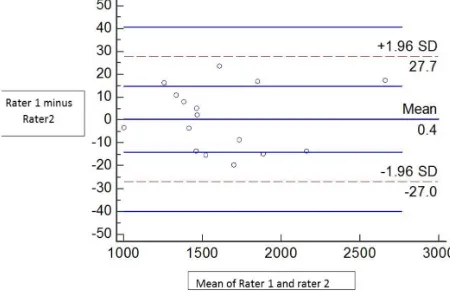
Bland Altman analysis also demonstrated strong agreement. A weak pattern was seen of larger volumes having slightly more variability in their reliability. The pattern does not ap-pear strong enough to have an impact clinically. Figures 3 and 4 show the Bland Altman plots for intra- and inter- rater. The mean bias for both measurements was close to zero and the limits of agreement equated to a variation in the mean liver volume (1615.9 cc) of 2.3% and 3.4% respectively. Single samplet-test comparisons showed no departure from zero bias for intra- or inter- rater reliability.
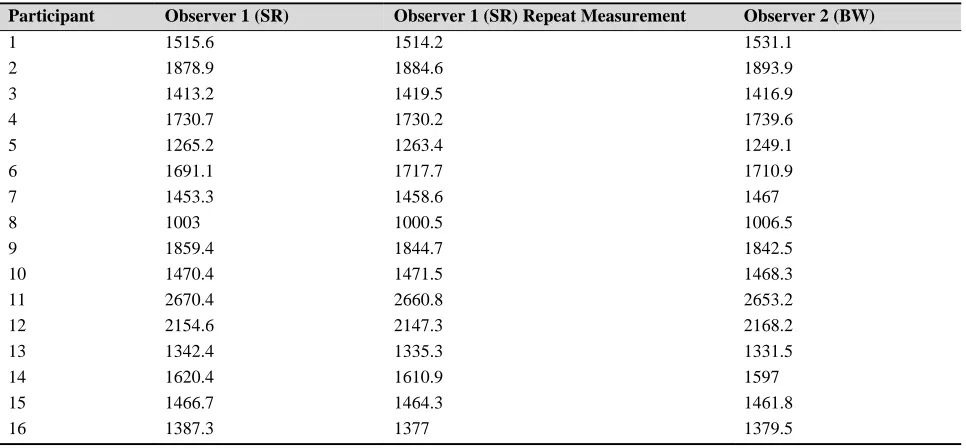
[image:3.612.321.554.215.363.2]Table 1:Total liver volumes (cc)
Participant Observer 1 (SR) Observer 1 (SR) Repeat Measurement Observer 2 (BW)
1 1515.6 1514.2 1531.1
2 1878.9 1884.6 1893.9
3 1413.2 1419.5 1416.9
4 1730.7 1730.2 1739.6
5 1265.2 1263.4 1249.1
6 1691.1 1717.7 1710.9
7 1453.3 1458.6 1467
8 1003 1000.5 1006.5
9 1859.4 1844.7 1842.5
10 1470.4 1471.5 1468.3
11 2670.4 2660.8 2653.2
12 2154.6 2147.3 2168.2
13 1342.4 1335.3 1331.5
14 1620.4 1610.9 1597
15 1466.7 1464.3 1461.8
16 1387.3 1377 1379.5
Table 2:Results of statistical analysis
Statistical Tool Intra-rater reliability of liver volume measurements
Inter-rater reliability of liver volume measurements
ICC (95% confidence intervals) 0.9997 (0.9992 to 0.9999) 0.99994 (0.9983 to 0.9998)
Mean Bias 1.4cc 0.4cc
Limits of Agreement 37.9cc 54.7cc
Pattern of Bias Slight trend of error increasing with
increasing liver size Increasing error with increasing liver size
Significance t-test 0.571 0.100
4
Discussion
In order to be useful in disease tracking, surgical planning and treatment monitoring liver volumes need not only to be accurate, but also to be reproducible and reliable. This is particularly important when the method of calculation in-volves subjective operator involvement. While SAIP tools have been demonstrated to have high accuracy,[15, 26, 27] no
literature could be found on the reliability of CT liver vol-umes calculated using semi-automated SAIP’s. However, Sandrasegaranet al. 1999[25] demonstrated high reliability for manual volumetry of the liver (ICC = 0.999 intra -rater and ICC = 0.997 inter -rater) on 35 subjects. Whilst no com-ment can be made for other SAIP tools, this particular tool is simple to use and requires limited training. A short session of approximately 5 minutes is all that is required. One of the raters in this study had been using the tool for approx-imately 6 months prior to the beginning of the study, and one was given a five minute training session just prior to the beginning of the study. The limited training required, and the fact that results were reliable between a technologist ex-perienced in using the package and a technologist who was a novice at using the package, indicates that reliability is achievable independent of operator experience.
Multiple studies have compared SAIP tools to manual vol-umetry. Suzukiet al. 2011[15]compared two different SAIP
tools to the manual volumetry method. One was a pro-prietary Volume Tracing Advanced Vessel Analysis Tool (Philips Healthcare) and the other, an SAIP tool developed by the authors which was based on Geodesic active contour segmentation. This study found that not only did the two SAIP tools correlate well with manual volumetry but that they were significantly faster: providing volume estimates at less than one minute per case compared to manual vol-umetry which took on average 35-40 minutes per case. Sim-ilar results in regards to both the accuracy of measurements and faster measurement times are echoed in the studies by Shin et al. 2013[26] and Nakayama et al. 2006.[27] Our
study also showed semi-automated volume calculations to be faster than reported manual volumetry calculations with all calculations being recorded as taking less than 5 min-utes. It would follow that if SAIP tools have been shown to be accurate compared to manual volumetry and manual vol-umetry has been shown to be reliable, that SAIP tools would also be reliable. This study has indeed confirmed this to be the case, by demonstrating high intra- and inter-rater relia-bility. The CT technologists in this study have over 10 years of experience, but they were both novices at using the
[image:4.612.57.541.325.430.2]www.sciedu.ca/jbgc Journal of Biomedical Graphics and Computing 2015, Vol. 5, No. 2
[image:5.612.75.302.145.302.2]automated Philips liver segmentation and analysis package (Endhoven, The Netherlands). This asserts that consistent volume measurements of the liver can be achieved using this software even where operators have limited experience in the technique.
Figure 3:Intra-rater reliability bland altman plot
Figure 4:Inter-rater reliability bland altman plot
The results of this study showed that a change in liver vol-ume of up to 3.4% could be a result of operator difference rather than a true change in liver volume. When translated back to volume, this dictates that a change in size of the liver of up to 57 cc could be a result of operator difference rather than a true change in liver size. It is thought that this potential bias is acceptable clinically, as review of the
lit-erature shows that as a response mechanism, the liver often increases and decreases in size well past 3.4%.[10, 28–30]
Liver volume assessed 3-4 weeks post portal vein emboli-sation shows an increase in volume of 5% being associated with improved patient outcomes.[8] Lewis et al. 2006[10]
found liver volume reduced by 14% over a six week period following the implementation of a low calorie diet. Edholm et al. 2014[28] showed an average decrease in liver size of
18% in ten female participants following two weeks on a low calorie diet. Van Theil et al. 1987[29] evaluated the
size of two recipient transplant liver patients and showed the liver size in both recipients to increase by an average of 70 cc per day. Jeschkeet al. 2007[30]studied 102 children ex-posed to thermal injury and found their liver size increased on average by 85% in the first two weeks following injury.
With respect to limitations, this study only examined the reliability of the Philips SAIP software (Eindhoven, The Netherlands), although it is likely that similar results would be found for other SAIP tools. The use of only two raters is arguably a potential source of bias, nonetheless it is com-mon practice, and many other papers use only two raters to confirm reliability.[31, 32] A further limitation of this study
is the sample did not contain any participants with resected livers, which is a population who would be examined clini-cally using this technique.
5
Conclusion
The advantage of SAIP tools lies in their ability to quickly and accurately calculate liver volume automatically with only fine adjustment required by the operator. This study has shown that liver volume measurements of both normal and abnormal livers using the Philips SAIP (Endhoven, The Netherlands) can be taken reliably by CT technologists, with confidence that the same results would be obtained between different CT technologists.
Acknowledgements
The authors would like to acknowledge the staff and man-agement of Sound Radiology, Adelaide, South Australia for the use of their equipment and assistance with this study. The authors would also like to acknowledge Philips Health-care for the provision of the Liver Segmentation Software Package.
References
[1] Elstein D, Hadas-Halpern I, Azuri U,et al. Accuracy of ultrasonog-raphy in assessing spleen and liver size in patients with Gaucher disease: comparison to computed tomographic measurements. J Ul-trasound Med. 1997; 16(3): 209-211. PMid: 9166820.
[2] Hausken T, Leotta DF, Helton S. Estimation of the human liver volume and configuration using three-dimensional ultrasonogra-phy: effect of a high-caloric liquid meal. Ultrasound Med Biol. 1998; 24: 1357-1367.http://dx.doi.org/10.1016/S0301-5 629(98)00120-3
[3] Fritschy P, Robotti G, Schneekloth G,et al. Measurement of liver volume by ultrasound and computed tomography. J Clin Ultrasound.
[image:5.612.76.301.346.492.2]1983; 11(4): 299-303. PMid: 6413535.http://dx.doi.org/10. 1002/jcu.1870110602
[4] Soyer P, Roche A, Elias D,et al. Hepatic metastases from colorec-tal cancer; influence of hepatic volumetric analysis on surgical de-cision making. Radiology. 1992; 184: 695-697. PMid: 1509051.
http://dx.doi.org/10.1148/radiology.184.3.1509051
[5] Kauffmann R, Fong Y. Post-hepatectomy liver failure. Hepatobiliary Surg Nutr. 2014; 3(5): 238-246. PMid: 25392835.
[6] Shoup M, Gonen M, D’Angelica M,et al. Volumetric Analysis Pre-dicts Hepatic Dysfunction in Patients Undergoing major Liver Re-section. J Gastrointest Surg. 2003: 7(3): 325-330.http://dx.doi .org/10.1016/S1091-255X(02)00370-0
[7] Ulla M, Ardiles V, Levy-Yeyati E,et al. New surgical strategy to induce liver hypertrophy: role of MDCT-volumetry to monitor and predict liver growth. Hepatogastroenterology. 2013; 60: 337-342. PMid: 23169065.
[8] Ribero D, Abdalla EK, Madoff DC,et al. Portal vein embolization before major hepatectomy and its effects on regeneration, resectabil-ity and outcome. BR J Surg. 2007; 94: 1386-94. PMid: 17583900.
http://dx.doi.org/10.1002/bjs.5836
[9] Vienne A, Hobeika E, Gouya H,et al. Prediction of drainage ef-fectiveness during endoscopic stenting of malignant hilar strictures: the role of liver volume assessment. Gastrointest Endosc. 2010; 72: 728-735. PMid: 20883850.http://dx.doi.org/10.1016/j.g ie.2010.06.040
[10] Lewis MC, Philips ML, Slavotinek JP,et al. Change in liver size and fat content after treatment with Optifast very low calorie diet. Obes. Surg. 2006; 16(6): 697-701. PMid: 16756727.http://dx.doi.o rg/10.1381/096089206777346682
[11] Shore N, Link K, Fernandez A,et al. Non contrasted Computed To-mography for the Accurate Measurement of Liver Steatosis in Obese Patients. Dig Dis Sci. 2011: 56(7): 2145-2151. PMid: 21318585.
http://dx.doi.org/10.1007/s10620-011-1602-5
[12] Caldwell SH, De Lange EE, Gaflq MJ,et al. Accuracy and Sig-nificance of Pretransplant Liver Volume Measured by Magnetic Resonance Imaging. J Liver Transplant Sur. 1996: 2(6): 438-442.
http://dx.doi.org/10.1002/lt.500020606
[13] D’Onofrio M, De Robertis R, Demozzi E, et al. Liver volume-try; is imaging reliable? Personal experience and review of the literature. World J Radiol. 2014; 6(4): 62-71. PMid: 24778768.
http://dx.doi.org/10.4329/wjr.v6.i4.62
[14] Tongyoo A, Pomfret EA, Promposelli JJ. Accurate estimation of liv-ing donor right hemi-liver volume from portal vein diameter mea-surement and standard liver volume calculation. AM J Transplant. 2012; 12: 1229-1239. PMid: 22221803.http://dx.doi.org/1 0.1111/j.1600-6143.2011.03909.x
[15] Van der Vorst JR, Van Dam RM, Van Stiphout RSA,et al. Virtual Liver Resection and Volumetric Analysis of the Future Liver Rem-nant using Open Source Image Processing Software. World J Surg. 2010; 34; 2426-2433. PMid: 20652701.http://dx.doi.org/1 0.1007/s00268-010-0663-5
[16] Suzuki K, Epstein ML, Kohlbrenner R,et al. Quantitative Radiol-ogy: Automated CT Liver Volumetry Compared with Interactive Volumetry and Manual Volumetry. AJR. 2011; 197(4): 706-712. PMid: 21940543.http://dx.doi.org/10.2214/AJR.10.5958
[17] Pomposelli JJ, Ongyoo A, Wald C,et al. Variability of standard liver volume estimation versus software-assisted total liver volume mea-surement. Liver Transplant. 2012; 12: 1229-1239.http://dx.doi .org/10.1002/lt.23461
[18] Baddeley H, Benson M, Liefman,et al. Measurement of liver vol-ume using water delay ultrasonography. Diagn Imaging Clin Med. 1986; 55(6): 330-336. PMid: 3545627.
[19] Gladisch R, Elgner R, Schlauch D,et al. A simple technique for sonographic estimation of liver volume. Gastroenterologie.1988; 26: 694-698.
[20] Leung NWY, Farrant P, Peters TJ. Liver volume measurement by ultrasonography in normal subjects and alcoholic patients. J Hepa-tol. 1986; 2: 157-164.http://dx.doi.org/10.1016/S0168-8 278(86)80074-5
[21] Raeth U, Johnson PH, Williams R. Ultrasound determination of liver size and assessment of patients with malignant liver disease.Liver. 1984; 4(5): 287-293. PMid: 6209520.http://dx.doi.org/10. 1111/j.1600-0676.1984.tb00940.x
[22] Rasmussen SN. Liver volume determination by ultrasonic scan-ning. Br J Radiol. 1972; 45(536): 579-585. PMid: 5045968.http: //dx.doi.org/10.1259/0007-1285-45-536-579
[23] Rasmussen SN. Liver volume determination by ultrasonic scanning. Danish Medical Bulletin. 1978; 25: 1-46. PMid: 627153.
[24] McDowell I. Measuring Health Outcomes. A guide to Rating scales and Questionnaires. Oxford University Press: Oxford, New York; 2006.
[25] Sandrasegaran K, Kwo PW, DiGirolamo D,et al. Measurement of liver volume using spiral CT and the curved line and cubic spline al-gorithms: reproducibility and interobserver variation. Abdom Imag-ing. 1999; 24: 61-65. PMid: 9933675.http://dx.doi.org/10. 1007/s002619900441
[26] Shin CI, Kim SH, Rhim JH,et al. Feasibility of Commercially Avail-able, Fully Automated Hepatic CT Volumetry for Assessing Both Total and Territorial liver Volumes in Liver Transplantation. J Ko-rean SocRadiol. 2013; 68(2): 125-136.http://dx.doi.org/10. 3348/jksr.2013.68.2.125
[27] Nakayama Y, Li Q, Katsuragawa S,et al. Automated Hepatic Vol-umetry for living related liver transplantation at multisection CT. Radiology. 2006; 240(3): 743-748. PMid: 16857979.http://dx .doi.org/10.1148/radiol.2403050850
[28] Edholm D, Kullber J, Karlsson FA,et al. Changes in Liver Volume and Body Composition During Four Weeks of Low Calorie Diet Prior to Laparoscopic Gastric Bypass Obes Surg. 2014; 10(4): 569-766.
[29] Van Thiel DH, Gavaler JS, Kam I,et al. Rapid Growth of an Intact Human Liver Transplanted Into a Recipient Larger Than the Donor. Gastroenterology. 1987; 93(6): 1414-1419. PMid: 3315827. [30] Jeschke MG, Micak RP, Finnerty CC,et al. Changes in liver function
and size after a severe thermal injury. Shock. 2007; 28(2): 172-177. PMid: 17529902.http://dx.doi.org/10.1097/shk.0b013e3 18047b9e2
[31] Franklin B, Gasco J, Uribe T,et al. Diagnostic accuracy and inter-rater reliability of 64-multislice 3D CTA compared to intra-arterial DSA for intracranial aneurysms. J Clin Neuro. 2010; 17(5): 579-583. PMid: 20207150.http://dx.doi.org/10.1016/j.jocn. 2009.09.015