IN
ALLUVIAL STREAMS
Thesis by Brent Dalton Taylor
In Partial Fulfillment of the Requirements For the Degree of
Doctor of Philosophy
California Institute of Technology Pasadena, California
1972
ACKNOWLEDGMENTS
The writer would like to express deep appreciation to his advisor Professor Vito A. Vanoni for kind guidance, encouragement, and
generous assistance during this investigation.
The writer would also like to thank Professor Norman H. Brooks for initially interesting him in graduate study at Caltech: and he and Professor Fredric Raichlen for their helpful interest in the temperature-effects study.
During the experimental investigation and thesis preparation skillful and considerate assistance was given by Mrs. Arvilla F. Krugh, Mrs. Patricia A. Rankin, Mr. Elton F. Daly, Mr. Robert L. Greenway, Mr. Carl A. Green, Jr., Mr. Ronald G. Patterson, and Mr. Carl T. Eastvedt. To each of these people the writer offers his sincere thanks.
The writer wishes also to thank the Civil Engineering Depart-ment at the California Institute of Technology for making possible four years of graduate study in an atmosphere of creativity and excellence.
ABSTRACT
A laboratory investigation was conducted to determine the effects of water temperature on sediment discharge close to the bed (bed-load discharge), and on bed roughness and geometry in alluvial, open-channel flows.
Three types of experiments were made: 1) Low-transport, flat-bed experiments in which all of the sediment discharged moved as bed load; 2) high-transport, flat-bed experiments with fine sands
wherein there was considerable suspended sediment discharge; and 3) a series of experiments where the discharge was kept constant and the velocity varied to produce ripple, dune, and flat-bed configurations. The experiments were made in pairs. In each pair the velocity and depth were the same or nearly the same, but in one experiment the water temperature was from 15°C to 20°c higher than in the other.
It was found that in low-transport, flat-bed flows where particle transport is by rolling and sliding along the bed, a 15°c to 20°c
increase in water temperature can produce a relatively large change in sediment discharge. The nature of this change depends on the flow
temperature. A phenomenological explanation has been presented for these observed temperature effects on sediment discharge.
In high-transport, flat-bed flows with suspended sediment transport, it was observed that the temperature effects on bed-load discharge are qualitatively the same as those which obtain in
low-transport, flat-bed flows of approximately the same boundary Reynolds numbers.
Chapter
1.
2.
3.
TABLE OF.CONTENTS
INTRODUCTION
LITERATURE REVIEW 2. 1 Field Observations
2. 2 Observations in Laboratory Flum.es 2. 3 Formulas for Temperature Effect On
Sediment Transport
2. 3. 1 Rouse's suspended sediment distribution equation
2. 3. 2 Einstein bed-load function
EXPERIMENTAL APPARATUS 3. 1 The 40-ft Flum.e
Page
4
4 7
10
10 12
18 18 3. 1. 1 Sediment discharge sampling apparatus 24
3. 1. 2 Point sediment sampler 27
3. 1. 3 Point velocity measurements 27
3. 2 The 60-ft Flume
29
3. 2. 1 Sediment discharge sampling apparatus 34 3. 2. 2 Bed profile measurement apparatus 36 3. 2. 2. 1 Motorized instrument carriage 38 3. 2. 2. 2 Portable sonic sounder 39 3. 2. 2. 3 D-C Preamplifier and
Chapter
4.
5.
TABLE OF CONTENTS (continued)
3. 2. 2. 4 Analog-to-digital recording unit
3. 2. 2. 5 Bed profile measurement system
3. 3 Sediment Analysis Apparatus 3. 4 Sediments Used as Bed Material
44
46
50 50 3. 4. 1 Fine sands used in series B, F, and G 52 3. 4. 2 Fine gravel used in series C 54 3. 4. 3 Clay aggregate particles used in
series D 54
3. 4. 4 Fine gravel used in series E 55 3. 4. 5 Coarse sand used in series H 55
EXPERIMENTAL PROCEDURE
4. 1 Procedure in Low-Transport, Flat-Bed Experiments
4. 2 Procedure in High-Transport, Flat-Bed Experiments
4. 3 Procedure in Ripple and Dune Bed Experiments
PRESENTATION OF EXPERIMENTAL RESULTS 5. 1 Low-Transport, Flat-Bed Experiments
5. 1. 1 Bed-load discharge hypothesis
5. 1. 2 Low-transport, flat-bed sediment discharge function
5. 1. 3 Sediment discharge sorting in low-transport, flat-bed experiments
58
60
66
69
72 73 83
89
Chapter
6.
7.
TABLE OF CONTENTS (continued)
5. 2 High-Transport, Flat-Bed Experiments 5. 2. 1 Extension of bed-load discharge
hypothesis
5. 3 Constant-Discharge Experiments 5. 3. 1 Spectral analysis of ripple and
95
108 113
dune bed profiles 120
5. 3. 1. 1 Spectral distribution function 121 5. 3. 1. 2 Measurement and analysis of
bed profiles 125
5. 3. 1. 3 Spectral distributions of
ripple and dune beds 129
DISCUSSION OF RESULTS 138
6. 1 Low-Transport, Flat-Bed Flows 138 6. 2 High-Transport, Flat-Bed Flows 144
6. 3 Constant-Discharge Flow 144
6. 4 Temperature Effects in Natural Streams 147
SUMMARY OF CONCLUSIONS 152
7. 1 Conclusions Based on Data From
Low-Tr ans port, Flat-Bed Experiments 152 7. 2 Conclusions Based on Data From
High-Transport, Flat-Bed Experiments 154 7. 3 Conclusions Based on Data From
Constant-Discharge Experiments 155
TABLE OF CONTENTS (continued)
Chapter
APPENDIX A: SUMMARY OF NOTATION 163
APPENDIX B: FALL-VELOCITY SAND SEPARATION 169
APPENDIX C: TABULATION OF POINT VELOCITY AND
POINT SEDIMENT CONCENTRATION
MEASUREMENTS 1 75
APPENDIX D: DISCUSSION OF "EFFECTS OF WATER
TEMPERATURE ON BED-LOAD MOVEMENT'', BY JOHN J. FRANCO; (PUBLISHED IN ASCE
JOURNAL OF WATERWAYS AND HARBORS) 177
APPENDIX E: DISCUSSION OF "INDETERMINATE
HYDRAULICS OF ALLUVIAL CHANNELS", BY THOMAS MADDOCK, JR. (PUBLISHED
IN ASCE JOURNAL OF HYDRAULICS) 186
APPENDIX F: DISCUSSION OF "INITIATION OF RIPPLES
ON FLAT BEDS", BY PHILIP B. WILLIAMS AND PATRICK H. KEMP (PUBLISHED IN
LIST OF FIGURES
Number Description
2. 1
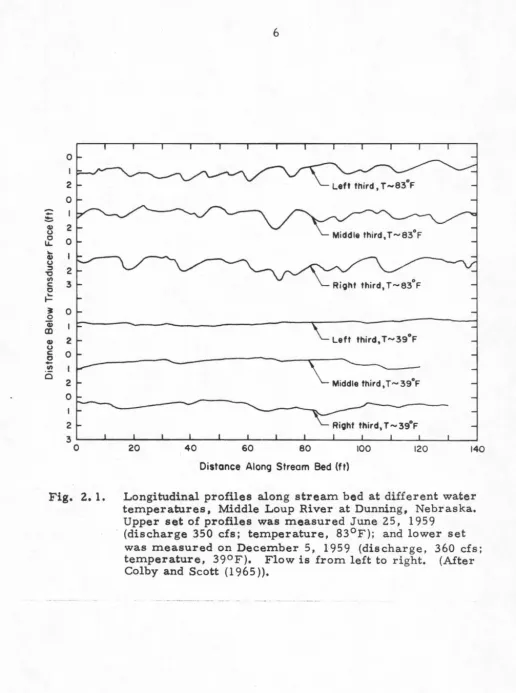
Longitudinal profiles along stream bed at different water temperatures, Middle Loup River at Dunning, Nebraska.2.2
3. 1 3.2 3. 3 3. 4 3. 53.6
3. 7
3.8
3.9
3. 10 3. 11Einstein bed-load function, '¥*versus ~*. Schematic diagram of 40-ft flume.
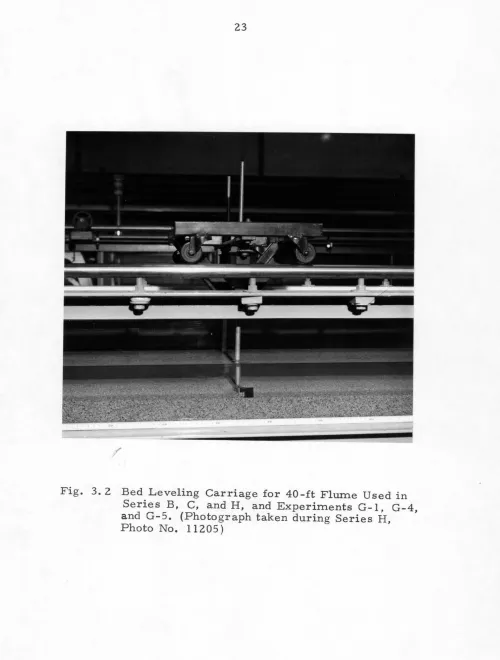
Bed levelling carriage used in 40-ft flume for Series B, C, and H, and experiments G-1, G-4, and G-5.
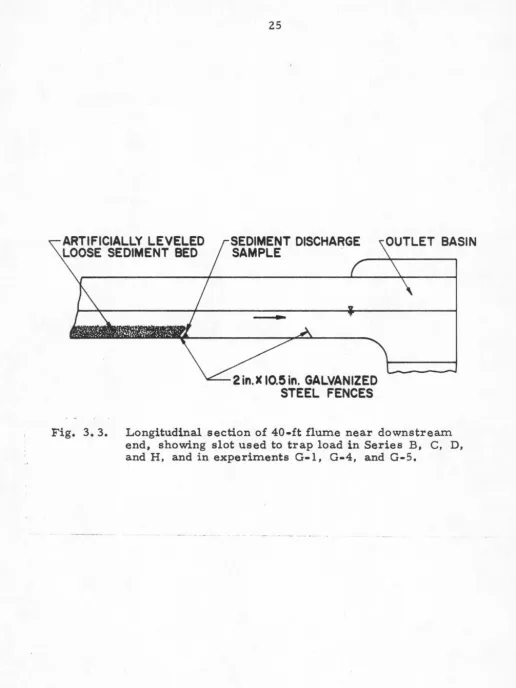
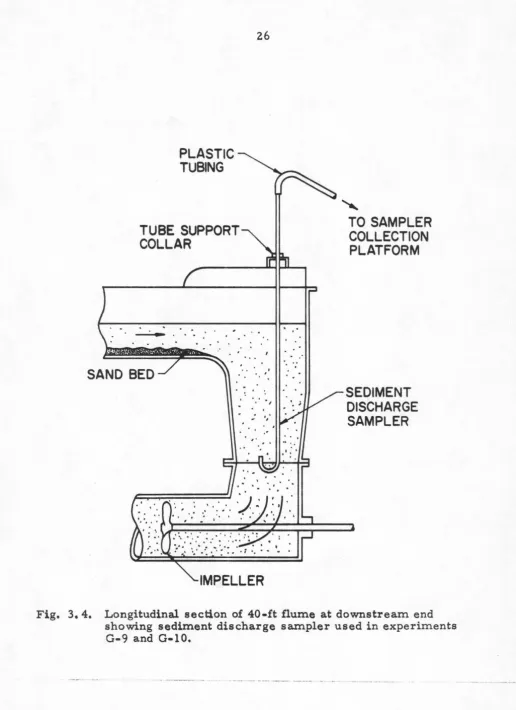
Longitudinal section of 40-ft flwne near downstream end, showing slot used to trap load in Series B, C, D, and H, and in experiments G-1, G-4, and G-5. Longitudinal section of 40-ft flume at downstream end showing sediment discharge sampler used in experiments G-9 and G-10.
Point sampler used in rneasuring suspended
sediment concentrations in 40-ft, and 60-ft flumes. Schematic diagram of 60-ft flume.
Schematic diagram of modified bed leveling carriage used in 60-ft flume for rippled and dune bed experiments of Series F.
Downstream end of 60-ft flwne showing slot used to trap load in Series E. Siphoning tube to remove load samples is also shown.
Schematic diagram of sediment discharge sampling manifold used in 60-ft flume for Series F.
Dual Channel Stream Monitor used to measure bed profiles.
LIST OF FIGURES (continued)
Number Description
3. 12 Data Acquisition System used to digitize analog bed profiles and store digitized output on
magnetic tape.
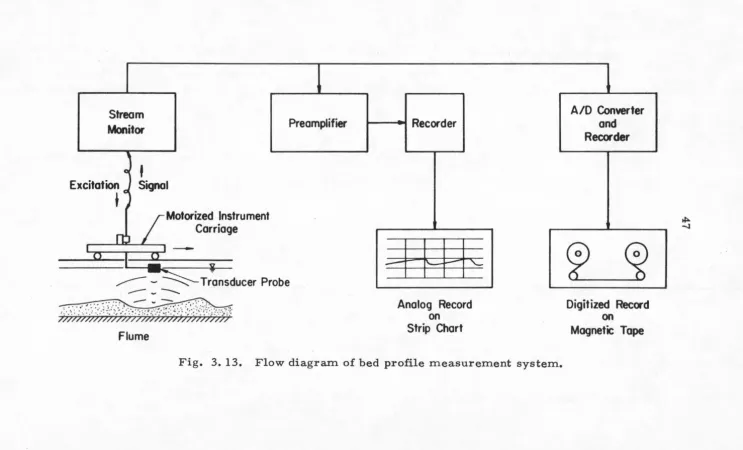
3. 13 Flow diagram of bed profile measurement system. 3. 14 Point-gage and DCSM-system measurements of
artificially-formed, two-dimensional bed configuration.
3. 15 Sieve size distributions of sediments used as bed material.
3. 16
3. 17 3. 18 3. 19 3.20 5. 1 5.2
Microphotograph of silica sand (Nevada #60) from which bed materials used in Series B, F, and G were derived.
Sample of fine gravel used in Series C. Sample of coarse, synthetic clay-aggregate particles used in Series D.
Sample of fine gravel used in Series E. Sample of coarse sand used in Series H.
Variation in 'f b and g with velocity and water
0 s
temperature for experiments of Series B.
Variation in '!" b and g with velocity and water
0 s
temperature for the experiments of Series H. 5. 3 Variation in 'f b and g with velocity and water
0 s
5.4
5.
5
temperature for the experiments of Series C.
Variation in g with run time and water temperature
s
for the experiments of Series E.
Variation in g with run time and water temperature
s
for the experiments of Series D.
LIST OF FIGURES (continued)
Number Description
5. 6 The effect of water temperature on sediment discharge and mean shear stress in a flow of low sediment transport rate over a flat bed. 5. 7 Contours of dimensionless sediment discharge
versus T *b and R*b for low-transport,
flat-5. 8
5. 9
5. 10
5. 11
5. 12
5. 13
5. 14
5. 15
bed experiments.
Normalized dimensionless sediment discharge versus normalized Shields stress for the
experiments of Series B, H, and C.
Concentration profiles for O. 081 mm, and 0. 096 mm size fractions measured along centerline of 60-ft flume in experiment-pair F-23, F-24.
Concentration profiles for 0. l 14mm, and 0. 135 mm size fractions measured along centerline of 60-ft flume in experiment-pair F-23, F-24.
Concentration profiles for O. 160 mm, and 0. 191 mm size fractions measured along centerline of 60-ft flume in experiment-pair F-23, F-24.
Concentration profiles for O. 226 mm size fraction measured along centerline of 60-ft flume in experiment-pair F-23, F-24. Concentration profiles for 0. 081 mm, and O. 096 mm size fractions measured along centerline of 60-ft flume in experiment-pair F-27, F-28.
Concentration profiles for 0. 114 mm, and 0. 135 mm size fractions measured along centerline of 60-ft flume in experiment-pair F-27, F-28.
Concentration profiles for O. 160 mm, and
O. 191 mm size fractions measured along centerline of 60-ft flume in experiment-pair F-27, F-28.
LIST OF FIGURES (continued)
Number Description
5. 16 Concentration profiles for O. 226 mm, and
O. 269 mm size fractions measured along
centerline of 60-ft flume in experiment-pair F-2 7, F-28.
5. 17 Concentration profiles for 0. 322 mm size
fraction measured along centerline of
60-ft flume in experiment-pair F-27, F-28.
5. 18 Concentration profiles measured along centerline
of 40-ft flume in experiment-pair G-9, G-1 O.
5. 19 Velocity profiles measured along flume centerline
in experiments F-23, F-24, F-27, F-28, G-9, and G-10.
5. 20 Variation of log
10 ZU*clK (log 10 w/8) with log10
5.21 5.22 5.23 5.24 5.25 5.26 5.27
w according to straight lines fitted to concentration
s
profiles in Figs. 5. 9 through 5. 18.
Variation in Sf and fb with velocity and water
temperature for the constant-discharge experiments
of Series F.
Variation in g with velocity and water temperature
for the constan8t discharge experiments of Series F.
Ripple and dune bed configurations in experiments
0 0
F-33 (T ,.., 23 C) and F-34 (T ,.., 38 C).
Longitudinal bed profiles measured along centerline of 60-ft flume in experiments F-3 through F-10.
Longitudinal bed profiles measured along centerline of 60-ft flume in experiments F-31 through F-34.
Examples of variation in spectral distributions
computed for ripple and dune bed profile sets.
Mean spectral distributions computed for ripple bed profile sets measured in experiment-pairs F - 3, F - 4; F - 5 , F - 6; and F- 7 , F- 8.
LIST OF FIGURES (continued)
Number Description
5. 28 Mean spectral distributions computed for bed profile sets measured in experiment-pairs F-9, F-10; F-33, F-34; and F-31, F-32.
5. 29 Variation i n ?
/~·orb
with bed friction factor forripple and dune bed experiments of Series F.
6. 1 Dimensionless turbulence intensity versus dimensionless distance above bed for clear-water experiments with a smooth, flat bed; a bed covered with 0. 345 mm sand particles; and a bed covered with 2. 45 mm silicon-carbide particles.
6.
2 Plot of dimensionless transport contour q*b=
l0-2, and incipient transport curve fitted to Shields data by Rouse.133
136
140
Number
3. 1
5. 1
5. 2
5.3
5.4
5. 5
5. 6 5. 7
6. 1
6.2
LIST OF TABLES
Physical Characteristics of Sediments Used as Bed Materials
Summary of Data, Low-Transport, Flat-Bed Experiments
Data from Low-Transport, Flat-Bed Experiments With Well-Sorted, Naturally-worn Silica Wherein Bed-Load Discharge Hypothesis Was Tested
Sediment Discharge Sorting Constants for Low-Transport, Flat-Bed Experiments With
Naturally-Worn Silica.
Summary of Data, High-Transport, Flat-Bed Experiments
Summary of Concentration Profile Data for Different Size Fractions in Flat-Bed
Experiment-Pairs F-23, F-24; F-27, F-28; and G-9, G-10
Summary of Data, Constant-Discharge Experiments
Data From Fine Sand Experiments in Series B and Experiments F-3 and F-4
Data From High-Transport, Flat-Bed Experiments G-8 and G-9
Data From Four Natural Streams.
52
74
88
94
96
97 114
121
146
CHAPTER 1
INTRODUCTION
Water flowing over a bed of loose sediment produces forces on
the sediment particles. If these fluid forces are sufficiently large
particles will be dislodged and transported. Under certain flow
conditions this particle transport will form complex bed waves which
significantly alter the hydraulic roughness of the bed. It is also through
particle transport and deposition that a stream is able to change its
planform and slope.
The practical signifigance of this phenomenon is clear. To
design loose-boundary conveyance channels successfully, or alter the
flow conditions in a natural stream for navigation, flood control, etc. ,
it is important that the engineer understand the mechanics of sediment
transport in order to predict the streams' response to different
alter-ations. Unfortunately present knowledge of this phenomenon is limited.
After more than 50 years of related research the mechanisms which
produce transport and boundary deformation are still not well
under-stood.
Field data and laboratory studies indicate that water temperature
can have a significant effect on sediment transport and bed geometry.
Large changes in sediment discharge and bed roughness have been
observed with temperature changes of 15°C to 30°C in streams at
With a 1° C increase in water temperature over the range 5° C to
so°
C there is a 2% decrease in kinematic viscosity. In a turbulent shearflow this change in viscosity may alter particle fall velocity, and the
flow conditions in a thin layer near the bed, called the viscous sub-layer. Each of these changes affects the hydrodynamic forces on the sediment particles, and thus may also affect particle transport and bed geometry.
The purpose of this study has been to investigate the mechanisms through which temperature may influence sediment discharge and
boundary roughness. Variable-temperature experiments were made in two laboratory flumes with bed materials ranging from fine, naturally-worn, silica sand to coarse, artificial clay-aggregate particles
approxi-mately 18. 5 mm in diameter. The experiments included flows wherein the bed was flat, rippled, and covered with dunes; where all the sedi-ment discharged moved by rolling and sliping along the bed, and flows
carrying large amounts of suspended material.
In Chapter 2 a brief review is given of temperature effects on sediment discharge, bed configuration and roughness that have been
reported; and of Rouse' s suspended distribution theory and Einstein's bed-load function wherein explicit attempts have been made to
incor-porate the effect of water temperature on the relative distribution of suspended sediment, and sediment discharge near the bed.
The 40-ft and 60-ft recirculating flumes and associated apparatus
used in the experiments of this study are described in Chapter 3; and in
Chapter 4 the experimental procedure is outlined for each of the three
The experimental results are presented and briefly discussed in Chapter 5.
In Chapter 6 the experimental results are discussed further, and a phenomenological explanation is advanced for the observed temperature effects on sediment discharge in low-transport, flat-bed flows. In the last section of the~chapter an attempt is made to relate the results obtained in this study with the temperature effects that have been observed in natural streams.
A swnmary of conclusions is given in Chapter 7.
The symbols used are defined where they first appear in the text, and also in Appendix A. In Appendix Ba fall -velocity separation process used to obtain well-sorted size fractions of fine sand is
described. Appendices D, E, and F contain copies of literature
discussions written during the course of the study, each of which deals with the problems of sediment discharge and bed roughness in an
CHAPTER 2
LITERATURE REVIEW
Over the past four decades there have been few contributions to the literature on sedimentation regarding the effects of water temperature. The contributions are primarily expositions of field and laboratory
observations, but there have also been two noteworthy analytical contri-butions - the relative suspended concentration theory developed by Rouse (193 7), and Einstein's (1950) bed-load function.
A review of this literature is given in the following sections.
2. 1 FIELD OBSERVATIONS
In 1949 Lane et al. (1949) reported that data collected on the Lower Colorado River from 1943 to 1947 indicate that "for a given discharge the [suspended] sediment [discharge] . . . may be as much as 2-1 /2 times as great in winter [water temperature T ,.., 55°F] as in summer [T ,..., 85°F]". The sediment discharge along this reach is composed almost entirely of fine-sand bed material, and the discharge is maintained fairly constant by upstream dams.
Lane et al. suggest that the reduction in particle fall velocity at the lower water temperatures is not sufficient to explain the meas
Colby and Scott (1965) have measured the temperature effect on
suspended sediment discharge in the Middle Loup River at Dunning,
Nebraska, the Niobrara River near Cody, Nebraska; and the
Miss-issippi River at St. Louis, Missouri, by correlating water temperature
with observed changes in the coefficient A in the sediment discharge
equation Q
SS
b
= AU , where Q is the measured suspended sediment
SS
discharge, U is the mean velocity of the stream, and A and b are
empirical factors. (Colby (1964) has shown elsewhere that strong
correlation exists between suspended sediment discharge and velocity. )
In each of the three rivers the mean changes in A indicated that the
suspended discharge of bed material is approximately 1. 4 times larger
0 0
at 40 F than at 80 F.
By measuring bed profiles with a sonic sounder in the Middle
Loup River, Colby and Scott also observed changes in bed configuration
with water temperature. On June 25, 1959 with a discharge of 350 cfs
0
and water temperature of 83 F the bed was covered with large
dune-like bed waves (see Fig. 2. 1 ); whereas on December 5, 1959 with a
discharge of 360 cfs but a water temperature of 39°F the bed was nearly
flat. With this flattening of the bed there was a significant reduction in
bed roughness and increase in velocity.
Carey (1963) and Burke (1965) after analyzing bed profiles along
a 200-mile reach of the Lower Mississippi River upstream from New
Orleans, Louisiana, and stage-discharge measurements have observed
that with a reduction in water temperature the heights of river crossings
0
I
2
[image:20.553.14.531.38.732.2]0
...
-
I~ QI u 2
0 lL 0
....
I QI u~ 2
i:l I/) 3 c: 0
.=
3S 0
0 ~ I
CD
QI 2 Left third, T ... 39°F
u c 0
0
-
I/) I Cl2 Middle third, T ... 39°F
0
I
2 3
0 20 40 60 80 100 120 140
Distance Along Stream Bed (ft)
Fig. 2. 1. Longitudinal profiles along stream bed at different water temperatures, Middle Loup River at Dunning, Nebraska. Upper set of profiles was measured June 25, 1959
configuration reduce the channel roughness. Thus at a given stage
low-temperature flows have a larger discharge than high-low-temperature flows.
Comprehensive data compiled as part of a continuing
investi-gation on a seven-mile reach of the Missouri River at Omaha, Nebraska,
by the U.S. Army Corps of Engineers (1969) provide a fairly complete
description of the temperature related phenomena. The river discharge
along this reach is maintained at 30, 000 to 35, 000 cfs for navigational
purposes from April to November, and the bed material is predomi
-nantly fine sand.
Bed profiles measured during August, September, October, and
0 0
November show that as the water temperature drops from 80 F to 45 F
large bed waves present in August are washed out and replaced by a
relatively flat bed in November. This change in bed form reduces
roughness and thereby produces an increase in velocity and a reduction
in depth. Increases of 50% in suspended sediment discharge have been
measured with this reduction in water temperature and change in bed
form.
2. 2 OBSERVATIONS IN LABORATORY FLUMES
Ho (1939) in a series of experiments designed to measure the
effect of a change in water temperature on sediment discharge close to
the bed observed that at approximately the Sanle velocity and depth with
an increase in water temperature over the range
z
0c
to 45°C therewas a relatively large increase in sediment discharge, and an increase
sand (geometric mean size D g
=
1. 40 mm, geometric standard devi-ation of sizes cr=
1. 29); and the bed shear stresses were near theg
values necessary to produce incipient· particle movement, thus sedi-ment transport was accomplished primarily by rolling and sliding along the bed. In each of Ho's experiments there was considerable bed wave development.
Mostafa (1949) made two series of low-transport experiments in a feed-type flume; the water temperature was approximately 65°F
in one series and 130°F in the other. The bed material was medium
sand (D g
=
O. 6 75 mm, CJ g=
1. 13 ). In each experiment the dis chargeand sediment feed rate were set and after equilibrium flow conditions obtained mean depth and friction slope were measured as dependent variables. Bed waves formed on the bed in each experiment.
Mostafa' s data do not indicate a temperature effect on either mean velocity or friction slope for given discharge and sediment discharge.
Vanoni and Brooks (1957) made two experiment-pairs in a recirculating flume with fine sand (D
=
0. 145 mm, cr=
1. 30). Ing g
each experiment-pair the velocity and depth were nearly the same but
in one experiment the water temperature was 15°C, and in the other
0
In the ripple pair when the water temperature was increased to
36
°c
the measured sediment discharge decreased 64% and the computedDarcy-Weisbach friction factor of the bed was reduced 22%. The
ob-served temperature effects in the flat-bed pair were similar. At
38°c
0
the sediment discharge was 51
%
of that at 15 C, and the flat-bedfriction factor was reduced 8% in the warm water flow.
Straub, et al. (1958) conducted a series of variable-temperature
experiments in a recirculating flume using bed material from the
Missouri River (D
=
O. 163 mm,a
=
1. 36). In these high-transportg
g
experiments the bed configuration approached a flat-bed and there was
considerable suspended sediment discharge. As the water temperature
was raised from 35°F to 86 °F the sediment discharge decreased 71
%
and the bed: friction factor was reduced 16%. In these experiments thedischarge was held constant but the mean velocity in the low
tempera-ture experiment was 10% larger than in the high temperatempera-ture
experi-ment.
Straub, et al. measured sediment concentration profiles along
the flume centerline during their experiments. These measurements
indicate that at
86°F
the suspended s.ediment concentrations aboveO. 035 ft from the bed were significantly smaller than those at 35°F.
Hubbel and Ali (1961) made experiments in a recirculating
flume using as bed material sand taken from the bed of the Elkhorn
River near Waterloo, Nebraska (D
=
O. 131 mm,a
=
1. 5). Theg g
0 0
experimental temperatures ranged from 7 C to 35 C and the bed
the results presented by the authors the observed temperature effects
on sediment discharge concentration and bed roughness are not
con-sistent and it is not possible to clearly interpret these results without
additional hydraulic data.
Franco (1968) has presented data from a series of experiments
in a feed-type flume with fine sand (D
= O. 23 mm,
cr=
1. 32) whereing g
the water temperature was varied from 40°F to 80°F. In all
experi-ments the bed was covered with ripples. Franco's data indicate (see
Appendix D) that at a given velocity and depth sediment discharge and
bed roughness are significantly larger at a water temperature of 40°F
0
than at 80 F.
2. 3 FORMULAS FOR TEMPERATURE EFFECT ON SEDIMENT
TRANSPORT
Phenomenological differences between particle transport close
to the bed and transport away from the bed, have led to separate analytic
treatments of these two modes of transport. In two of these formulas
the effect of a change in water temperature on sediment transport are
considered explicitly. These formulas and their development are
reviewed in Sections 2. 3. 1 and 2. 3. 2, respectively.
2. 3. 1 Rouse's Suspended Sediment Distribution Equation
The mean concentration of sediment particles of given
size, shape, and density in a steady, uniform, open-channel flow is
constant at each elevation. This condition can be expressed by the
C(y)w
+
e:
dC(y) = 0s dy (2. 1)
where C(y) is the mean concentration of sediment particles of given
size, sh~pe, and density at elevation y above the bed,
w
is the particle fall velocity, ande:
is the diffusion coefficient for sediment.s
In turbulent flows, if it is assumed that
e:
is related toe:
,
s m
the turbulent diffusion coefficient for momentum by the equation
e:
s=
ae:
m (2. 2)where 13 is constant over the flow depth; and that w does not vary with y Eq. (2. 1) can be integrated using von Karman' s velocity distribution equation to give,
z
.Q.(y) _
(H-y
a )C(a) - y H-a (2. 3)
where C(a) is the mean concentration at y = a, and H is the flow depth. The value of Z is defined by
z -
w
(2. 4)where K is the vonKarman constant, equal to 0. 4 for clear water,
U*b
=
J-r
ob/ p, called bed shear velocity, T0b is the mean bed shear
stress, and p is the fluid density.
Eq. (2. 3) was first presented by Rouse (1937).
Data collected by Vanoni ( 194 6) and others indicate that Eq. (2. 3) approximates the relative sediment distribution in the upper flow region where the assumptions made in its development are valid.
velocity. With a reduction in w Eq. (2. 3) predicts that sediment
con-centration will become more nearly uniform over the flow depth.
Still-water fall velocities of fine and medium silica sand grains increase with
increase in water temperature (ASCE Task Committee on Preparation
of Sedimentation Manual (1962)); thus according to Eq. (2.3) in flows
where there is a suspended transport of fine and medium sands it is to
be expected that with a change in temperature there will also be a
change in the relative distribution of suspended sediment.
2. 3. 2 Einstein Bed-Load Function
Einstein ( 1950) has proposed a set of relations for
com-puting sediment discharge close to the bed (bed-load discharge). With
these relations the temperature effect on the bed-load discharge of
different size particles may be computed.
Einstein's development begins by assuming steady, uniform flow
conditions and equating the number of particles of a given size and
density deposited in a unit area of the bed per second to the number of
particles eroded from a unit area of the bed per second,
(2. 5)
where gB is the bed-load discharge per unit width, iB is the fraction by
weight of bed-load discharge of a particular size, D is the
character-is tic particle diameter, AL is the ratio of the mean particle travel
distance between erosion and deposition to D, (taken by Einstein to
depend only on D), A2 is the ratio of particle volume to D
3
, p is
by weight of bed sediment of size D, P is the probability of a particle s
of size D being eroded per unit time, and A1 is the ratio of the bed area a particle occupies to Da.
Einstein replaces P with P/t1 , where t1 is the exchange time, s
or the time necessary to replace a bed particle by a similar one. Thus P is the total exchange time per unit time. Assuming that t1 is
propor-tional to the time it takes for a particle to fall a distance equal to its own diameter Eq. (Z. 5) becomes
(Z. 6)
where A3
=
t1 w s /D and w s=
still-water particle fall velocity, assumed by Einstein to be given by the relationJ
gD(pps-p)AL is actually a function of P, for after a particle has travelled the mean path length defined by the limiting condition P ... 0 there is a probability P that at its destination the hydrodynamic forces will be
large enough to transport it an additional path length. The mean path length under these circumstances is given by
where ALO is the value of AL for the limiting condition P ... O. Einstein assumes that the conditions for incipient particle movement obtain when the hydrodynamic lift on the particle is
the bed particles may be obtained from the velocity distribution
equation proposed for open channel flows by Keulegan ( 1938).
Einstein and El-Samni (1949) found that with hydrodynamically
rough conditions and uniform bed material the particle lift coefficient
has a value near 0. 178, and that the velocity (u) used to calculate lift
must be measured at y
=
0. 35 D.For non-uniform bed particles u is computed at y = 0. 35X,
where
0. 77K K
x
=
s for s>
1. 80x
Xo'
(2. 7a)K
and
x
=
1. 39o'
for s < 1. 80Xo'
(2. 7b)where K = bed roughness length; for uniform material K = D, for
s s
non-uniform material Ks =
n
65 where
n
65 is the particle size for which 65% by weight are finer.x
is a correction faction in Keulegan' slogarithmic velocity equation which is an empirical function of the
boundary Reynolds number R*b
=
U*bKs/v,
where v is the dynamicviscosity of the fluid, and
o
'
=
11. 6 v/U*b"In addition Einstein applies a lift correction factor Y for
non-uniform bed materials. Y is an empirical function of K
I
o
'.
Fors
particles smaller than 1. 5 X a general lift correction factor i; is
defined to correct for sheltering by other larger particles or the
With some experimental verification (Einstein and El-Sam.ni ( 1949) Einstein takes the variation in particle lift force to be
distri-buted according to the normal error law, with a normalized standard
deviation of 0. 5.
Using these relations P is evaluated by integrating the error
function to determine the time fraction over which the instantaneous lift force at the bed exceeds the buoyant particle weight. Two constants
present in the solution were solved for empirically using data from experiments with uniform bed material. The bed-load discharge function is plotted in Fig. 2. 2 as
(2. 8)
where
= (iB)
gB (
p
)~
~~c
ibpg
(p -p)gD3s s
and U~b
=
JT~b/ p where T~b is the bed shear stress due to grainroughness.
According to Eq. (2. 8) a change in water temperature can effect
the bed-load discharge of uniform bed materials by affecting the viscous
sheltering (s) of the bed particles, and the mean lift velocity. For boundary Reynolds numbers based on grain roughness
(R~'<b = U~'<bK
8
/v) less than a value near 15 (S and X can be expressedis negative due primarily to the reduction in the lift parameter i;. This
reduction in 'l!* indicates an increase in bed-load discharge according to the relation defined in Fig. 2. 2.
For boundary Reynolds numbers larger than a value near 15 but less than 100 the temperature related change in 'l!* is accomplished primarily by the temperature effect on the lift velocity, and an increase in temperature results in an increase in 'l!
*'
there is a reduction in bed-load discharge.For R~b larger than 100 hydrodynamically rough conditions obtain and 'l!* does not vary with water temperature.
Therefore according to Einstein's bed-load function for uniform
bed material, and R~b less than approximately 15 an increase in water
temperature effects an increase in bed-load discharge; for R~<b larger than a value near 15 but less than 100 a temperature increase causes
CHAPTER 3
EXPERIMENTAL APPARATUS
The experiments described in Chapter 4 were made in two
straight flumes of uniform rectangular cross section. The flumes are
located in the W. M. Keck Laboratory of Hydraulics and Water Resources
at the California Institute of Technology, Pasadena, California. Both
are of the recirculating type - the discharge is caught in a small outlet
basin and pumped back to the inlet through a circular pipe. The experi-ments in Series B, C, D, G, and H were made in the 40-ft flume, and
those in Series E and Fin the 60-ft flume. A description of the 40-ft
and 60-ft flumes and their associated apparatus are given in Sections
3. 1 and 3. Z, respectively.
In Section 3. 3 the equipment used to determine the weight, size
distribution and specific gravity of the sediment samples is described;
and in Section 3. 4 a description is given of the nine bed materials that
were used.
3. 1 THE 40-FT FLUME
The 40-ft flume is 10. 5 in. wide and has a working length of
40-ft. A schematic diagram of the flume is given in Fig. 3. 1. An
axial-flow pump connected to a two-speed electric motor through a
variable-drive reducer recirculates the flume discharge (sediment
and water) to the inlet section through a 4 in. return line located in
CD
®
@
~
~
@
., ·1 .,
FLUME toin. X
I0
.
5in
.
II 40 ft.FLOOR LEVEL
LEGEND
VARI-DRIVE MOTOR @ 4- IOOO WATT HEATERS
CIRCULATING PUMP @) INLET SECTION
2 - 8000 WATT t£ATERS @ BAFFLES
PLAN
ELEVATION
RALS FOR CARRIAGE
10 ... 15.3
1
'°
·
5in
.
I
l
IOin.FIXED PIVOT SUPPORT
I
SURFACE DAMPING BOARDTRANSPARENT TUBE INSTRUMENT CARRIAGE
4X3 IN. VENTURI METER RALS FOR CARRIAGE
SLOPE GAGE OBSERVATION WINDOW
@ \
,,..--
'
''ef'J
ADJUSTABLE JACK SUPPORT OUTLET SECTION
SECTION A-A
Fig. 3. 1. Schematic diagram of 40-ft flwne.
...
The flume, pump assembly, and return line are mounted on a
truss which is supported by a pivot near the downstream end and a
manually operated, screw-type jack near the upstream end. This
allows the flume slope to be varied continuously over the range -0. 01
to
+
O. 038. Flume slope can be read directly from a scale locatednear the jack.
There are four 1000-watt immersion heaters located in the
return pipe near the upstream end. Three of the heaters are wired so
they can be operated on 110 volts at 250 watts or on 220 volts at 1000
watts. With these four heaters water temperature in the flume could
be raised from 20°C ambient to approximately 38°c. This
tempera-ture differential was sufficient for the experiments of Series B, C, and
D. But in Series G and H larger temperature differentials were desired.
In order to maintain water temperatures approaching 70°c two
addi-tional 8460-watt immersion heaters were installed in an 8 in. I. D.
section of pipe placed just downstream from the pump housing. One of
the 8460-watt heaters was wired to a variable-inductance powerstat
which afforded continuous control of the heater's output from 0% to 83%
maximum rated power.
A venturi tube (D1 = 4. 04 in. , D2 = 2. 99 in. ) connected to a
vertical, air-water differential manometer which can be read to the
nearest 0. 0005 ft. is located in the return pipe near the upstream end to
measure discharge. The venturi tube had been calibrated prior to this
investigation using clear water and a direct volumetric discharge
A 4 in. I. D. lucite section, 57 in. long located in the return line
'
near the venturi tube provided a means of checking flow conditions in
the pipe. The primary concern was sediment deposition which may
alter the venturi calibration. However in experiments G-9 and G-10
where the sediment discharged through the flume was recirculated, the
mean velocity in the pipe was 151 cm/ sec, and visual observations
indicated that there was no deposition.
In the vertical throat of the inlet section there are two baffles
made from lucite strips glued together in a rectangular grid. The
baffles are spaced 8. 5 in •. apart. Their purpose is to damp the large
scale turbulence and secondary currents created in the return line.
In experiments G-9 and G-10 it was also necessary to float a plywood
board (0. 2 in. thick x 10 in. wide x 27 in. long) above the baffles to
damp surface disturbances produced by the inlet condition.
The flume itself consists of two 10 in. steel channel beams
bolted to a O. 25 in. thick bed plate. In the lower reach glass
observa-tion windows 58 in. long by 8 in. high have been installed in each wall
of the flume. Except for the glass windows the inside walls and bed of
the flume are covered with a bitumastic paint which has a nearly
hydro-dynamically-smooth finish.
Steel rods (1 in. O. D.) mounted on the top flange of the 10 in.
channels which form the side walls act as rails for a metal instrument
To measure water surface and bed elevations in the flume a
brass rod with a conical point on one end {point gage) can be clamped
to a mounting plate on the instrument carriage, and with gear
mech-anisms on the instrument carriage this point gage can be positioned
both laterally and vertically to within 0. 05 mm.
The brass rod point gage can be interchanged easily with a point
sediment sampler {Section 3. 1. 2) or a Pitot tube {Section 3. 1. 3), and
by locating each of these instruments in the same relative position with
respect to the mounting plate all three have the same location for the
same reading on the scales.
Using the point gage and a still water surface in the flume the
variation in the carriage rails and flume bed, and the calibration of the
slope scale were checked. This was done by plotting measured water
surf ace and bed elevations at different stations along the flume and
fitting straight lines to these points. The differences between the
straight-line elevations and the measured elevations were taken to be
the variation in the carriage rails and flume bed. The slope of the
straight line fitted to the carriage rail elevations, which wa.s parallel
with the straight line fitted to the bed elevations, was used to check the
calibration of the flume slope scale. It was found that a flume slope of
zero corresponded to a scale reading of -0. 00032 and that the variation
in the carriage rails and flume bed did not exceed ±0. 5 mm.
The flume has a second carriage, shown in Fig. 3. 2, which can
be used to level loose material on the bed. The carriage consists of a
wheels. Two aluminum rods threaded on one end extend down from the
carriage, and aluminum strips are bolted horizontally to the lower ends
of the rods. The lower edges of these strips act as leveling guides.
Elevation of the guides is set by adjusting wing-nuts on the upper ends
of the support rods.
3. 1. 1 Sediment Discharge Sampling Apparatus
In the low-transport experiments of Series B, C, D, and
H, and experiments G-1, G-4, and G-5 the sediment load was trapped
in a slot near the downstream end of the flume as illustrated in Fig. 3. 3.
The load material in Series D (D
=
18. 5 mm) was removed from theg
sampling slot one particle at a time with a large pair of tweezers. In
the other experiments the load samples were removed by siphoning a
water-sediment mixture out of the slot and into a conical-shaped filter
paper placed in a large metal funnel. The sediment sample remained
in the filter paper and the water drained into a glass container below.
In experiments G-9 and G-10 considerable sediment was
trans-ported in suspension and the load could not be trapped. Therefore in
these experiments a sediment discharge sampling procedure similar to
that employed by Vanoni and Brooks (1957) was used (see Fig. 3. 4).
The sampling tube was made from a 41 in. length of O. 25 in. I. D.
cold-drawn copper tubing. It had a 180° bend in one end, and a circular
sampling tip that had been turned to a thin edge. To sample sediment
discharge the tube was suspended vertically in the throad of the outlet
ARTIFICIALLY LEVELED
LOOSE SEDIMENT BED
SEDIMENT DISCHARGE
SAMPLE
.
2
in.
X 10.5
in.
GALVANIZED
STEEL FENCES
[image:39.553.9.525.42.730.2]PLASTIC
TUBING
TUBE SUPPORT
COLLAR
__....:.._
.
..
,.
.
SAND BED
.
. '.
.
.
. . .. ....
'..
I.
.
IMPELLER
'
TO SAMPLER
COLLECTION
PLATFORM
SEDIMENT
DISCHARGE
SAMPLER
Fig. 3. 4. Longitudinal section of 40-ft flume at downstream end showing sediment discharge sampler used in experiments
[image:40.542.9.525.35.744.2]platform by a 5 ft length of O. 25 in. I. D. plastic hose. The sampling
platform can be raised or lowered to provide the head difference
necessary to match sampling velocity with the mean velocity in the
outlet throat. The sampling velocity was determined from the rate of
flow in the sampler which was obtained by measuring the volume of the
sample and the time to collect it.
3. 1. 2 Point Sediment Sampler
In runs G-9 and G-10 a point sampler made from an
O. 188 in. I. D. brass tube was used to measure suspended
concentra-tions at different elevaconcentra-tions in the flume. The sampling tip had been
flattened to give a vertical opening of O. 040 in. and a horizontal opening
of O. 217 in. (see Fig. 3. 5). This tip design provides a relatively
narrow vertical sampling section which is particularly important in
sampling near the bed where the non-linear velocity and sediment
concentration gradients are large, but offers a fairly large sampling
area so that sampling times need not be inordinately long.
3. 1. 3 Point Velocity Measurements
A O. 250 in. 0. D. Prandtl-type Pitot tube with a O. 075 ih.
tip hole was used to measure local mean velocities in the flume. The
Pitot tube was connected to an air-water vertical differential
~--2.625
in.
3/16 in. BRASS
TUBE
.217
in.
-1
ti
.__ ______________ -...! ~~?==~»
'
.040
in.
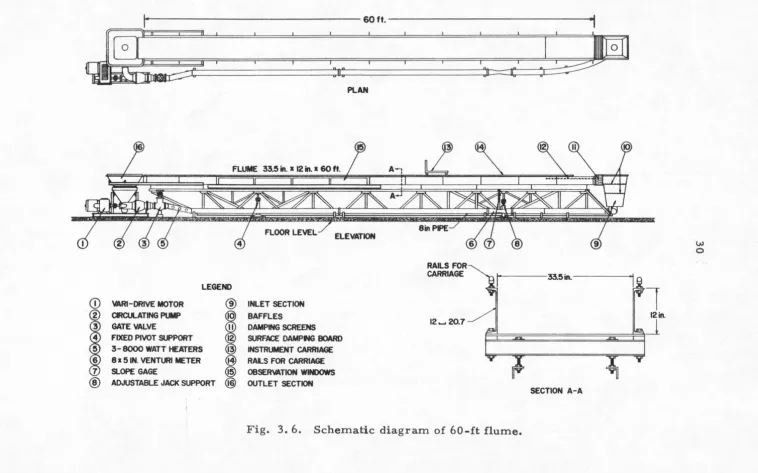
3. 2 THE 60-FT FLUME
The 60-ft flume is shown schematically in Fig. 3. 6. It is
33. 5 in. wide and has a working length of 60-ft. The discharge is
caught in an inverted, pyramidal outlet basin, fed into a 10 in. I. D.
suction of the pump and returned to the inlet box at the upstream end
of the flume through an 8 in. I. D. pipe. The bottom section of the
outlet basin, the pump-electric motor assembly, and the return line
of the flume are permanently bolted to the floor of the laboratory. The
bottom section of the outlet basin is connected to the top section by a
flexible rubber diaphragm; and the upstream end of the return line is
connected to the bottom of the inlet box by a 8. 5 ft length of 8 in. I. D.
reinforced rubber hose. The inlet box, flume, and top section of the
outlet basin are mounted on a truss which is supported by a pivot near
its lower end and a power-driven, screw-type jack at the upper end.
With this mounting the flume can be set to any slope in the range O. 0
to 0. 033. A scale which can be used to measure flume slope is located
near the jack.
The axial-flow pump located in the return line near the
down-stream end of the flume is driven by a two-speed electric motor. The
pump and motor are connected through a variable-drive reducer which
is itself power operated. A gate valve near the pump provides an
additional control of flume discharge.
In order to obtain water temperatures 20°c above ambient
three 220-volt, 8460-watt immersion heaters were installed in a short
FLOOR LEVEL
LEGEND
@ INLET SECTION
Pl.AN
ELEVATION
RAILS FOR
CARRIAGE 33.5in.-
-l
~~ VARI-DRIVE MOTORCR:ULATING PUii>
GATE VALVE
FIXED PIVOT su:>PORT 3- 8000 WATT HEATERS 81 5 IN. VENTURI METER SLOPE GAGE
I
II
3
a
~
F
-
~w
BAFFLES
12 ... 20.7 DAMPING SCREENS
SURFACE DAMPNG BOARD
ADJUSTABLE JACK SUPPORT
@ @) @)
INSTRUMENT CARRIAGE RALS FOR CARRIAGE OBSER'ATION WN>OWS OUTLET SECTION
Fig. 3. 6. Schematic diagram of 60-ft flume.
SECTION A-A
[image:44.781.7.766.21.494.2]The heaters have independent On-Off controls; and one of them was
wired through a variable-inductance powerstat to obtain continuous
control from 0% to 83% maximum power on this heater.
A venturi tube (D1
=
8. 08 in. , D2=
5. 00 in. ) located near theupstream end in the return line is used to measure flume discharge.
The venturi tube was connected to a water-mercury vertical
different-ial manometer which can be read to the nearest O. 0005 ft. A
clear-water calibration of the venturi tube made prior to this investigation
was used to compute flume discharge.
In the inlet box two baffles similar in design to those in the
in-let throat of the 40-ft flume are spaced 9. 5 in. apart. The baffles are
constructed of wood strips O. 88 in. thick and 2 in. wide.
Between the inlet box and the upstream end of the flume there
is a wide, metal slot in the side walls and bed where fine-mesh
screens can be placed to further damp the large scale turbulence
present in the inlet box.
In some of the runs of Series E and F a 0. 6 in. thick plywood
sheet, 8 ft long and 33 in. wide was floated on the water surface just
downstream from the inlet screens to damp surface disturbances
pro-duced by the screens. This plywood sheet was coated with a glass
epoxy resin to prevent it from absorbing water and warping.
The flume itself is constructed of two 12 in. steel channel
beams bolted to a O. 312 in. thick bed plate. One flume wall has a
wall has a single window 29 in. long and 8 in. high. Except for the
glass windows the walls and bed of the flume are covered with a
bitumastic paint.
Steel rods (1. 125 in. O. D.) mounted on the top flange of the
12-in. channel beams that form the side walls serve as carriage rails.
These rails extend from 31 in. below the beginning of the flume to its
downstream end. A metal instrument carriage rides on the rails. An
aluminum point gage, and the point sediment sampler and Pitot tube
used in the 40-ft flume, can be mounted on adjustable gages which in
turn may be clamped to a slotted, 4 in. aluminum channel mounted
horizontally on the instrument carriage. This instrument mounting
afforts an accuracy in vertical positioning of ± O. 05 mm, and in lateral
positioning of
±
O. 5 mm.The flume slope scale was calibrated and the carriage rail and
bed variations checked using the same procedure employed in the 40-ft
flume. The measured carriage rail and bed variations of the flume
were less than ±0. 6 mm.
There is also a leveling carriage for the 60-ft flume. It has
the same basic construction as its counterpart for the 40-ft flume, and
the support rods and leveling guides are virtually identical (see Fig.
3. 2). This carriage was used to level the fine gravel bed material in
Series E.
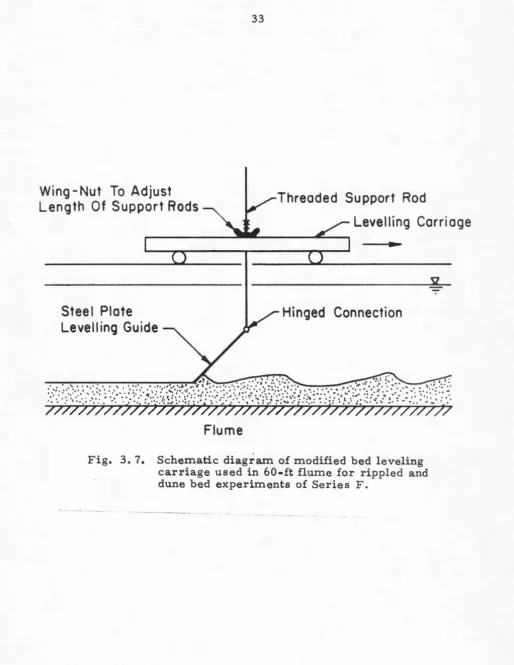
A special leveling guide was attached to the carriage (see Fig.
3. 7) for the ripple and dune bed experiments of Series F. This guide
Wing-Nut To Adjust
Length Of Support Rods
Steel Plate
Levelling Guide
Threaded Support Rod
Levelling Carriage
Hinged Connection
: .
:
"
..
...
.. :
:
.
.. :
...
:
.
...
.
.. :
·
::
.
"
·
:····~·
.
::>~ ./~.':
...
.. :-
:
·
·:
-:
:
.,
::
:.::
.
~·:://:~
·
: .
...
... ·
... :-.
-:_.:~·~
:
..
=i :::.·:.·. :.~
:
"
;:
::
=
~·
;;;;;;;;;
JjjjJ));;
Flume
[image:47.542.10.524.53.718.2]The plate was wired to the lower ends of the vertical support rods
after the regular aluminum strip guides had been removed. The
wire connectors acted as hinges, and by adjusting the length of the
support rods the vertical angle the plate made with the loose bed could
0 0
be set to any value between 0 and 90 . By traversing the bed with
the vertical angle set at approximately 45° small wavelength bed
features could be removed without altering mean bed elevations.
3. 2. l Sediment Discharge Sampling Apparatus
Sediment discharge in the low-transport experiments of
Series E was measured using the same technique employed in the 40-ft
flume, that is, all of the load was deposited in a slot at the lower end
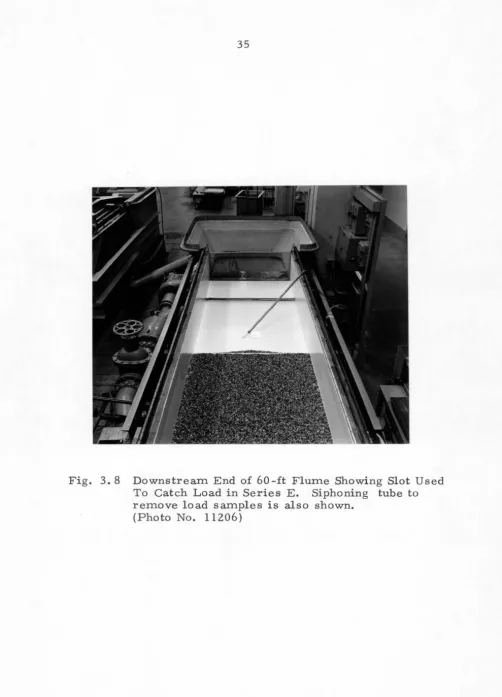
of the flume. The sampling slot is shown in Fig. 3. 8. The cross
members were made of wood strips attached to the flume bed and side
walls with Dow-Corning silicon rubber. A fine-mesh screen 4 in.
wide was nailed to the downstream cross member to prevent sediment
particles that had been swept to the lower end of the slot from being
washed over. A O. 625 in. I. D. aluminum tube with an O. 50 in. I. D.
plastic hose connected to one end was used to siphon the sediment
sample from the slot to a fine-mesh sieve placed on top of a plastic
container. The sediment was caught in the sieve and the water drained
into the plastic container below.
In the fine-sand experiments of Series Fa sediment discharge
sampling technique similar to that used in the 40-ft flume for ex
Fig. 3. 8 Downstream End of 60-ft Flume Showing Slot Used To Catch Load in Series E. Siphoning tube to remove load samples is also shown.
[image:49.548.21.524.37.735.2]sampled at the short vertical section of the return line just below the
outlet basin. The sampling tube, originally used by Vanoni and Brooks
(1957), consists of a 0. 305 in. I. D. brass tube, 9 ft long with a 135°
bend at the outlet end, and a manifold with four vertical sampling tips
at the inlet. The manifold is shown schematically in Fig. 3. 9. The
four sampling tips are made from 0. 136 in. I. D. brass tubing and are
spaced 90° apart on the manifold. The diameters of two
diametrically-opposed tips were reduced by soldering short 0. 093 in. I. D. brass
tubes in the ends. During an experiment only two of the tips were used
for sampling. The inoperative tips were sealed off with masking tape.
The sampling tube was hung through a hole in a 4 in. aluminum
channel mounted horizontally across the top of the outlet basin, by an
adjustable metal collar. The tips were positioned O. 6 in. below the
entrance to the 10 in. I. D. return pipe. A O. 375 in. I. D. plastic hose
connected to the outlet of the sampling tube carried the water-sediment
samples down over the side of the outlet basin to an elevation
approxi-mately Z ft above the laboratory floor where it discharged the mixture
into a conical filter paper. An adjustable metal clamp was attached to
the plastic hose to control the flow rate in the siphon and thereby the
sampling velocity. The sampling velocity was always made equal to
the mean velocity in the pipe at the sampling level.
3.
z.
Z Bed Profile Measurement ApparatusLongitudinal bed profiles were measured in Series F
using a portable sonic sounder, a motorized instrument carriage, and
1
I0.305in
1r-0.0136,or0.093
in
2.6
±
0.1 in
chart recorder was also used to provide a continuous check on the
quality of the signal input to the digital recorder.
3. 2. 2. 1 Motorized instrument carriage
The instrument carriage on the 60-ft flume has a steel
plate which can be used for mounting a D-C electric motor. Vertical
position of the motor can be adjusted so that a rubber-rim.med wheel
mounted on the motor 1 s shaft, makes contact with one of the carriage
rails. In this position the variable-speed motor will drive the
instru-ment carriage in either direction along the flume rails.
The electric motor was wired to a variable-resistance
control-ler through a small box which enabled dead-man micro-switches at
either end of the flume to open the circuit and prevent the motorized
carriage from going much beyond the test reach. The micro-switches
were activated by a small cam bolted to the side of the carriage.
An electric timer activated by two additional micro-switches
located at the upstream and downstream ends of the 14-rneter study
reach was used to measure mean carriage speed over the reach.
Using a stop watch the variation in carriage speed along the
study reach was measured by comparing the mean speed over short
distances with the mean carriage speed over the 14-meter study reach.
These checks indicated that the variation in speed was random and did
3. 2. 2. 2 Portable sonic sounder
The portable sonic sounder that was used is sold
com-mercially as a Dual Channel Stream Monitor (DCSM), Model 1042 by
Automation Industries, Inc. of Boulder, Colorado. A DCSM similar
to the model used in this investigation has been described in detail by Karaki, et al (1961 ).
The DCSM was developed to monitor water surface and bed
profiles in an alluvial channel. It operates on 115 volts AC or a small
battery pack. The Model 1042 DCSM is shown in Fig. 3. 10. The main
unit is encased in a hard-plastic box. Two 40-ft coaxial cables connect
this unit to the long end of a metal L-shaped probe. Acoustic
trans-ducers are attached to the other end of the probe. These transtrans-ducers
which are cylindrical in shape are made of ceramic barium titrate,
rendered piezoelectric by permanent polarization. When an electric
potential is placed across opposite sides of the piezoelectric material
a deformation takes place along a specific axis. Conversely, when the
material is subjected to stress along a certain axis an electric
poten-tial is pr.oduced. This property enables the transducers to transmit
and receive acoustic signals in water.
The ceramic transducers are highly directional. By measuring
the time it takes for an acoustic signal generated by the transducer and
directed toward the stream bed to be reflected back the distance to the
•
·
[image:54.547.12.523.45.738.2]There are five functional parts in the main unit of the DCSM:
an electric clock, signal pulser, receiver, computer, and power
supply. The electronic clock provides a time base. Signals from this
clock are used to fire both pulsers and to set both computers. When a
signal from the clock fires a pulser, a similar clock signal is fed to
the appropriate computer. These signals start the timing cycle of the
computer and activate the pulser such that an acoustic signal is
gener-ated at the transducer. When an echo is received it is fed into the
appropriate computer as a reset signal which turns off the computer.
The output from the computer is a square-wave voltage. While
the computer timer is operating the otherwise constant output voltage
is reduced by 10 volts. A D-C Suppression Box integrates the
square-wave signal from the computer and thereby provides a continuous D-C
signal with a maximum variation of 10 volts. This box can also be
used to reduce the base voltage of the output signal.
In order to eliminate the problem of multiple echoes a
sensi-tivity control is provided on each channel. This control can be adjusted
so that the computer will respond only to the primary echo.
The DCSM Model 1042 is built with an operating frequency of
one megacycle and possible ranges of 1 ft, 5 ft, and 10 ft. Increasing
the range reduces the electronic clock repetition rate, and thus
re-duces signal resolution. To increase signal resolution the unit used
in this investigation had been modified during a prior study (Squarer
(1970 )) to operate on a frequency of 2. 5 megacycles with ranges of
The DCSM was calibrated in the 60-ft. flume with a flat bed
and a water depth of approximately l 9cm, for two different water
0 0
temperatures 23 C, and 38 C. These were the water temperatures
and depth which obtained during bed profile measurements in the
experiments of Series F. At 23°C the calibration for the DCSM was
21. 26 cm/v, and at 38°C 21. 84 cm/v.
3. 2. 2. 3 D-C Preamplifier and single-channel recorder
The preamplifier and recorder that were used fo monitor
the signal output from the DCSM are sold commercially as D- C
Coupling Preamplifier, Model 151-1300; and Single-Channel Recorder,
Model 151-lOOA by the Sanborn Company of Waltham, Mass. These
units are shown in Fig. 3. 11.
The input signal is fed to a preamplifier. This preamplifier
amplifies the signal and supplies it to a driver amplifier which operates
a galvanometer in the recorder. A heated stylus attached to the
D'Arsonval movement galvanometer passes over a special
plastic-coated paper with a rectilinear grid 5 cm wide manufactured by the
Sanborn Company. The hot stylus melts the plastic coating to produce
a thin permanent trace. Maximum deflection of this trace is ±2. 5 cm.
A second heated stylus triggered manually or by an automatic timer
produces a marker trace along the lower margin of the strip chart.
The recording paper can be driven at selected speeds ranging from
Fig. 3. 11 D-C Coupling Preamplifier (left), and Single -Channel Recorder (right) Used to Monitor Input Signal to Digital Recorder.
[image:57.543.8.525.52.716.2]The D-C Coupling Preamplifier has an attenuatbr control which
introduces fixed attenuation factors between 1 and 1000, and a D- C
suppression control which can be used to reduce the base voltage of the
input signal.
3. 2. 2. 4 Analog-to-digital recording unit
The analog-to• digital recorder used to store the bed
profiles data on magnetic tape for computer processing is sold
com-mercially as a Data Acquisition System (DAS), 1103 Series by Digital
Data Systems of Northridge, Calif.
The DAS unit is shown in Fig. 3. 12. It will accept up to eight
channels of input voltages in the ranges ±1 v, ±5 v, ±10 v. Digiti ..
zing resolution is one part in 2047. Thus for the ± 1 v range the
digiti-zed signal is given to ±0. 001 v; whereas with the ±5 v and ±10 v
ranges the digitized signal is given to ± O. 01 v.
The input voltages are sampled by a high-speed switching
cir-cuit, ranging through eight channels in ten microseconds. This
scan-ning rate is independent of actual signal sampling frequency. The
sampling frequency can be set at selected values ranging from one
sample per 100 seconds to 1600 samples per second (200 samples per
second per channel if eight channels are used).
The sampled voltage from a particular channel goes to an
analog-to-digital converter which converts the voltage to a binary
signal which in turn is converted to a Binary Coded Decimal (Okoye
and Raichlen (1969)). The digitized sample can then be displayed on
in a memory unit. The DAS has two memory units. Each will hold
336 digitized samples