elife.elifesciences.org
Extinction risk and conservation of the
world’s sharks and rays
Nicholas K Dulvy
1,2*, Sarah L Fowler
3, John A Musick
4, Rachel D Cavanagh
5, Peter
M Kyne
6, Lucy R Harrison
1,2, John K Carlson
7, Lindsay NK Davidson
1,2, Sonja V
Fordham
8, Malcolm P Francis
9, Caroline M Pollock
10, Colin A Simpfendorfer
11,12,
George H Burgess
13, Kent E Carpenter
14,15, Leonard JV Compagno
16, David A
Ebert
17, Claudine Gibson
3, Michelle R Heupel
18, Suzanne R Livingstone
19,
Jonnell C Sanciangco
14,15, John D Stevens
20, Sarah Valenti
3, William T White
201
IUCN Species Survival Commission Shark Specialist Group, Department of Biological
Sciences, Simon Fraser University, Burnaby, Canada;
2Earth to Ocean Research Group,
Department of Biological Sciences, Simon Fraser University, Burnaby, Canada;
3IUCN
Species Survival Commission Shark Specialist Group, NatureBureau International,
Newbury, United Kingdom;
4Virginia Institute of Marine Science, College of William and
Mary, Gloucester Point, United States;
5British Antarctic Survey, Natural Environment
Research Council, Cambridge, United Kingdom;
6Research Institute for the Environment
and Livelihoods, Charles Darwin University, Darwin, Australia;
7Southeast Fisheries Science
Center, NOAA/National Marine Fisheries Service, Panama City, United States;
8Shark
Advocates International, The Ocean Foundation, Washington, DC, United States;
9
National Institute of Water and Atmospheric Research, Wellington, New Zealand;
10Global
Species Programme, International Union for the Conservation of Nature, Cambridge,
United Kingdom;
11Centre for Sustainable Tropical Fisheries and Aquaculture, James Cook
University, Townsville, Australia;
12School of Earth and Environmental Sciences, James
Cook University, Townsville, Australia;
13Florida Program for Shark Research, Florida
Museum of Natural History, University of Florida, Gainsville, United States;
14IUCN Species
Programme Species Survival Commission, Old Dominion University, Norfolk, United
States;
15Conservation International Global Marine Species Assessment, Old Dominion
University, Norfolk, United States;
16Shark Research Center, Iziko, South African Museum,
Cape Town, South Africa;
17Pacific Shark Research Center, Moss Landing Marine
Laboratories, Moss Landing, United States;
18School of Earth and Environmental Sciences,
Australian Institute of Marine Science, Townsville, Australia;
19Global Marine Species
Assessment, Biodiversity Assessment Unit, IUCN Species Programme, Conservation
International, Arlington, United States;
20Marine and Atmospheric Research,
Commonwealth Scientific and Industrial Research Organisation, Hobart, Australia
Abstract
The rapid expansion of human activities threatens ocean-wide biodiversity. Numerous marine animal populations have declined, yet it remains unclear whether these trends are symptomatic of a chronic accumulation of global marine extinction risk. We present the first systematic analysis of threat for a globally distributed lineage of 1,041 chondrichthyan fishes—sharks, rays, and chimaeras. We estimate that one-quarter are threatened according to IUCN Red List criteria due to overfishing (targeted and incidental). Large-bodied, shallow-water species are at greatest risk and five out of the seven most threatened families are rays. Overall chondrichthyan extinction risk is substantially higher than for most other vertebrates, and only one-third of species are considered safe. Population depletion has occurred throughout the world’s ice-free waters, but is particularly prevalent in the Indo-Pacific Biodiversity Triangle and Mediterranean Sea. Improved management of fisheries and trade is urgently needed to avoid extinctions and promote population recovery.DOI: 10.7554/eLife.00590.001
*For correspondence: dulvy@
sfu.ca
Competing interests: The
authors declare that no competing interests exist.
Funding:See page 27
Received: 29 January 2013
Accepted: 05 December 2013
Published: 21 January 2014
Reviewing editor: Ian T Baldwin,
Max Planck Institute for Chemical Ecology, Germany
Ecology
Introduction
Populations and species are the building blocks of the communities and ecosystems that sustain humanity through a wide range of services (Mace et al., 2005; Díaz et al., 2006). There is increasing evidence that human impacts over the past 10 millennia have profoundly and permanently altered biodiversity on land, especially of vertebrates (Schipper et al., 2008; Hoffmann et al., 2010). The oceans encompass some of the earth’s largest habitats and longest evolutionary history, and there is mounting concern for the increas-ing human influence on marine biodiversity that has occurred over the past 500 years (Jackson, 2010). So far our knowledge of ocean biodiversity change is derived mainly from retrospective analyses usually limited to biased subsamples of diversity, such as: charismatic species, commercially-important fisheries, and coral reef ecosystems (Carpenter et al., 2008; Collette et al., 2011; McClenachan et al., 2012; Ricard et al., 2012). Notwithstanding the limitations of these biased snapshots, the rapid expansion of fisheries and globalized trade are emerging as the principal drivers of coastal and ocean threat (Polidoro et al., 2008; Anderson et al., 2011b; McClenachan et al., 2012). The extent and degree of the global impact of fisheries upon marine biodiversity, however, remains poorly understood and highly contentious. Recent insights from ecosystem models and fisheries stock assessments of mainly data-rich northern hemisphere seas, suggest that the status of a few of the best-studied exploited species and ecosystems may be improving (Worm et al., 2009). However, this view is based on only 295 populations of 147 fish species and hence is far from representative of the majority of the world’s fisheries and fished species, especially in the tropics for which there are few data and often less management (Sadovy, 2005; Newton et al., 2007; Branch et al., 2011; Costello et al., 2012; Ricard et al., 2012).
Overfishing and habitat degradation have profoundly altered populations of marine animals (Hutchings, 2000; Lotze et al., 2006; Polidoro et al., 2012), especially sharks and rays (Stevens et al., 2000; Simpfendorfer et al., 2002; Dudley and Simpfendorfer, 2006; Ferretti et al., 2010). It is not clear, however, whether the population declines of globally distributed species are locally reversible or symptomatic of an erosion of resilience and chronic accumulation of global marine extinction risk (Jackson, 2010; Neubauer et al., 2013). In response, we evaluate the scale and intensity of overfishing through a global systematic evaluation of the relative extinction risk for an entire lineage of exploited marine fishes—sharks, rays, and chimaeras (class Chondrichthyes)—using the Red List Categories and Criteria of the International Union for the Conservation of Nature (IUCN). We go on to identify, (i) the life
eLife digest
Ocean ecosystems are under pressure from overfishing, climate change, habitat destruction and pollution. These pressures have led to documented declines of some fishes in some places, such as those living in coral reefs and on the high seas. However, it is not clear whether these population declines are isolated one-off examples or, instead, if they are sufficiently widespread to risk the extinction of large numbers of species.Most fishes have a skeleton that is made of bone, but sharks and rays have a skeleton that is made of cartilage. A total of 1,041 species has such a skeleton and they are collectively known as the Chondrichthyes. To find out how well these fish are faring, Dulvy et al. worked with more than 300 scientists around the world to assess the conservation status of all 1,041 species.
Based on this, Dulvy et al. estimate that one in four of these species are threatened with extinction, mainly as a result of overfishing. Moreover, just 389 species (37.4% of the total) are considered to be safe, which is the lowest fraction of safe species among all vertebrate groups studied to date.
The largest sharks and rays are in the most peril, especially those living in shallow waters that are accessible to fisheries. A particular problem is the ‘fin trade’: the fins of sharks and shark-like rays are a delicacy in some Asian countries, and more than half of the chondrichthyans that enter the fin trade are under threat. Whether targeted or caught by boats fishing for other species, sharks and rays are used to supply a market that is largely unmonitored and unregulated. Habitat degradation and loss also pose considerable threats, particularly for freshwater sharks and rays.
Ecology
history and ecological attributes of species (and taxonomic families) that render them prone to extinction, and (ii) the geographic locations with the greatest number of species of high conservation concern.
Chondrichthyans make up one of the oldest and most ecologically diverse vertebrate lineages: they arose at least 420 million years ago and rapidly radiated out to occupy the upper tiers of aquatic food webs (Compagno, 1990; Kriwet et al., 2008). Today, this group is one of the most speciose lineages of predators on earth that play important functional roles in the top-down control of coastal and oce-anic ecosystem structure and function (Ferretti et al., 2010; Heithaus et al., 2012; Stevens et al., 2000). Sharks and their relatives include some of the latest maturing and slowest reproducing of all vertebrates, exhibiting the longest gestation periods and some of the highest levels of maternal investment in the animal kingdom (Cortés, 2000). The extreme life histories of many chondrichthyans result in very low population growth rates and weak density-dependent compensation in juvenile sur-vival, rendering them intrinsically sensitive to elevated fishing mortality (Musick, 1999b; Cortés, 2002; García et al., 2008; Dulvy and Forrest, 2010).
Chondrichthyans are often caught as incidental, but are often retained as valuable bycatch of fish-eries that focus on more productive teleost fish species, such as tunas or groundfishes (Stevens et al., 2005). In many cases, fishing pressure on chondrichthyans is increasing as teleost target species become less accessible (due to depletion or management restrictions) and because of the high, and in some cases rising, value of their meat, fins, livers, and/or gill rakers (Fowler et al., 2002; Clarke et al., 2006; Lack and Sant, 2009). Fins, in particular, have become one of the most valuable seafood commodities: it is estimated that the fins of between 26 and 73 million individuals, worth US$400-550 million, are traded each year (Clarke et al., 2007). The landings of sharks and rays, reported to the Food and Agriculture Organization of the United Nations (FAO), increased steadily to a peak in 2003 and have declined by 20% since (Figure 1A). True total catch, however, is likely to be 3–4 times greater than reported (Clarke et al., 2006; Worm et al., 2013). Most chondrichthyan catches are unregulated and often misidentified, unrecorded, aggregated, or discarded at sea, resulting in a lack of species-specific landings information (Barker and Schluessel, 2005; Clarke et al., 2006; Iglésias et al., 2010; Bornatowski et al., 2013). Consequently, FAO could only be ‘hopeful’ that the catch decline is due to improved management rather than being symptomatic of worldwide overfishing (FAO, 2010). The reported chondrichthyan catch has been increasingly dominated by rays, which have made up greater than half of reported taxonomically-differentiated landings for the past four decades (Figure 1B). Chondrichthyan landings were worth US$1 billion at the peak catch in 2003, since then the value has dropped to US$800 million as catch has declined (Musick and Musick, 2011). A main driver of shark fishing is the globalized trade to meet Asian demand for shark fin soup, a traditional and usually expensive Chinese dish. This particularly lucrative trade in fins (not only from sharks, but also of shark-like rays such as wedgefishes and sawfishes) remains largely unregulated across the 86 countries and territories that exported >9,500 mt of fins to Hong Kong (a major fin trade hub) in 2010 (Figure 1C).
Results
Red List status of chondrichthyan species
Ecology
Drivers of threat
[image:4.612.38.454.56.398.2]The main threats to chondrichthyans are overexploitation through targeted fisheries and incidental catches (bycatch), followed by habitat loss, persecution, and climate change. While one-third of threat-ened sharks and rays are subject to targeted fishing, some of the most threatthreat-ened species (including sawfishes and large-bodied skates) have declined due to incidental capture in fisheries targeting other species. Shark-like rays, especially sawfishes, wedgefishes and guitarfishes, have some of the most valu-able fins and are highly threatened. Although the global fin trade is widely recognized as a major driver of shark and ray mortality, demand for meat, liver oil, and even gillrakers (of manta and other devil rays) also poses substantial threats. Half of the 69 high-volume or high-value sharks and rays in the global fin trade are threatened (53.6%, n = 37), while low-value fins often enter trade as well, even if meat demand is the main fishery driver (Supplementary file 2A). Coastal species are more exposed to the combined threats of fishing and habitat degradation than those offshore in pelagic and deepwater ecosystems. In coastal, estuarine, and riverine habitats, four principal processes of habitat degradation (residential and commercial development, mangrove destruction, river engineering, and pollution) jeopardize nearly one-third of threatened sharks and rays (29.8%, n = 54 of 181, Supplementary file 2B). The combined effects of overexploitation and habitat degradation are most acute in freshwater, where over one-third (36.0%) of the 90 obligate and euryhaline freshwater chondrichthyans are threatened.
Figure 1. The trajectory and spatial pattern of chondrichthyan fisheries catch landings and fin exports. (A) The landed catch of chondrichthyans reported to the Food and Agriculture Organization of the United Nations from 1950 to 2009 up to the peak in 2003 (black) and subsequent decline (red). (B) The rising contribution of rays to the taxonomically-differentiated global reported landed catch: shark landings (light gray), ray landings (black), log ratio [rays/sharks], (red). Log ratios >0 occur when more rays are landed than sharks. The peak catch of taxonomically-differentiated rays peaks at 289,353 tonnes in 2003. (C) The main shark and ray fishing nations are gray-shaded according to their percent share of the total average annual chondrichthyan landings reported to FAO from 1999 to 2009. The relative share of shark and ray fin trade exports to Hong Kong in 2010 are represented by fin size. The taxonomically-differenti-ated proportion excludes the ‘nei’ (not elsewhere included) and generic ‘sharks, rays, and chimaeras’ category.
Ecology
Their plight is exacerbated by high habitat-specificity and restricted geographic ranges (Stevens et al., 2005). Specifically, the degradation of coastal, estuarine and riverine habitats threatened 14% of sharks and rays: through residential and commercial development (22 species, including river sharks Glyphis spp.); mangrove destruction for shrimp farming in Southeast Asia (4 species, including Bleeker’s varie-gated stingray Himantura undulata); dam construction and water control (8 species, including Mekong freshwater stingray Dasyatis laosensis), and pollution (20 species). Many freshwater sharks and rays suffer multiple threats and have narrow geographic distributions, for example the Endangered Roughnose stingray (Pastinachus solocirostris) that is found only in Malaysian Borneo and Indonesia (Kalimantan, Sumatra and Java). Population control of sharks, in particular due to their perceived risk to people, fishing gear, and other fisheries has contributed to the threatened status of at least 12 species (Supplementary file 2B). Sharks and rays are also threatened due to capture in shark control nets (e.g. Dusky shark Carcharhinus obscurus), and persecution to minimise: damage to fishing nets (e.g. Green sawfish Pristis zijsron); their predation on aquacultured molluscs (e.g. Estuary stingray
Dasyatis fluviorum); interference with spearfishing activity (e.g. Grey nurse shark Carcharias taurus),
and the risk of shark attack (e.g. White shark Carcharodon carcharias). So far the threatened status of only one species has been directly linked to climate change (New Caledonia catshark Aulohalaelurus
kanakorum, Supplementary file 2B). the climate-sensitivity of some sharks has been recognized (Chin et al., 2010) and the status of shark and ray species will change rapidly in climate cul-de-sacs, such as the Mediterranean Sea (Lasram et al., 2010).
Correlates and predictors of threat
[image:5.612.36.577.75.166.2]Elevated extinction risk in sharks and rays is a function of exposure to fishing mortality coupled with their intrinsic life history and ecological sensitivity (Figures 2–6). Most threatened chondrichthyan species are found in depths of less than 200 m, especially in the Atlantic and Indian Oceans, and the Western Central Pacific Ocean (79.6%, n = 144 of 181, Figure 2). Extinction risk is greater in larger-bodied Table 1. Observed and predicted number and percent of chondrichthyan species in IUCN Red List categories
Taxon
Species number (%)
Threatened
species number (%) CR EN VU NT LC DD
Skates and rays 539 (51.8) 107 (19.9) 14 (1.3) 28 (2.7) 65 (6.2) 62 (6.0) 114 (11.0) 256 (24.6)
Sharks 465 (44.7) 74 (15.9) 11 (1.1) 15 (1.4) 48 (4.6) 67 (6.4) 115 (11.0) 209 (20.1)
Chimaeras 37 (3.6) 0 0 0 0 3 (0.3) 12 (1.2) 22 (2.1)
All observed 1041 181 (17.4) 25 (2.4) 43 (4.1) 113 (10.9) 132 (12.7) 241 (23.2) 487 (46.8)
All predicted 249 (23.9) – – – 312 (29.9) 389 (37.4) 91 (8.7)
CR, Critically Endangered; EN, Endangered; VU, Vulnerable; NT, Near Threatened; LC, Least Concern; DD, Data Deficient. Number threatened is the sum total of the categories CR, EN and VU. Species number and number threatened are expressed as percentage of the taxon, whereas the percentage of each species in IUCN categories is expressed relative to the total number of species.
DOI: 10.7554/eLife.00590.004
Table 2. Number and percent of chondrichthyans in IUCN Red List categories by their main habitats
Habitat Species (%) Threatened (%) CR (%) EN (%) VU (%) NT (%) LC (%) DD (%)
Coastal and continental
shelf 482 (46.3) 127 (26.3) 20 (4.1) 26 (5.4) 81 (16.8) 73 (15.1) 97 (20.1) 185 (38.4)
Neritic and
epipelagic 39 (3.7) 17 (43.6) 0 3 (7.7) 14 (35.9) 13 (33.3) 5 (12.8) 4 (10.3)
Deepwater 479 (46.0) 25 (5.2) 2 (0.4) 6 (1.3) 17 (3.5) 45 (9.4) 133 (27.8) 276 (57.6)
Mesopelagic 8 (0.8) 0 0 0 0 0 4 (50.0) 4 (50.0)
Freshwater (obligate
species only) 33 (3.2) 12 (36.4) 3 (9.1) 8 (24.2) 1 (3.0) 1 (3.0) 2 (6.1) 18 (54.5)
Totals 1041 181 (17.4) 25 (2.4) 43 (4.1) 113 (10.9) 132 (12.7) 241 (23.2) 487 (46.8)
[image:5.612.34.578.571.698.2]Ecology
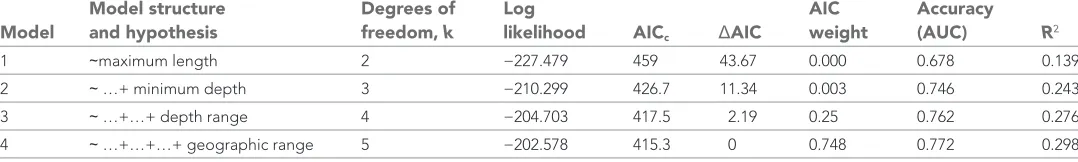
species found in shallower waters with narrower depth distributions, after accounting for phyloge-netic non-independence (Figures 3 and 4). The traits with the greatest relative importance (>0.95) are maximum body size, minimum depth, and depth range. In comparison, geographic range (measured as Extent of Occurrence) has a much lower relative importance (0.79, Figure 3), and in the predictive models it improved the variance explained by 2% and the prediction accuracy by 1% (Table 3). The prob-ability that a species is threatened increases by 1.2% for each 10 cm increase in maximum body length, and decreases by 10.3% for each 50 m deepening in the minimum depth limit of species. After ac-counting for maximum body size and minimum depth, species with narrower depth ranges have a 1.2% greater threat risk per 100 m narrowing of depth range. There is no significant interaction between depth range and minimum depth limit. Geographic range, measured as the Extent of Occurrence, varies over six orders of magnitude, between 354 km2 and 278 million km2 and is positively correlated with body size (Spearman’s ρ = 0.58), and hence is only marginally positively related to extinction risk over and above the effect of body size. Accounting for the body size and depth effects, the threat risk increases by only 0.5% for each 1,000,000 km2 increase in geographic range (Table 4). The explanatory and predictive power of our life history and geographic distribution models increased with complexity, though geographic range size contributed relatively little additional explanatory power and a high degree of uncertainty in the parameter estimate (Tables 3 and 4). The maximum variance explained was 69% (Table 4) and the predictive models (without controlling for phylogeny) explained 30% of the variance and prediction accuracy was 77% (Table 3).
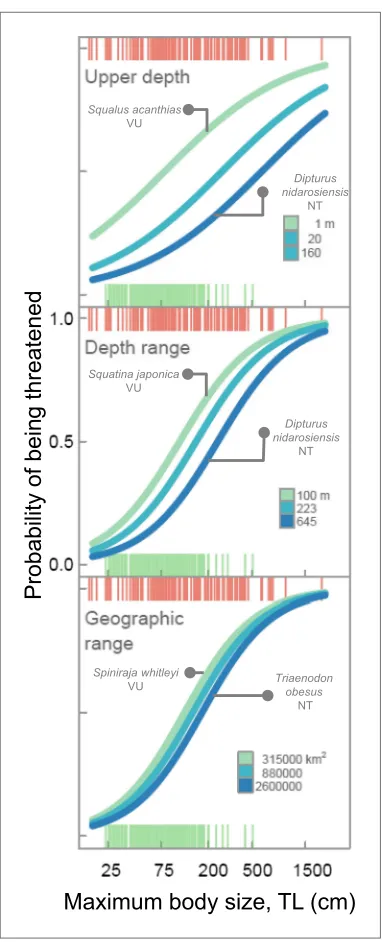
By habitat, one-quarter of coastal and continental shelf chondrichthyans (26.3%, n = 127 of 482) and almost half of neritic and epipelagic species (43.6%, n = 17 of 39) are threatened. Coastal and continental shelf and pelagic species greater than 1 m total length have a more than 50% chance of being threatened, compared to ∼12% risk for a similar-sized deepwater species (Figure 5). While deepwater chondrichthyans, due to their slow growth and lower productivity, are intrinsically more sensitive to overfishing than their shallow-water relatives (García et al., 2008; Simpfendorfer and Kyne, 2009) for a given body size they are less threatened—largely because they are inaccessible to most fisheries (Figure 5).
As a result of their high exposure to coastal shallow-water fisheries and their large body size, sawfishes (Pristidae) are the most threatened chondrichthyan family and arguably the most threatened family of marine fishes (Figure 6). Other highly threatened families include predominantly coastal and continental shelf-dwelling rays (wedgefishes, sleeper rays, stingrays, and guitarfishes), as well as angel sharks and thresher sharks; five of the seven most threatened families are rays. Least threatened families are com-prised of relatively small-bodied species occurring in mesopelagic and deepwater habitats (lanternsharks, catsharks, softnose skates, shortnose chimaeras, and kitefin sharks, Figure 6, Figure 6—source data 1).
Geographic hotspots of threat and conservation priority by habitat
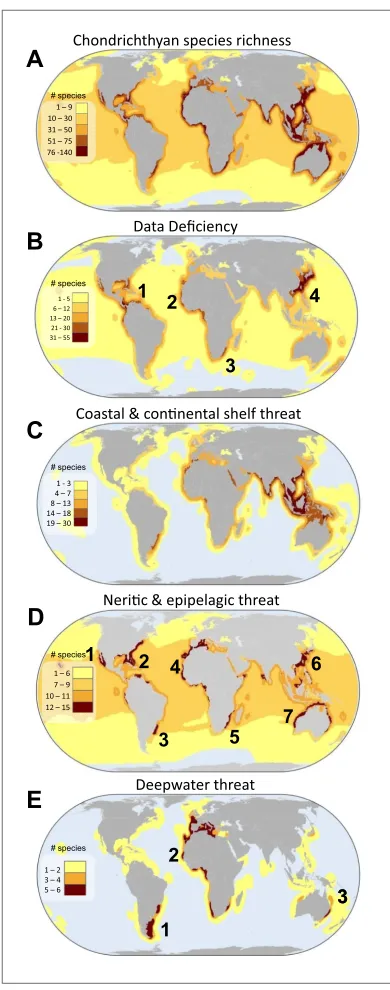
[image:6.612.36.575.71.152.2]Local species richness is greatest in tropical coastal seas, particularly along the Atlantic and Western Pacific shelves (Figure 7A). The greatest uncertainty, where the number of DD species is highest, is centered on four areas: (1) Caribbean Sea and Western Central Atlantic Ocean, (2) Eastern Central Atlantic Ocean, (3) Southwest Indian Ocean, and (4) the China Seas (Figure 7B). The megadiverse China Seas face the triple jeopardy of high threat in shallow waters (Figure 7CD), high species richness (Figure 7A), and a large number of threatened endemic species (Figure 8), combined with high risk due to high uncertainty in status (large number of DD species, Figure 7B). Whereas the distribution of Table 3. Summary of predictive Generalized Linear Models for life history and ecological correlates of IUCN status
Model
Model structure and hypothesis
Degrees of freedom, k
Log
likelihood AICc ΔAIC
AIC weight
Accuracy
(AUC) R2
1 ∼maximum length 2 −227.479 459 43.67 0.000 0.678 0.139
2 ∼ …+ minimum depth 3 −210.299 426.7 11.34 0.003 0.746 0.243
3 ∼ …+…+ depth range 4 −204.703 417.5 2.19 0.25 0.762 0.276
4 ∼ …+…+…+ geographic range 5 −202.578 415.3 0 0.748 0.772 0.298
Species were scored as threatened (CR, EN, VU) = 1 or Least Concern (LC) = 0 for n = 367 marine species. AICc is the Akaike information criterion
corrected for small sample sizes and ΔAIC is the change in AICc. The models are ordered by increasing complexity and decreasing AIC weight (largest
ΔAIC to lowest), coefficient of determination (R2), and prediction accuracy (measured using Area Under the Curve, AUC).
Ecology
Figure 2. IUCN Red List Threat status and the depth distribution of chondrichthyans in the FAO Fishing Areas of the Atlantic, Indian and Pacific Oceans, and Polar Seas. Each vertical line represents the depth range (surface-ward minimum to the maximum reported depth) of each species and is colored according to threat status: CR (red), EN (orange), VU (yellow), NT (pale green), LC (green), and DD (gray). Species are ordered left to right by increasing median depth. The depth limit of the continental shelf is indicated by the horizontal gray line at 200 m. The Polar Seas include the following FAO Fishing Areas: Antarctic–Atlantic (Area 48), Indian (Area 58), Pacific (Area 88), and the Arctic Sea (Area 18). DOI: 10.7554/eLife.00590.007
Ecology
threat in coastal and continental shelf chondrichthyans is similar to the overall threat pattern across tropical and mid-latitudes, the spatial pattern of threat varies considerably for pelagic and deepwater species. Threatened neritic and epipelagic oceanic sharks are distributed throughout the world’s oceans, but there are also at least seven threat hotspots in coastal waters: (1) Gulf of California, (2) southeast US continental shelf, (3) Patagonian Shelf, (4) West Africa and the western Mediterranean Sea, (5) southeast South Africa, (6) Australia, and (7) the China Seas (Figure 7D). Hotspots of deepwater threatened chondrichthyans occur in three areas where fisheries penetrate deepest: (1) Southwest Atlantic Ocean (southeast coast of South America), (2) Eastern Atlantic Ocean, spanning from Norway to Namibia and into the Mediterranean Sea, and (3) southeast Australia (Figure 7E).
Hottest hotspots of threat and priority
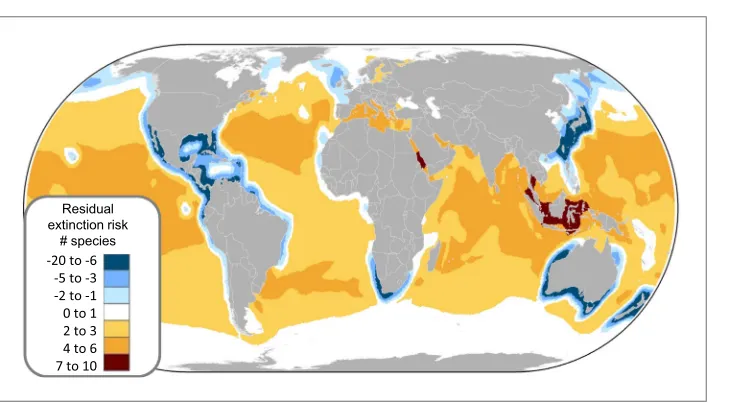
Spatial conservation priority can be assigned using three criteria: (1) the greatest number of threatened species (Figure 7A), (2) greater than expected threat (residuals of the relationship between total number of species and total number of threatened species per cell, Figure 9), and (3) high irreplaceability—high numbers of threatened endemic species (Figure 8). Most threatened marine chondrichthyans (n = 135 of 169) are distributed within, and are often endemic to (n = 73), at least seven distinct threat hotspots (e.g., for neritic and pelagic species Figure 7D). With the notable exception of the US and Australia, threat hotspots occur in the waters of the most intensive shark and ray fishing and fin-trading nations (Figure 1C). Accordingly these regions should be afforded high scientific and conservation priority (Table 5).
The greatest number of threatened species coincides with the greatest richness (Figure 7A vs 7C–E); by controlling for species richness we can reveal the magnitude of threat in the pelagic ocean and two coastal hotspots that have a greater than expected level of threat: the Indo-Pacific Biodiversity Triangle and the Red Sea. Throughout much of the pelagic ocean, threat is greater than expected based on species richness alone, species richness is low (n = 30) and a high percentage (86%) are threatened (n = 16) or Near Threatened (n = 10). Only four are of Least Concern (Salmon shark Lamna ditropis, Goblin shark
Mitsukurina owstoni, Longnose pygmy Shark Heteroscymnoides marleyi, and Largetooth
cookiecutter shark Isistius plutodus) (Figure 9). The Indo-Pacific Biodiversity Triangle, particularly the Gulf of Thailand, and the islands of Sumatra, Java, Borneo, and Sulawesi, is a hotspot of greatest residual threat especially for coastal sharks and rays with 76 threatened species (Figure 9). Indeed, the Gulf of Thailand large marine ecosystem has The following figure supplements are available for figure 2:
Figure supplement 1. Map of Food and Agriculture Organization of the United Nations Fishing Areas and their codes: 18, Arctic Sea; 21, Atlantic, Northwest; 27, Atlantic, Northeast; 31, Atlantic, Western Central; 34, Atlantic, Eastern Central; 37, Mediterranean and Black Sea; 41, Atlantic, Southwest; 47, Atlantic, Southeast; 48, Atlantic, Antarctic; 51, Indian Ocean, Western; 57, Indian Ocean, Eastern; 58, Indian Ocean, Antarctic and Southern; 61, Pacific, Northwest; 67, Pacific, Northeast; 71, Pacific, Western Central; 77, Pacific, Eastern Central; 81, Pacific, Southwest; 87, Pacific, Southeast; and, 88, Pacific, Antarctic.
DOI: 10.7554/eLife.00590.008 Figure 2. Continued
Figure 3. Standardized effect sizes with 95% confidence intervals from the two best explanatory models of life histories, geographic range and extinction risk in chondrichthyans. The data were standardized by subtracting the mean and dividing by one standard deviation to allow for comparison among parameters. The relative importance is calculated as the sum of the Akaike weights of the models containing each variable. Chondrichthyans were scored as threatened (CR, EN, VU) = 1 or Least Concern (LC) = 0 for n = 367 marine species. Threat status was modeled using General Linear Mixed-effects Models, with size, depth and geography treated as fixed effects and taxonomy hierarchy as a random effect to account for phyloge-netic non-independence.
[image:8.612.167.365.367.536.2]Ecology
the highest threat density with 48 threatened chondrichthyans in an area of 0.36 million km2. The Red Sea residual threat hotspot has 29 threat-ened pelagic and coastal species (Figure 9). There are 15 irreplaceable marine hotspots that harbor all 66 threatened endemic species (Figure 8; Supplementary file 2C).
Discussion
In a world of limited funding, conservation priori-ties are often based on immediacy of extinction, the value of biodiversity and conservation oppor-tunity (Marris, 2007). In this study, we provide the first estimates of the threat status and hence risk of extinction of chondrichthyans. Our system-atic global assessment of the status of this lineage that includes many iconic predators reveals a risky combination of high threat (17% observed and 23.9% estimated), low safety (Least Concern, 23% observed and >37% estimated), and high uncer-tainty in their threat status (Data Deficient, 46% observed and 8.7% estimated). Over half of spe-cies are predicted to be threatened or Near Threatened (n = 561, 53.9%, Table 1). While no species has been driven to global extinction— as far as we know—at least 28 populations of sawfishes, skates, and angel sharks are locally or regionally extinct (Dulvy et al., 2003; Dulvy and Forrest, 2010). Several shark species have not been seen for many decades. The Critically Endangered Pondicherry shark (Carcharhinus
hemiodon) is known only from 20 museum
speci-mens that were captured in the heavily-fished inshore waters of Southeast Asia: it has not been seen since 1979 (Cavanagh et al., 2003). The now ironically-named and Critically Endangered Common skate (Dipturus batis) and Common angel shark (Squatina squatina) are regionally extinct from much of their former geographic range in European waters (Cavanagh and Gibson, 2007; Gibson et al., 2008; Iglésias et al., 2010). The Largetooth sawfish (Pristis pristis) and Smalltooth sawfish (Pristis pectinata) are possibly extinct throughout much of the Eastern Atlantic, particu-larly in West Africa (Robillard and Séret, 2006; Harrison and Dulvy, 2014).
[image:9.612.168.359.48.519.2]Our analysis provides an unprecedented un-derstanding of how many chondrichthyan species are actually or likely to be threatened. A very high percentage of species are DD (46%, 487 species); that is one of the highest rates of Data Deficiency of any taxon to date (Hoffmann et al., 2010). This high level of uncertainty in status further elevates risk and presents a key challenge for future assess-ment efforts. We outline a first step through our estimation that 68 DD species are likely to be
Ecology
threatened based on their life histories and distribu-tion. Numerous studies have retrospectively explained extinction risk, but few have made a priori predictions of risk (Dulvy and Reynolds, 2002; Davidson et al., 2012). Across many taxa, extinction risk has been shown to be a function of an extrinsic driver or threat (Jennings et al., 1998; Davies et al., 2006) and the corresponding life history and ecological traits: large body size (low intrinsic rate of population increase, high trophic level), small geographic range size, and ecological spe-cialization. Maximum body size is an essential predictor of threat status, we presume because of the close relationship between body size and the intrinsic rate of population increase in sharks and rays (Smith et al., 1998; Frisk et al., 2001; Hutchings et al., 2012). Though we note that this proximate link may be mediated ultimately through the time-related traits of growth and mortality (Barnett et al., 2013; Juan-Jordá et al., 2013). Our novel contribution is to show that depth-related geographic traits are more important for explaining risk than geographic range per se. The shallowness of species (minimum depth limit) and the narrowness of their depth range are important risk factors (Figure 3). We hypoth-esize that this is so because shallower species are more accessible to fishing gears and those with narrower depth ranges have lower likelihood that a proportion of the species distribution remains beyond fishing activity. For example, the Endangered Barndoor skate (Dipturus laevis) was elimi-nated throughout much of its geographic range and depth distribution due to bycatch in trawl fish-eries, yet may have rebounded because a previously unknown deepwater population component lay beyond the reach of most fisheries (Dulvy, 2000; Kulka et al., 2002; COSEWIC, 2010). We find that geographic range (measured as Extent of Occurrence) is largely unrelated to extinction risk. This is in marked contrast to extinction risk patterns on land (Jones et al., 2003; Cardillo et al., 2005; Anderson et al., 2011a) and in the marine fossil record (Harnik et al., 2012a, 2012b), where small geographic range size is the principal correlate of extinction risk. We suggest that this is because fishing activity is now widespread throughout the world’s oceans (Swartz et al., 2010), and even species with the larg-est ranges are exposed and often entirely encompassed by the footprint of fishing activity. By contrast, with a few exceptions (mainly eastern Atlantic slopes, Figure 7E), fishing has a narrow depth pene-tration and hence species found at greater depths can still find refuge from exploitation (Morato et al., 2006; Lam and Sadovy de Mitcheson, 2010).
The status of chondrichthyans is arguably among the worst reported for any major vertebrate lineage considered thus far, apart from amphibians (Stuart et al., 2004; Hoffmann et al., 2010). The percentage and absolute number of threatened amphibians is high (>30% are threatened), but a greater percentage are Least Concern (38%), and uncertainty of status is lower (32% DD) than for chondrichthyans. Our discovery of the high level of threat in freshwater chondrichthyans (36%) is consistent with the emerging picture of the intense and unmanaged extinction risk faced by many freshwater and estuarine species (Darwall et al., 2011).
Our threat estimate is comparable to other marine biodiversity status assessments, but our findings caution that ‘global’ fisheries assessments may be underestimating risk. The IUCN Global Marine Species Assessment is not yet complete, but reveals varying threat levels among taxa and regions (Polidoro et al., 2008, 2012). The only synoptic summary to-date focused on charismatic Indo-Pacific coral reef ecosystem species. Of the 1,568 IUCN-assessed marine vertebrates and invertebrates, 16% (range: 12–34% among families) were threatened (McClenachan et al., 2012). This is a conservative estimate of marine threat level because although they may be more intrinsically sensitive to extinction drivers, charismatic species are more likely to garner awareness of their status and support for monitoring and conservation (McClenachan et al., 2012). The predicted level of chondrichthyan threat (>24%) is dis-tinctly greater than that provided by global fisheries risk assessments. These studies provide modeled estimates of the percentage of collapsed bony fish (teleost) stocks in both data-poor unassessed fish-eries (18%, Costello et al., 2012) and data-rich fishfish-eries (7–13%, Branch et al., 2011). This could be because teleosts are generally more resilient than elasmobranchs (Hutchings et al., 2012), but in addition we caution that analyses of biased geographic and taxonomic samples may be underesti-mating risk of collapse in global fisheries, particularly for species with less-resilient life histories.
Our work relies on consensus assessments by more than 300 scientists. However, given the uncertainty in some of the underlying data that inform our understanding of threat status, such as distribution traits treated as fixed effects and taxonomy
hierarchy as a random effect to account for phylogenetic non-independence. Each vertical line in each of the ‘rugs’ represents the maximum body size and Red List status of each species: threatened (red) and LC (green). DOI: 10.7554/eLife.00590.010
Ecology
fisheries catch landings data, it is worth consid-ering whether these uncertainties mean our assessments are downplaying the true risk. While there are methods of propagating uncer-tainty through the IUCN Red List Assessments (Akcakaya et al., 2000), in our experience this approach was uninformative for even the best-studied species, because it generated confidence intervals that spanned all IUCN Categories. Instead it is worth considering whether our estimates of threat are consistent with independent quantita-tive estimates of status. The Mediterranean Red List Assessment workshop in 2005 prompted subsequent quantitative analyses of catch landings, research trawl surveys, and sightings data. Quantitative trends could be estimated for five species suggesting they had declined by 96% to >99.9% relative to their former abundance sug-gesting they would meet the highest IUCN Threat category of Critically Endangered (Ferretti et al., 2008). By comparison the earlier IUCN regional assessment for these species, while suggesting they were all threatened, was more conservative for two of the five species: Hammerhead sharks (Sphyrna spp.)—Critically Endangered, Porbeagle shark (Lamna nasus)—Critically Endangered, Shortfin mako (Isurus oxyrinchus)—Critically Endangered, Blue shark (Prionace glauca)— Vulnerable, and Thresher shark (Alopias
vulpinus)—Vulnerable.
We can also make a complementary comparison to a recent analysis of the status of 112 shark and ray fisheries (Costello et al., 2012). The median biomass relative to the biomass at Maximum Sustainable Yield (B/BMSY) of these 112 shark and ray fisheries was 0.37, making them the most overfished groups of any of the world’s unassessed fisheries. Assuming BMSY occurs at 0.3 to 0.5 of unexploited biomass then the median biomass of shark and ray fisheries had declined by between 81% and 89% by 2009. These biomass declines would be sufficient to qualify all of these 112 shark and ray fisheries for the Endangered IUCN category if they occurred within a three-generation time span. By comparison our results are consider-ably more conservative. Empirical analyses show that an IUCN threatened category listing is trig-gered only once teleost fishes (with far higher den-sity-dependent compensation) have been fished down to below BMSY (Dulvy et al., 2005; Porszt et al., 2012). Hence, our findings are consistent with only around one-quarter of chondrichthyan species having been fished down below the BMSY target reference point. While there may be con-cern that expert assessments may overstate declines and threat, it is more likely that our
[image:11.612.168.361.49.590.2]Ecology
servative consensus-based approach has under-stated declines and risk in sharks and rays.
For marine species, predicting absolute risk of extinction remains highly uncertain because, even with adequate evidence of severe decline, in many instances the absolute population size remains large (Mace, 2004). There remains considerable un-certainty as to the relationship between census and effective population size (Reynolds et al., 2005). Therefore, Red List categorization of chondrichthyans should be interpreted as a comparative measure of relative extinction risk, in recognition that unmanaged steep declines, even of large populations, may ultimately lead to ecosystem perturbations and eventually biological extinction. The Red List serves to raise red flags calling for conservation action, sooner rather than later, while there is a still chance of recovery and of forestalling permanent biodiversity loss.
Despite more than two decades of rising awareness of chondrichthyan population declines and collapses, there is still no global mechanism to ensure financing, implementation and enforcement of chondrichthyan fishery management plans that is likely to rebuild populations to levels where they would no longer be threatened (Lack and Sant, 2009; Techera and Klein, 2011). This management shortfall is particularly problematic given the large geographic range of many species. Threat increased only slightly when geographic range is measured as the Extent of Occurrence; however, geographic range becomes increasingly important when it is measured as the number of countries (legal jurisdic-tions) spanned by each species. The proportion of species that are threatened increases markedly with geographic size measured by number of Exclusive Economic Zones (EEZs) spanned; one-quarter of threatened species span the EEZs of 18 or more countries (Figure 10). Hence, their large geographic ranges do not confer safety, but instead exacerbates risk because sharks and rays require coherent, effective international management.
With a few exceptions (e.g., Australia and USA), many governments still lack the resources, expertise, and political will necessary to effectively conserve the vast majority of shark and rays, and indeed many body size and Red List status of each species:
threat-ened (upper rugs) and Least Concern (lower rugs). The lines are best fit using Generalized Linear Mixed-effects
Models with 95% confidence intervals (Table 9).
[image:12.612.39.570.389.605.2]DOI: 10.7554/eLife.00590.011 Figure 5. Continued
Figure 6. Evolutionary uniqueness and taxonomic conservation priorities. Threat among marine chondrichthyan families varies with life history sensitivity (maximum length) and exposure to fisheries (depth distribution). (A) Proportion of threatened data sufficient species and the richness of each taxonomic family. Colored bands indicate the significance levels of a one-tailed binomial test at p=0.05, 0.01, and 0.001. Those families with significantly greater (or lower) than expected threat levels at p<0.05 against a null expectation that extinction risk is equal across families (35.6%). (B) The most and least threatened taxonomic families. (C) Average life history sensitivity and accessibility to fisheries of 56 chondrichthyan families. Significantly greater (or lower) risk than expected is shown in red (green).
DOI: 10.7554/eLife.00590.012
The following source data are available for figure 6:
Ecology
other exploited organisms (Veitch et al., 2012). More than 50 sharks are included in Annex I (Highly Migratory Species) of the 1982 Law of the Sea Convention, implemented on the high seas under the 1992 Fish Stocks Agreement, but currently only a handful enjoy species-specific protections under the world’s Regional Fishery Management Organizations (Table 6), and many of these have yet to be implemented domestically. The Migratory Sharks Memorandum of Understanding (MoU) adopted by the Parties to the Convention on Migratory Species (CMS) so far only covers seven sharks, yet there may be more than 150 chondrichthyans that regularly migrate across national boundaries (Fowler, 2012). To date, only one of the United Nations Environment Programme’s Regional Seas Conventions, the Barcelona Convention for the Conservation of the Mediterranean Sea, includes chondrichthyan fishes and only a few of its Parties have taken concrete domestic action to implement these listings. Despite two decades of effort, only ten sharks and rays had been listed by the Convention on International Trade in Endangered Species (CITES) up to 2013 (Vincent et al., 2014). A further seven species of shark and ray were listed by CITES in 2013—the next challenge is to ensure effective imple-mentation of these trade regulations (Mundy-Taylor and Crook, 2013). OSPAR (the Convention for the Protection of the marine Environment of the North-East Atlantic) lists many threatened shark and ray species, but its remit excludes fisheries issues. Many chondrichthyans qualify for listing under CITES, CMS, and various regional seas conventions, and should be formally considered for such action as a complement to action by Regional Fisheries Management Organizations (RFMOs) (Table 6).
Bans on ‘finning’ (slicing off a shark’s fins and discarding the body at sea) are the most widespread shark conservation measures. While these prohibitions, particularly those that require fins to remain attached through landing, can enhance monitoring and compliance, they have not significantly reduced shark mortality or risk to threatened species (Clarke et al., 2013). Steep declines and the high threat levels in migratory oceanic pelagic sharks suggest raising the priority of improved management of catch and trade through concerted actions by national governments working through RFMOs
as well as CITES, and CMS (Table 7).
A high proportion of catch landings come from nations with a large number of threatened chon-drichthyans and less-than-comprehensive chondrichthyan fishery management plans. Future research is required to down-scale these global Red List assessments and analyses to provide country-by-country diagnoses of the link between specific fisheries and specific threats to populations of more broadly distributed species (Wallace et al., 2010). Such information could be used to focus fisheries management and conservation interventions that are tailored to specific problems. There is no systematic global monitoring of shark and ray populations and the national fisheries catch landings statistics provide invaluable data for tracking fisheries trends in unmanaged fisheries (Newton et al., 2007; Worm et al., 2013). However, the surveillance power of such data could be greatly improved if collected at greater taxonomic resolution. While there have been continual improvements, catches are under-reported (Clarke et al., 2006), and for those that are under-reported only around one-third is under-reported at the Table 4. Summary of explanatory Generalized Linear Mixed-effect Models of the life history and geographic distributional correlates of IUCN status
Model structure and hypothesis
Degrees of freedom, k
Log
likelihood AICc ΔAIC
AIC weight
R2GLMM(m)
of fixed effects only
R2GLMM(c)
of fixed and random effects
∼ maximum length 5 −197.06 404.3 28.31 0.000 0.32 0.58
∼ …+ minimum
depth 6 −187.013 386.3 10.29 0.005 0.48 0.65
∼ …+…+ depth
range 7 −182.139 378.6 2.62 0.212 0.49 0.66
∼ …+…+…+
geographic range 8 −179.785 376.0 0 0.784 0.69 0.80
Species were scored as threatened (CR, EN, VU) = 1 or Least Concern (LC) = 0 for n = 367 marine species. AICc is
the Akaike information criterion corrected for small sample sizes; ΔAIC is the change in AICc. The models are
ordered by increasing complexity and decreasing AIC weight (largest ΔAIC to lowest). R2GLMM(m) is the marginal
R2 of the fixed effects only and R2GLMM(c) is the conditional R2 of the fixed and random effects.
Ecology
species level (Fischer et al., 2012). To comple-ment improved catch landings data, we recom-mend the development of repeat regional assessments of the Red List Status of chondrich-thyans to provide an early warning of adverse changes in status and to detect and monitor the success of management initiatives and inter-ventions. Aggregate Red List Threat indices for chondrichthyans, like those available for mammals, birds, amphibians, and hard corals (Carpenter et al., 2008) would provide one of the few global scale indicators of progress toward international biodiversity goals (Walpole et al., 2009; Butchart et al., 2010).
Our global status assessment of sharks and rays reveals the principal causes and severity of global marine biodiversity loss, and the threat level they face exposes a serious shortfall in the conservation management of commercially-exploited aquatic species (McClenachan et al., 2012). Chondrichthyans have slipped through the jurisdictional cracks of traditional national and international management authorities. Rather than accept that many chondrichthyans will inevi-tably be driven to economic, ecological, or bio-logical extinction, we warn that dramatic changes in the enforcement and implementation of the conservation and management of threatened chondrichthyans are urgently needed to ensure a healthy future for these iconic fishes and the ecosystems they support.
Methods
IUCN Red List Assessment process
and data collection
We applied the Red List Categories and Criteria developed by the International Union for Conservation of Nature (IUCN) (IUCN, 2004) to 1,041 species at 17 workshops involving more than 300 experts who incorporated all available information on distribution, catch, abundance, population trends, habitat use, life histories, threats, and conservation measures.
[image:14.612.167.362.49.544.2]Some 105 chondrichthyan fish species had been assessed and published in the 2000 Red List of Threatened Species prior to the initiation of the Global Shark Red List Assessment (GSRLA). These assessments were undertaken by correspondence and through discussions at four workshops (1996—London, UK, and Brisbane, Australia; 1997—Noumea, New Caledonia, and 1999— Pennsylvania, USA). These assessments applied earlier versions of the IUCN Red List Criteria and, where possible, were subsequently reviewed and updated according to version 3.1 Categories and Criteria during the GSRLA. The IUCN Shark Specialist Group (SSG) subsequently held a series of 13 regional and thematic Red List workshops in nine countries around the world (Table 8). Prior to the workshops, each
Figure 7. Global patterns of marine chondrichthyan diversity, threat and knowledge. (A) Total chondrichthyan richness, (B) the number of Data Deficient and threat by major habitat: (C) coastal and continental shelf (<200 m depth), (D) neritic and epipelagic (<200 m depth), and (E) deepwater slope and abyssal plain (>200 m) habitats. Numbers expressed as the total
number of species in each 23,322 km2 cell. The
Ecology
[image:15.612.168.524.52.253.2]participant was asked to select species for assessment based on their expertise and research areas. Where possible, experts carried out research and preparatory work in advance, thus enabling more syn-thesis to be achieved during each workshop. SSG Red List-trained personnel facilitated discussion and consensus sessions, and coordinated the production of global Red List Assessments for species in each region. For species that had previously been assessed, participants provided updated information and assisted in revised assessments. Experts completed assessments for some wide-ranging, globally distrib-uted species over the course of several workshops. In total, 302 national, regional, and international experts from 64 countries participated in the GSRLA workshops and the production of assessments. All Red List Assessments were based on the collective knowledge and pooled data from dedicated experts
Figure 9. Spatial variation in the relative extinction risk of marine chondrichthyans. Residuals of the relationship between total number of data sufficient chondrichthyans and total number of threatened species per cell, where positive values (orange to red) represent cells with higher threat than expected for their richness alone.
[image:15.612.169.535.470.674.2]DOI: 10.7554/eLife.00590.017
Figure 8. Irreplaceability hotspots of the endemic threatened marine chondrichthyans. Endemics were defined as
species with an Extent of Occurrence of <500,000 km2 (n = 66). Irreplaceable cells with the greatest number of
small range species are shown in red, with blue cells showing areas of lower, but still significant irreplaceability. Irreplaceability is the sum of the inverse of the geographic range sizes of all threatened endemic species in the cell. A value of 0.1 means that on average a single cell represents one tenth of the global range of all the species present in the cell. The numbers are hotspots referred to in the text.
Ecology
Table 5.
Scientific and conservation priority accor
ding to thr
eat, knowledge and endemicity by F
AO Fishing Ar
ea
FAO Fishing Ar
ea
(ranked priority)
Thr
eatened
species (% of total, n = 181) Data Deficient species (% of total, n = 487) Number of endemic species (thr
eatened
endemics)
Thr
eatened endemic species
(1) Indian, Eastern
67 (37.0) 69 (14.2) 58 (5) A te lo m yc te ru s b al ie ns is , H im an tu ra fl uv ia ti lis , Z ea ra ja m au g ea na , T ry g o no rr hi na m el al eu ca , U ro lo p hu s o ra ri us
(2) Pacific, W
estern Central
76 (42.0)
81 (16.6)
51 (14)
Glyphis glyphis, Aulohalaelurus kanakorum, Hemitriakis leucoperiptera, Brachaelurus colcloughi, Hemiscyllium hallstromi, H. strahani, Himantura hortlei, H. lobistoma, Pastinachus solocirostris, Aptychotrema timorensis, Rhinobatos jimbaranensis, Rhynchobatus
sp. nov
. A
,
Rhynchobatus springeri, Urolophus javanicus
(3) Pacific, Northwest
48 (26.5)
116 (23.8)
80 (6)
Benthobatis yangi, Narke japonica, Raja pulchra, Squatina formosa, S. japonica, S. nebulosa
(4) Indian, W
estern 61 (33.7) 104 (21.4) 62 (8) C ar ch ar hi nu s le io d on , H ap lo b le p ha ru s ki st na sa m yi , H . f av us , H . p un ct at us , P se ud og in g ly m os to m a
brevicaudatum, Electrolux addisoni, Dipturus crosnieri, Okamejei pita
(5) Atlantic, W
estern Central
32 (17.7)
81 (16.6)
62 (4)
Diplobatis colombiensis, D. guamachensis, D. ommata, D. pictus
(6) Pacific, Southwest
34 (18.8)
49 (10.1)
28
(7) Atlantic, Southwest
52 (28.7)
52 (10.7)
37 (19)
Galeus mincaronei, Schroederichthys saurisqualus, Mustelus fasciatus, M. schmitti, Atlantoraja castelnaui, A. cyclophora, A. platana, Rioraja agassizii, Sympterygia acuta, Benthobatis kreffti, Dipturus
mennii, Gurgesiella dorsalifera, Rhinobatos horkelii, Zapteryx brevirostris, Rhinoptera
brasiliensis, Squatina argentina, S. guggenheim, S. occulta, S. punctata
(8) Atlantic, Southeast
37 (20.4)
51 (10.5)
13
(9) Atlantic, Eastern Central
42 (23.2)
44 (9.0)
6
(10) Pacific, Southeast
26 (14.4)
67 (13.8)
32 (3)
Mustelus whitneyi, Triakis acutipinna, T. maculata
(11) Pacific, Eastern Central
20 (11.0)
52 (10.7)
19 (2)
Urotrygon reticulata, U. simulatrix
(12) Atlantic, Northeast
33 (18.2)
23 (4.7)
8
(13) Atlantic, Northwest
22 (12.2)
17 (3.5)
3 (1)
Malacoraja senta
(14) Mediterranean & Black Sea
34 (18.8)
16 (3.3)
3 (1)
Leucoraja melitensis
(15) Pacific, Northeast
9 (5.0)
11 (2.3)
0
(16) Indian, Antar
ctic
1 (0.6)
4 (0.8)
2
(17) Atlantic, Antar
ctic
1 (0.6)
4 (0.8)
2
(18) Pacific, Antar
ctic 0 3 (0.6) 0 (19) Ar ctic Sea 0 0 0 Endemics wer
e defined as those species found only within a single F
AO Fishing Ar
ea. F
AO Fishing Ar
eas wer
e ranked accor
ding to gr
eatest species richness, per
cent thr
eatened species, per
cent Data
Deficient species, number of endemic species and number of thr
eatened endemic species.
Ecology
Figure 10. Elevated threat in chondrichthyans with the largest geographic ranges, spanning the greatest number of national jurisdictions. Frequency distribution of number of jurisdictions spanned by all chondrichthyans (black, n = 1,041) and threatened species only (red, n = 174), for (A) country EEZs, and (B) the overrepresentation of threatened species spanning a large number of country EEZs, shown by the log ratio of proportion of threatened species over the proportion of all species. The proportion of threatened species is greater than the proportion of all species where the log ratio = 0, which corre-sponds to range spans of 16 and more countries. DOI: 10.7554/eLife.00590.019
across the world, ensuring global consultation and consensus to achieve the best assessment for each species with the knowledge and resources available (‘Acknowledgements’). Any species assessments not completed during the workshops were finalized through subsequent correspondence among experts.
The SSG evaluated the status of all described chondrichthyan species that are considered to be taxonomically valid up to August 2011 (see “Systematics, missing species and species cov-erage” below). Experts compiled peer-reviewed Red List documentation for each species, including data on: systematics, population trends, geo-graphic range, habitat preferences, ecology, life history, threats, and conservation measures. The SSG assessed all species using the IUCN Red List Categories and Criteria version 3.1 (IUCN, 2001). The categories and their standard abbreviations are: Critically Endangered (CR), Endangered (EN), Vulnerable (VU), Near Threatened (NT), Least Concern (LC), and Data Deficient (DD). Experts further coded each species according to the IUCN Habitats, Threats and Conservation Actions Authority Files, enabling analysis of their habitat preferences, major threats and conservation action requirements. SSG Program staff entered all data into the main data fields in the IUCN Species Information Service Data Entry Module (SIS DEM) and subsequently transferred these data into the IUCN Species Information Service (SIS) in 2009.
Systematics, missing species and
species coverage
The SSG collated data on order, family, genus, species, taxonomic authority, commonly-used synonyms, English common names, other common names, and taxonomic notes (where relevant). For taxonomic consistency throughout the spe-cies assessments, the SSG followed Leonard J V Compagno’s 2005 Global Checklist of Living Chondrichthyan Fishes (Compagno, 2005), only deviating from this where there was extensive opposing consensus with a clear and justifiable alternative, as adjudicated by the IUCN SSG’s Vice Chairs of Taxonomy, David E Ebert and William T White.
Ecology
nine occurring in the Indo–West Pacific. Additional nominal species of chondrichthyans are also included following resurrection of previously unrecognized species such as the resurrection of
Pastinachus atrus for the Indo–Australian region, previously considered a synonym of P. sephen (Last and Stevens, 1994). Scientists excluded some nominal species of dubious taxonomic validity from this assessment. Thus, the total number of chondrichthyan species referred to in this paper (1,041) does not include all recent new or resurrected species, which require future work for their inclusion in the GSRLA.
Many more as yet undescribed chondrichthyan species exist. The chondrichthyan faunas in several parts of the world (e.g., the northern Indian Ocean) are poorly known and a large number of species are likely to represent complexes of several distinct species that require taxonomic resolution, for example some dogfishes, skates, eagle rays, and stingrays (Iglésias et al., 2010; White and Last, 2012). Many areas of the Indian and Pacific Oceans are largely unexplored and, given the level of micro-endemism documented for a number of chondrichthyan groups, it is likely that many more species will be discovered in the future (Last, 2007; Naylor et al., 2012). For example, recent surveys of Indonesian fish markets revealed more than 20 new species of sharks out of the approximately 130 recorded in total (White et al., 2006; Last, 2007; Ward et al., 2008).
Distribution maps
SSG experts created a shapefile of the geographic distribution for each chondrichthyan species with GIS software using the standard mapping protocol for marine species devised by the IUCN GMSA team (http://sci.odu.edu/gmsa/). The map shows the Extent of Occurrence of the species cut to one of several standardized basemaps depending on the ecology of the species (i.e., coastal and continental shelf, pelagic and deepwater). The distribution maps for sharks are based on orig-inal maps provided by the FAO and Leonard JV Compagno. Maps for some of the batoids were originally provided by John McEachran. New maps for recently described species were drafted where necessary. The original maps were updated, corrected, or verified by experts at the Red List workshops or out-of-session assessors and SSG staff and then sent to the GMSA team who mod-ified the shapefiles and matched them to the dis-tributional text within the assessment.
Occurrence and habitat preference
SSG assessors assigned countries of occurrence from the ‘geographic range’ section of the Red List documentation and classified species to the FAO Fishing Areas (http://www.iucnredlist.org/ technical-documents/data-organization) in which they occur (Figure 2—figure supplement 1). Each species was coded according to the IUCN Habitats Authority File (http://www.iucnredlist. org/technical-documents/classification-schemes/ habitats-classification-scheme-ver3). These cate-gorizations are poorly developed and often irrel-evant for coastal and offshore marine animals. For the purposes of analysis presented here we assigned chondrichthyans to five unique habi-tat-lifestyle combinations (coastal and continental shelf, pelagic, meso- and bathypelagic, deepwater, Table 6. Progress toward regional and
international RFMO management measures for sharks and rays
1. Bans on ‘finning’ (the removal of a shark’s fins and discarding the carcass at sea) through most RFMOs
(Fowler and Séret, 2010);
2. North East Atlantic Fisheries Commission (NEAFC) bans on directed fishing for species not actually targeted within the relevant area (Spiny dogfish [Squalus acanthias], Basking shark [Cetorhinus
maximus], Porbeagle shark [Lamna nasus]) (NEAFC,
2009);
3. Convention on the Conservation of Antarctic Marine Living Resources bans on ‘directed’ fishing for skates
and sharks and bycatch limits for skates (CCMLR,
2011);
4. A Northwest Atlantic Fisheries Organization (NAFO) skate quota (note: this has consistently been set higher than the level advised by scientists since its
establishment in 2004) (NAFO, 2011);
5. International Commission for the Conservation of Atlantic Tunas (ICCAT) bans on retention,
transshipment, storage, landing, and sale of Bigeye Thresher (Alopias superciliosus), and Oceanic whitetip shark (Carcharhinus longimanus), and partial bans (developing countries excepted under certain circumstances) on retention, transshipment, storage, landing, and sale of most hammerheads (Sphyrna spp.), and retention, transshipment, storage, and landing (but
not sale) of Silky shark (Carcharhinus falciformis) (Kyne
et al., 2012);
6. An Inter-American Tropical Tuna Commission (IATTC) ban on retention, transshipment, storage, landing, and
sale of Oceanic whitetip sharks (IATTC, 2011);
7. An Indian Ocean Tuna Commission (IOTC) ban on retention, transshipment, storage, landing, and sale of thresher sharks-with exceptionally low compliance and
reportedly low effectiveness (IOTC, 2011); and,
8. A Western and Central Pacific Fisheries Commission ban on retention, transshipment, storage, and landing
(but not sale) of Oceanic whitetip sharks (Clarke et al.,
2013).
Ecology
and freshwater) mainly according to depth distri-bution and, to a lesser degree, position in the water column. The pelagic group includes both neritic (pelagic on the continental shelf) and epi-pelagic oceanic (epi-pelagic in the upper 200 m of water over open ocean) species. Species habitats were classified based on the findings from the workshops combined with a review of the pri-mary literature, FAO fisheries guides and field guides (Cavanagh et al., 2003; Cavanagh and Gibson, 2007; Cavanagh et al., 2008; Gibson et al., 2008; Camhi et al., 2009; Kyne et al., 2012). Species habitat classifications tended to be similar across families, but for some species the depth distributions often spanned more than one depth category and for these species habitat was assigned according to the predominant loca-tion of each species throughout the majority of its life cycle (Compagno, 1990). This issue was mainly confined to coastal and continental shelf species that exhibited distributions extending down the continental slopes (e.g., some Dasyatis, Mustelus,
Rhinobatos, Scyliorhinus, Squalus, and Squatina).
We caution that some of the heterogeneity in depth distribution or unusually large distributions may reflect taxonomic uncertainty and the exist-ence of species complexes (White and Last, 2012). We defined the deep sea as beyond the continental and insular shelf edge at depths greater than or equal to 200 m. Coastal and continental shelf includes predominantly demersal species (those spending most time dwelling on or near the seabed), and excluded neritic chondrichthy-ans. Pelagic species included macrooceanic and tachypelagic ocean-crossing epipelagic sharks with circumglobal distributions as well as sharks suspected of ocean-crossing because they exhibit circumglobal but disjunct distributions, for example Galapagos shark (Carcharhinus galapagensis).
Our classification resulted in a total of 33 obli-gate freshwater and 1,008 marine and euryhaline chondrichthyans of which 482 species were found predominantly in coastal and continental shelf, 39 in pelagic, 479 in deepwater, and eight in meso- and bathypelagic habitats. To evaluate whether the geographic patterns of threat are robust to alternate unique or multiple habitat classifications we considered two alternate classification schemes, one where species were classified into a single habitat and another where species were classified in one or more habitats. The alternate unique classification scheme yielded 42 pelagic (Camhi et al., 2009), and 452 deepwater chondrichthyans (Kyne and Simpfendorfer, 2007), leaving 517 coastal and continental shelf and 33 obligate freshwater species (totaling 1,044, based on an Table 7. Management recommendations: the
following actions would contribute to rebuilding threatened chondrichthyan populations and properly managing associated fisheries
Fishing nations and regional fisheries management organizations (RFMOs) are urged to:
1. Implement, as a matter of priority, scientific advice for protecting habitat and/or preventing overfishing of chondrichthyan populations;
2. Draft and implement Plans of Action pursuant to the International Plan Of Action (IPOA–Sharks), which include, wherever possible, binding, science-based management measures for chondrichthyans and their essential habitats;
3. Significantly increase observer coverage, monitoring, and enforcement in fisheries taking chondrichthyans;
4. Require the collection and accessibility of
species-specific chondrichthyan fisheries data, including discards, and penalize non-compliance;
5. Conduct population assessments for chondrichthyans;
6. Implement and enforce chondrichthyan fishing limits in accordance with scientific advice; when sustainable catch levels are uncertain, set limits based on the precautionary approach;
7. Strictly protect chondrichthyans deemed exceptionally vulnerable through Ecological Risk Assessments and those classified by IUCN as Critically Endangered or Endangered;
8. Prohibit the removal of shark fins while onboard fishing vessels and thereby require the landing of sharks with fins naturally attached; and,
9. Promote research on gear modifications, fishing methods, and habitat identification aimed at mitigating chondrichthyan bycatch and discard mortality.
National governments are urged to:
10. Propose and work to secure RFMO management measures based on scientific advice and the
precautionary approach;
11. Promptly and accurately report species-specific chondrichthyan landings to relevant national and international authorities;
12. Take unilateral action to implement domestic management for fisheries taking chondrichthyans, including precautionary limits and/or protective status where necessary, particularly for species classified by IUCN as Vulnerable, Endangered or Critically Endangered, and encourage similar actions by other Range States;
13. Adopt bilateral fishery management agreements for shared chondrichthyan populations;
14. Ensure active membership in Convention on International Trade in Endangered Species (CITES), Convention for the Conservation of Migratory Species (CMS), RFMOs, and other relevant regional and international agreements;
15. Fully implement and enforce CITES
chondrichthyan listings based on solid non-detriment findings, if trade in listed species is allowed;
Ecology
older taxonomic scheme). When species were classified in more than one habitat this resulted in 513 species in the coastal and continental shelf, 564 in deepwater, 54 in pelagic, and 13 meso- and bathypelagic habitats. We found the geo-graphic pattern of threat was robust to the choice of habitat classification scheme, and we present only the unique classification (482 coastal and continental shelf, 39 pelagic, 479 deepwater hab-itat species).
Major threats
SSG assessors coded each species according to the IUCN Major threat Authority File (http://www. iucnredlist.org/technical-documents/classification-schemes/habitats-classification-scheme-ver3). We coded threats that appear to have an important impact, but did not describe their relative impor-tance for each species.
The term ‘bycatch’ and its usage in the IUCN Major threat Authority File do not capture the complexity and values of chondrichthyan fisheries. Some chondrichthyans termed ‘bycatch’ are actually caught as ‘incidental or secondary catch’ as they are used to a similar extent as the target species or are sometimes highly valued or at least welcome when the target species is absent. ‘Unwanted bycatch’ refers to cases where the chondrichthyans are not used and fishers would prefer to avoid catching them (Clarke, S personal communication, Sasama Consulting, Shizuoka, Japan). If the levels of unwanted bycatch are severe enough, chondrichthyans can be actively persecuted to avoid negative and costly gear interactions—such as caused the near extirpation of the British Columbian population of Basking shark (Cetorh