Predator guild interactions in northern Australia: behaviour and ecology of an apex predator, the dingo Canis lupus dingo, and an introduced mesopredator, the feral cat Felis catus
297
0
0
Full text
(2) Predator guild interactions in northern Australia: behaviour and ecology of an apex predator, the dingo Canis lupus dingo, and an introduced mesopredator, the feral cat Felis catus. Thesis submitted by Leila Amy Brook BSc (Hons) University of Melbourne December 2013. for the degree of Doctor of Philosophy in the School of Marine and Tropical Biology James Cook University. i.
(3) ii.
(4) Top : Dingo Cani s lupu s dingo on Marion Do wns Sanctu ary in the Kimb erley, Western Australia Botto m: Feral cat Fel is catu s on Ho lroyd River Stat ion , Cap e Yo rk Pen insula, Queens land. iii.
(5) iv.
(6) Acknowledgments I am very grateful to have worked on such a ripper of a project during my PhD. I feel lucky to have been able to pursue an interesting field of research in a way which is allabsorbing, and to still find it fascinating at the end. Studying large, free-ranging predators in remote areas across northern Australia was a challenge but an enjoying one, from the thrill of getting hands-on during trapping, to learning to set realistic fieldwork expectations! The only downside of working in such magnificent examples of tropical savanna is that other places now pale in comparison. I have a lot of appreciation for all the fantastic people who facilitated this project and contributed support along the way. I must first thank my supervisors Chris Johnson, Euan Ritchie and Lin Schwarzkopf. I am grateful to have worked with such a knowledgeable and diverse team during my PhD. Chris, thanks for taking me on for this project. Your rich insights into the role of the dingo, your inspired scientific thinking and thoughtful comments supported me throughout my candidature. Euan, thanks for your constant positive attitude and knowledge not only of dingoes, predator ecology and field research but of all things savanna. You have passed on a love for the north and a quite serious birdwatching obsession. Thank you Lin for your support in the later years of my project, for the reassuring discussions, practical advice and guidance on chapters and analysis. I would also like to thank Jenny Martin, who with Euan, introduced me to many of the great things about Townsville and provided encouragement before and during my candidature. Every chapter of this thesis involves research conducted on properties owned by the Australian Wildlife Conservancy, who not only permitted me to work on their sanctuaries, but provided much in-kind support, knowledge, time and hospitality during my fieldwork. Thanks to Sarah Legge (Mornington), John Kanowski, Jill MacNicol (Piccaninny Plains), Peter and Pam Hensler (Mt Zero-Taravale), Mick Blackman (Brooklyn) and all the staff and volunteers that assisted with my project in the Kimberley. I am very grateful to the property owners or managers who allowed me to run surveys on their properties: Darcy and Raylee Byrnes of Holroyd River station, James and Elaine Spreadborough of Spoonbill station, Evan, Kim and Phil Acton of Millungera station and Brian Furber of Hidden Valley. I thank the Department of Defence for permission to work on defence land, and I particularly appreciate the help of Allan McManus who facilitated approvals for my research on both the Townsville and Mount Stuart Field Training Areas. A special thanks to the lovely Laura Mitchell, who worked as a research assistant on the dingo project in my first year. In addition to sharing the joys of learning about camera trapping and dingo lures, you taught me many valuable field skills and made the early field trips a barrel of laughs. Hugh McGregor helped immensely, taking time to introduce me to the details of feral cat trapping and GPS telemetry, sharing his cat wisdom, spending long nights processing dingoes and kindly sharing some of his hard-earned data.. v.
(7) Damian Morrant has been a great go-to guy for all things dingo. Thanks for the many enthusiastic discussions on all aspects of dingo research, for teaching me the tricks of trapping and especially for volunteering your time and efforts on one of the most challenging field trips ever! A huge thanks to Angus McNab for your untiring help on the trapping field trip. I never would have seen so many fantastic birds and reptiles, or been willing to go spotlighting in our few non-working hours if you hadn't been there! I'm very grateful to Devi Hermsen, who spent several months helping on the dingo project and worked on several field trips. Your enthusiasm and great work made the trips much easier and lots of fun. I couldn't have achieved all the remote camera field work without the help of many great volunteers, in particular a big thanks to Kate Stookey, Susan Campbell, Paul Mitrovski, Frank Bird, Mika Trombini, Teigan Allan, Emily Hynes, Katrin Schmidt, Delphi Ward, Karen Glynn, Jen Leech and Gus McNab for coming on the long camera survey trips. I apologise especially to those who had to sweat it out in the hazmat suits or be exposed to particularly vile dingo attractants! I am grateful to Julie Fedorniak, Sue Reilly, Ross Barrett, Rob Gegg and Janice Cran at JCU for helping me prepare for field trips with a huge amount of gear, vehicles and OHS logistics. Felicity Smout, Sarah Gill, Maria Bellei and the Aachilpa Vet Clinic provided veterinary advice and training which I greatly appreciate. Thanks to the Centre for Tropical Biodiversity and Climate Change (CTBCC), in particular Yvette Williams, for welcoming me to ATSIP when the Mammal lab dwindled to one, and for inviting me to lab retreats and meetings. I am also grateful to the JCU Herpetology lab for support and feedback during my time in Townsville, and to the members of the Deakin University Burwood ecology lab, which became my new uni base when I moved to Melbourne. I asked a lot of analysis questions during my candidature and am very grateful for the support and guidance I received. Thanks to Dale Nimmo, Shane Blowes, Justin Perry, Brett Abbott, Jeremy VanDerWal, Ross Alford, James Moloney, Sally Keith, Sean Connolly, Ben Phillips, Matt Symonds and Barbara Anderson. I'm also very grateful to Kerrie Mengersen, Jessie Wells and Tom Prowse for taking the time to help me with analyses that didn't make the final cut. I thank Simon Benhamou, Roger Powell, Hawthorne Beyer, Clément Calenge , Kamil Bartoń, Bram van Moorter and Eric Vander Wal for patient, informative responses to questions asked over email regarding R scripts and analysis techniques. I received helpful advice on dingoes and feral cats when I was first designing my research from Lee Allen, Brad Purcell, Malcolm Kennedy, Alex Diment, Mark Goullet, Dave Algar, Damian Byrne, Mike Johnston, Russell Palmer and James Speed. Thanks to Alex Kutt, who provided the opportunity to analyse and publish dingo dietary analysis, which provided a primer for my own diet studies. I really appreciate the many discussions and support from fellow students, particularly Brooke Bateman, April Reside, Shane Blowes, Takahiro Shimada, Shannon Troy (UTAS), Stewart MacDonald, Tammy Inkster, Collin Storlie, John Llewellyn, Mat Vickers, Anita. vi.
(8) Heim and Rickard Abom. Thanks to the friends and housemates, especially Véronique Mocellin, who made Townsville home and a great place to live. I am extremely grateful to my parents Geoff and Theresa Brook, who instilled in me a love and respect for nature and animals in particular. You have always provided unconditional support and encouragement to pursue the things in life that I love and believe worthwhile. A huge thank you to my wonderful friend Morag Stewart, who provided so much wisdom, laughter and support in long-distance phone calls throughout my candidature. Sharing the PhD journey with you has been an emotional life-saver! The greatest thanks go to Sam Loy, who moved to Townsville, gave me love and support in many ways through the ups and downs, and inadvertently learnt a great deal about dingoes, cats and the challenges of fieldwork and analysis. Thank you for tolerating my science nerdiness and keeping me 'sane'. I couldn't have done it without you.. vii.
(9) viii.
(10) Statement on contributions of others. Research Funding Australian Research Council Discovery grant DP0877398: New thinking on the relationship of dingo ecology to biodiversity conservation and sustainable cattle production Australian Research Council Linkage grant LP100100033: Mammal declines in northern Australia: science for conservation and recovery James Cook University (JCU). In-kind support Australian Wildlife Conservancy (AWC) School of Life and Environmental Sciences, Deakin University. Stipend Australian Postgraduate Award JCU Graduate Research Scheme PhD write-up grant. Supervision (and editorial assistance) Professor Christopher N Johnson, University of Tasmania (UTAS) Dr Euan G Ritchie, Deakin University Professor Lin Schwarzkopf, JCU. Statistical and analytical support Dr Jeremy VanDerWal, JCU Dr Brooke Bateman, University of Wisconsin - Madison Dr Dale Nimmo, Deakin University Shane Blowes, JCU Professor Ross Alford, JCU. (Chapter 2-3) (Chapter 3) (Chapter 3) (Chapter 3) (Chapter 5). Data collection and processing Dr Euan G Ritchie Angus McNab (research assistant) Laura Mitchell (research assistant) Georgeanna Storey, Scatsabout (dietary analysis) Brooke Bateman (diet sample collection) Brian MacElvaine (diet sample collection) Hugh McGregor, AWC. (Chapter 2, App A) (Chapter 2, App A) (Chapter 2-3, App A) (App A) (App A) (App A) (Chapters 4-5). ix.
(11) Field research assistance Laura Mitchell Katrin Schmidt Karen Glynn Susan Campbell Teigan Allen Martin Aisthorpe Shane Blowes Rachel Heckathorn Véronique Mocellin Kate Stookey AWC staff and volunteers. Angus McNab Jen Leech Devi Hermsen Frank Bird Emily Hynes Dimitris Bastian Rithika Fernandes Sydney Jones Alex Young Jyoti Blencowe. Damian Morrant Delphi Ward Paul Mitrovski Michael Trombini Alex Ainscough Jess Beaulieu Bianca Grover Nina McLean Sam Loy Hugh MacGregor. Ethics statement The research presented and reported in this thesis was conducted in compliance with the National Health and Medical Research Council (NHMRC) Australian Code of Practice for the Care and Use of Animals for Scientific Purposes, 7th Edition, 2004 and the Queensland Animal Care and Protection Act 2001. Camera surveys were permitted by the James Cook University Animal Ethics Committee (JCU AEC) (no. A1423) and Department of Environment and Resource Management (Scientific Purposes Permit: WITK06493009). Animal trapping and handling methods were approved by the JCU AEC (no. A1613) and/or the Western Australian Department of Environment and Conservation (DEC) AEC (no. 2010/35 and 2011/03) and was permitted under the Wildlife Conservation Act 1950 (no. SF007564).. x.
(12) Publications and presentations. Peer-reviewed publications Brook, L.A., Johnson, C.N. & Ritchie, E.G. (2012) Effects of predator control on behaviour of an apex predator and indirect consequences for mesopredator suppression. Journal of Applied Ecology 49:1278-1286.. Manuscripts in preparation Brook, L. A., Johnson, C. N., Schwarzkopf, L. Nimmo, D. G. & Ritchie, E. G. (in prep) Hiding in plain sight: Do feral cats use complex habitats in north Queensland to avoid encounters with dingoes? To be submitted to Austral Ecology. Brook, L. A., Johnson, C. N., McGregor, H., Schwarzkopf, L., Ritchie, E. G. & Legge, S. (in prep) Seasonal space use of dingoes and feral cats: differences in patterns of intensity in northern Australian savanna. To be submitted to Journal of Mammalogy. Brook, L.A., Johnson, C.N., McGregor, H., Schwarzkopf, L., Legge, S. & Ritchie, E.G. (in prep) Spatial interactions between sympatric dingoes and feral cats in northern Australia: patterns of intraguild avoidance in a landscape of fear. To be submitted to Journal of Animal Ecology.. Conference presentations Biology in the Tropics Postgraduate Research Student Conference (2012), James Cook University, Townsville, QLD, Australia (Spoken paper) Brook, L.A., Johnson, C.N., Ritchie, E.G. and Schwarzkopf, L. (2012) When the dingo’s away does the feral cat play? Indirect effects of predator control on predator behaviour and suppression.. Ecological Society of Australia Annual Conference (2011) Hobart, TAS, Australia (Spoken paper) Brook, L. A., Johnson, C. N., Ritchie, E. G., Schwarzkopf, L. (2011) The effects of dingo control on feral cats and their behaviour.. Australian Mammal Society Annual Conference (2010) Canberra, ACT, Australia (Poster) Brook, L. A., Johnson, C. N., Ritchie, E. G., Schwarzkopf, L. (2010) Do feral cats avoid interactions with an apex predator, the dingo in space or time?. xi.
(13) Other publications during candidature Brook, L. A., Kutt, A. S. (2011) The diet of the dingo (Canis lupus dingo) in north-eastern Australia with comments on its conservation implications. The Rangeland Journal 33(1): 79-85.. xii.
(14) Thesis Abstract Predation can be an important force in ecosystem dynamics, imposing top-down effects on lower trophic guilds. Dominant apex predators can suppress smaller mesopredator populations, both directly via aggressive, sometimes lethal interactions, and indirectly through resource competition and/or changes to behaviour, as mesopredators attempt to reduce the risk of interactions. In the absence of apex predators, behavioural restrictions on mesopredators are lifted. This process of 'mesopredator release' can lead to increased mesopredator abundance and improved access to prey, and may culminate in stronger flow-on effects of mesopredators on prey. Understanding the mechanisms of intraguild interactions will clarify the role of apex predators in regulating trophic interactions, through the suppression of smaller predators. In the tropical savannas of northern Australia, the introduced feral cat Felis catus cooccurs with the dingo Canis lupus dingo, a mammalian apex predator. Feral cats prey on native wildlife and are implicated in the recent declines of small mammals in northern Australia. Further, feral cats are extremely difficult to control with current technologies. It has been suggested that dingoes could suppress feral cat populations in northern Australia, given recent evidence of negative impacts of dingoes on red foxes Vulpes vulpes, the interspecific killing of foxes and cats by dingoes, and international studies demonstrating mesopredator suppression. In this thesis, I examine the ecological interactions between dingoes and feral cats in northern Australia. I investigate a) whether dingoes can numerically suppress feral cat populations; and b) how dingoes influence the behaviour of cats. I used two contrasting methods to address these aims. Firstly, I examined broad-scale trends in predator abundance and behaviour with remote camera surveys on multiple, paired rangeland properties, where one property practiced dingo control, and the other left dingoes alone. Secondly, I collected highfrequency telemetry data from sympatric dingoes and feral cats in the Kimberley in northwestern Australia, to investigate fine-scale patterns of space use and potential effects of dingoes on cat behaviour.. xiii.
(15) Lethal control can affect both the abundance and behaviour of apex predators, which may influence top-down effects on mesopredators. I assessed how predator control affects abundance indices and activity patterns of dingoes and feral cats in nine areas across central and northern Australia, spanning more than 2,500 km. Predator control generally reduced dingo abundance indices. In areas with greater contrasts in dingo activity between paired sites, feral cat indices were higher on sites with lower dingo activity, indicating an inverse correlation between species. Feral cat visitation rates were lower at cameras used frequently by dingoes, with no cats recorded where dingo rates exceeded 1 night -1 . This suggests that dingoes may potentially exclude feral cats at a local scale. Dingoes in areas without predator control were broadly crepuscular, similar to their major prey (kangaroos), but controlled populations were less active in the early evening. Reduced evening activity of dingoes in areas with predator control was associated with increased cat activity in the early evening, which is a time when many small native prey (e.g. rodents and geckos) emerge to feed. These results suggest that cats adjust their behaviour to avoid times or places with higher dingo activity. I explored whether feral cats select habitat features to reduce the risk of interactions with dingoes in two regions of north Queensland, using generalised linear mixed models and remote camera data. In woodland habitats of Cape York Peninsula, both predators used roads, potentially for ease of movement. Where dingo activity was high, feral cats were recorded more frequently in open areas with less ground cover. Open habitats may enable feral cats to detect dingoes earlier, allowing them to reach nearby trees upon encounter. Dingo activity was low on the Gulf Plains, and cats were recorded more frequently in areas with relatively few refuges (tree cover). Treeless habitats would be expected to increase risk associated with dingo encounters, but the low dingo risk in this region could be insufficient to counter benefits of using open areas. Habitats with sufficient escape routes, such as woodlands, could reduce the risk of interactions and facilitate predator co-existence. Spatial and temporal characteristics of space use may influence predator-prey interactions. I estimated predator space use and core area intensity in the Kimberley region of Western Australia. Dingoes used larger areas than cats, but focussed activity on relatively small. xiv.
(16) core areas. Cats used space more evenly, spreading activity over core areas that formed a larger proportion of their total range, than in the case of dingoes. Dingoes moved more over time, although both species exhibited low temporal overlap in high-use areas. Predation pressure on small prey may therefore be more continuous within feral cat core areas, while the contrast in dingo activity could create areas of both low and high risk for large herbivores, mesopredators and small prey. Mesopredators should minimise the risk of intraguild interference when making space use decisions, in addition to maximising access to prey. I examined spatial interactions between sympatric dingoes and feral cats using telemetry data. Overlap between dingo and cat core areas was much lower than for overall space use. Use of shared space between the two predators was variable, ranging from avoidance to attraction. The number of occasions on which dingoes and feral cats were recorded within 1 km of each other was lower than expected, suggesting that cats either avoided close encounters with dingoes or responded to such encounters by moving away. While dingoes and feral cats are sympatric, cats appear to minimise intraguild interactions by either limiting spatial overlap or maintaining a safe distance from dingoes. In summary, feral cats may be excluded from areas used heavily by dingoes in northern Australian savannas, potentially providing refuge for prey from cat predation. However, as dingoes are mobile, these interactions are likely to be spatially and temporally dynamic. The strength of top-down control may be context-dependent, influenced by factors such as predator control, which alters dingo behaviour, and habitat complexity and resource availability, which can affect the rate of encounter and degree of aggressive interactions. This study demonstrates that behavioural shifts may be a critical component of suppression of mesopredators by apex predators, as feral cats appear to alter behaviour to avoid dingoes. Behavioural effects on mesopredators should be considered when assessing the potential benefits of dingoes for lower trophic guilds.. xv.
(17) xv i.
(18) Table of Contents Acknowledgments ............................................................................................................... v Statement on contributions of others .................................................................................... ix Publications and presentations ............................................................................................. xi Thesis Abstract................................................................................................................. xiii Table of Contents ............................................................................................................ xvii List of Tables ................................................................................................................... xxi List of Figures ..................................................................................................................xxv List of Appendices.........................................................................................................xxxiii Chapter 1 General Introduction.......................................................................................... 1 The trophic role of the apex predator ............................................................................. 1 Eliminating the competition: effects on mesopredators ................................................. 2 Factors influencing top-down effects ........................................................................... 5 Contention in trophic cascades .................................................................................... 6 Predator interactions in Australia.................................................................................. 7 The feral cat............................................................................................................... 8 The dingo ................................................................................................................ 10 Potential benefits of trophic regulation in northern Australia ....................................... 16 Thesis aims and objectives .......................................................................................... 18 Aim 1: Determine whether dingoes can numerically suppress feral cat populations....... 18 Aim 2: Further understanding of predator ecology ...................................................... 19 Aim 3: Explore how dingoes potentially influence the behaviour of feral cats .............. 19 Thesis outline and structure......................................................................................... 20 Chapter 2 Effects of predator control on behaviour of an apex predator and indirect consequences for mesopredator suppression ....................................................................... 23 Abstract ..................................................................................................................... 23 Introduction ............................................................................................................... 24 Methods..................................................................................................................... 26 Study area and data collection ................................................................................... 26. xv ii.
(19) Analysis................................................................................................................... 28 Results ....................................................................................................................... 30 Effect of control on indices of dingo abundance ......................................................... 30 Relationships between indices of dingo and feral cat abundance .................................. 31 Dingo behaviour....................................................................................................... 32 Feral cat behaviour ................................................................................................... 33 Prey activity patterns ................................................................................................ 35 Discussion .................................................................................................................. 36 Predator control and predator numbers ....................................................................... 36 Avoidance in time .................................................................................................... 37 Avoidance in space................................................................................................... 38 How could behavioural shifts affect prey species? ...................................................... 39 Chapter 3 Hiding in plain sight: Do feral cats use complex habitats in north Queensland to avoid encounters with dingoes? .......................................................................................... 43 Abstract ..................................................................................................................... 43 Introduction................................................................................................................ 44 Methods ..................................................................................................................... 47 Study areas .............................................................................................................. 47 Vegetation ............................................................................................................... 48 Survey methods........................................................................................................ 50 Generalised Linear Mixed Modelling (GLMM) .......................................................... 51 Results ....................................................................................................................... 54 Cape York ............................................................................................................... 54 Gulf Plain ................................................................................................................ 58 Discussion .................................................................................................................. 60 Dingoes on Cape York Peninsula .............................................................................. 61 Feral cats on Cape York Peninsula............................................................................. 62 Feral cats on the Gulf Plains...................................................................................... 63 Caveats and future research directions ....................................................................... 64 Are cats using habitat features to avoid dingoes? ........................................................ 66 Conclusion............................................................................................................... 67 Chapter 4 Seasonal space use of dingoes and feral cats: differences in patterns of intensity in northern Australian savanna ............................................................................................... 69 Abstract ..................................................................................................................... 69 Introduction................................................................................................................ 70 Methods ..................................................................................................................... 73. xv iii.
(20) Study area................................................................................................................ 73 Trapping and processing ........................................................................................... 75 Data screening ......................................................................................................... 77 Autocorrelation ........................................................................................................ 78 Analysis of space use ............................................................................................... 79 Results ....................................................................................................................... 85 Autocorrelation ........................................................................................................ 86 Kernel density estimation ......................................................................................... 86 Movement kernel density estimation ......................................................................... 90 Intensity and recursion distributions .......................................................................... 90 Core intensity indices ............................................................................................... 90 Activity patterns within the core area......................................................................... 92 Site fidelity .............................................................................................................. 92 Discussion.................................................................................................................. 94 Chapter 5 Spatial interactions between sympatric dingoes and feral cats in the Kimberley: patterns of intraguild avoidance in a landscape of fear ........................................................101 Abstract ....................................................................................................................101 Introduction ..............................................................................................................102 Methods....................................................................................................................106 Static overlap indices...............................................................................................107 Distance between animals ........................................................................................108 Dynamic overlap indices .........................................................................................109 Results ......................................................................................................................112 Were there differences in static spatial overlap between and among predators? ...........112 Were predators found closer to or further from each other than expected? ...................115 Did predators use shared space differently? ...............................................................118 Discussion.................................................................................................................122 Dingo-cat interactions .............................................................................................122 Dingo-dingo interactions .........................................................................................124 Cat-cat interactions..................................................................................................125 Caveats and future research directions ......................................................................126 Implications for biodiversity conservation ................................................................128 Conclusion .............................................................................................................128 Chapter 6 General discussion..........................................................................................131 Summary of major findings.........................................................................................132 Aim 1: Determine whether dingoes can numerically suppress feral cat populations......132. xix.
(21) Aim 2: Further understanding of predator ecology .................................................... 133 Aim 3: Explore how dingoes potentially influence the behaviour of feral cats............. 134 Can dingoes effectively suppress feral cats in northern Australia? ............................... 136 Behavioural games between clever predators? .......................................................... 137 Habitat complexity ................................................................................................. 137 Strength of competition........................................................................................... 138 Predator control...................................................................................................... 138 Dynamic trophic interactions................................................................................... 139 Future research directions......................................................................................... 139 Integrate prey and habitat information...................................................................... 139 Investigate prevalence of interspecific killing ........................................................... 140 Experimental studies............................................................................................... 140 Incorporate resource fluctuations ............................................................................. 141 Concluding remarks.................................................................................................. 141 References....................................................................................................................... 143. xx.
(22) List of Tables Table 3.1. Habitat complexity variables measured at each camera station. ............................. 52 Table 3.2. Explanatory variables and interactions included in generalised linear mixed models in each area to address each of the research predictions. Some variables differed between areas due to differences in collinearity or better model fit. Habitat variables were also included as single factors to compare the importance of the interaction to the habitat variables alone.................. 53 Table 3.3. Best supported models ( < 2) of predator activity on Cape York Peninsula (CYP) and Gulf Plains (GP), selected using the second-order Akaike Information Criterion (AICc). .. 55 Table 3.4. Relative importance of variables explaining predator activity on Cape York Peninsula (CYP) and Gulf Plains (GP), drawn from model averaging. Variables with > 0.5 are considered to be more important (Ritchie et al. 2009)........................................................... 58 Table 3.5. Number of nights on which predators were recorded, over seasons and treatments. Seasonal differences are compared using binomial tests, against a null hypothesis that the response is equal between seasons. ..................................................................................... 59 Table 4.1. Fix rates for dingo Canis lupus dingo and feral cat Felis catus data (mean ± se) following removal of zeros and errors. ................................................................................ 85 Table 4.2. Kernel density estimates for dingoes Canis lupus dingo and cats Felis catus, including estimates of core area and intensity of use. Range is provided in parentheses. Appendix D.2 presents estimates for all individuals, including those that did not reach asymptote.......................................................................................................................... 86 Table 4.3. Movement kernel density estimates for the utilisation (UD), intensity (ID) and recursion (RD) distributions of dingoes Canis lupus dingo and feral cats Felis catus. The range is within parentheses.......................................................................................................... 89 Table 4.4. Estimates of spatial overlap between short-term utilisation distributions, using the Bhattacharyya Index (BA), at different isopleths, for dingoes Canis lupus dingo and feral cats Felis catus. Pooled mean and standard error are presented. ................................................... 92 Table 5.1. Fix rates and specifications for GPS data used in this chapter. Fix rates are for full datasets prior to subsampling. Pooled mean percentages are shown in parentheses. One dingo and one feral cat were caught in both years but are treated as separate animals in these analyses. ........................................................................................................................................112 Table 5.2. Distance analysis results for each dyad type. The observed value is averaged across dyads, and the null mean is averaged first across each dyad in each replicate, and then across. xxi.
(23) replicates. The P-value is for the pooled test, while the number of significant dyads indicates the number (and % in parentheses) of individual dyads for which the observed metric was significantly different from the expected value. Italicised P-values should be treated with caution, as the null distribution was not considered symmetrical using the MGG test (Miao et al. 2006). ............................................................................................................................. 117 Table 5.3. Number of significant spatial effects in relation to the overlap zone in dynamic overlap analysis of dingoes and feral cats. Likelihood coefficient values are presented below in parentheses (one value for single samples or mean ± se). For D-C dyads, dingo coefficient values are in plain text and cat coefficient values are italicised. ........................................... 119 Table 5.4. Summary of significant non-random temporal interactions in relation to the overlap zone in dynamic overlap analysis of dingoes and feral cats. Odds ratios considerably greater than 1 (>1.2, in bold) indicate a larger than expected frequency, while those smaller than 1 indicate lower than expected frequency. ............................................................................ 120 Table A.1. Summary of dietary items recorded in dingo scats in each area and in the total sample............................................................................................................................. 185 Table A.2. Summary of dietary items recorded in feral cat scats in the total sample. ............. 190 Table C.1. Filtering rules applied to the test data. ............................................................... 198 Table D.1. Summary of data collection and screening outcomes for all collared individuals. . 205 Table D.2. Utilisation distribution estimates (KDE) for all collared individuals. ................... 206 Table D.3. Utilisation distribution estimates (MKDE) for all collared individuals. ................ 207 Table D.4. Intensity and recursion distribution estimates (MKDE) for all collared individuals. ....................................................................................................................................... 208 Table D.5. Minimum Convex Polygon (MCP) estimates for all collared individuals using different proportions of the data. ....................................................................................... 209 Table E.1. Summary of animals for who the density estimates for each distribution type reached sufficient asymptote. ........................................................................................................ 211 Table G.1. Mean (± se) overlap indices calculated using UDOI (plain) and PHR (italics), for different dyad types and distribution contours. Parentheses contain the number of dyads with positive overlap, although all dyads that overlapped at the 95% contour are included. .......... 253 Table G.2. Wilcoxon signed-rank test statistics and exact P-values for comparisons between overlap at different distributions for each dyad type, estimated using UDOI. No comparisons were made between distribution types for cat-cat dyads, as there was no significant difference. xxii.
(24) between groups (Asymptotic Friedman test: = 4.2, P = 0.24). Data sets that could not be logtransformed to ensure the distribution of differences was symmetrical are marked NA. .........254 Table G.3. Wilcoxon signed-rank test statistics and exact P-values for comparisons between overlap at different distributions for each dyad type, estimated using PHR. Data sets that could not be log-transformed to ensure the distribution of differences was symmetrical are marked NA. .................................................................................................................................255 Table G.4. Distance analysis results for dingo-dingo and cat-cat dyads. P-values are from randomisation tests comparing the observed metric with the null distribution. P-values in italics should be treated with caution, as the null distribution was not considered symmetrical by the MGG test (Miao et al. 2006)..............................................................................................256 Table G.5. Distance analysis results for dingo-cat dyads. P-values are from randomisation tests comparing the observed metric with the null distribution. P-values in italics should be treated with caution, as the null distribution was not considered symmetrical by the MGG test (Miao et al. 2006). .........................................................................................................................258 Table G.6. Extended results of dynamic overlap analysis. ....................................................260 Table H.1. Percentage of dyads for each dyad type that had less than 10% overlap for MCP95 and MCP100, estimated using HR. ....................................................................................264. xxiii.
(25) xxiv.
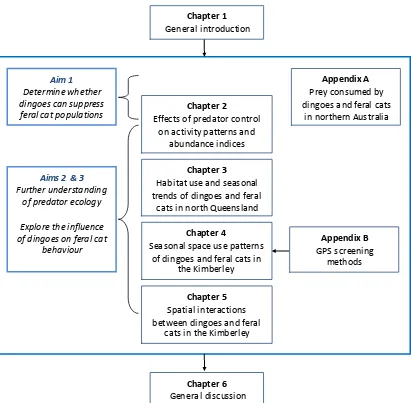
(26) List of Figures Figure 1.1. Proposed interactions between dingoes, feral cats and prey in northern Australian savanna ecosystems. Dingoes suppress populations of large prey, but impacts on small prey may be alleviated indirectly, due to suppression of feral cat predation and reduced removal of vegetation by larger prey such as macropods. Photo of stripe-faced dunnart Sminthopsis macroura © Greg Calvert................................................................................................... 15 Figure 1.2. Thesis structure. ............................................................................................... 21 Figure 2.1. Paired survey areas across Australia. Each pair consists of one site that controls dingoes, and one without dingo control. .............................................................................. 28 Figure 2.2. Abundance indices of dingoes and feral cats derived from camera records in each paired survey area. Black and light grey bars represent dingoes in sites without and with predator control, and dark grey and white bars represent feral cats in sites without and with predator control, respectively. ............................................................................................. 31 Figure 2.3. Contrast in predator abundance indices (AI) in paired survey areas differing in dingo control (N = 9). Positive values represent higher abundance indices in the site without dingo control, and negative values represent higher abundance indices in site with control. Hence the bottom right quadrant represents survey areas with more dingoes in the site without control and more cats in the site with control. ........................................................................................ 32 Figure 2.4. Predator trap rates at individual camera stations (N = 279 stations with at least one predator recorded). Regression lines, slope coefficients and signif icance values for quantiles are shown (50th quantile: dashed; 75th : gray; 95th : dot-dashed; 99th : solid). ................................... 33 Figure 2.5. Proportion of activity records a) with and b) without dingo control. Time has been scaled to a circular distribution with equal distance between sunset and sunrise. In 5a and b, black bars represent dingoes with (N = 85) and without (N = 249) control, and light grey bars represent cats with (N = 81) and without (N = 129) control. .................................................. 34 Figure 2.6. Proportion of activity records in the dusk/early evening (one hour pre-sunset to three hours post-sunset) (N = 13 sites with at least one dingo and one cat record). Data are square-root transformed. ...................................................................................................................... 35 Figure 2.7. Proportion of a) dingo (dark grey) and large macropod (light grey) activity records in areas without predator control and b) feral cat (white) and small mammal (black) activity records in areas with predator control. ................................................................................. 36 Figure 3.1. Location of study sites in the Gulf Plains (fawn) and Cape York Peninsula (olive) bioregions in north Queensland, Australia. .......................................................................... 48. xxv.
(27) Figure 3.2. Examples of habitat variability on the Gulf Plain (a, c, e, g) and Cape York Peninsula (b, d, f, h) ranging from complex ground cover and tree cover (a, b), tree cover with low ground cover (c, d), complex ground cover and minimal tree cover (e, f) and low ground cover and minimal tree cover (g, h) ..................................................................................... 49 Figure 3.3. Model averaged parameter estimates (mean ± CI) influencing a) dingo and b) feral cat activity on Cape York Peninsula. Bar colour represents relative importance, from > 0.75 (dark grey), between 0.75 and 0.5 (medium grey), between 0.5 and 0.25 (light grey), to < 0.25 (white). UB: unbaited property not using predator control. .................................................... 57 Figure 3.4. Model averaged parameter estimates (mean ± CI) influencing feral cat activity on the Gulf Plains. Bar colour represents relative importance, from between 0.5 and 0.25 (light grey), to < 0.25 (white). UB: unbaited property not using predator control. ............................ 60 Figure 4.1. The central Kimberley bioregion in north-western Australia (top left), showing the boundaries of the Mornington and Marion Downs Wildlife Sanctuaries and major vegetation groups (National Vegetation Information System) (bottom left). Trapping zones are highlighted in blue within each study area. ............................................................................................ 74 Figure 4.2. Core delineation method showing scaled isopleth volume against proportion of home range area. The core is delineated (in red) where the slope of the curve = 1, or where the distance between the curve and line of random use is maximal. The solid black arrow indicates the maximum distance using the method adapted from Vander Wal & Rodgers (2012), which identifies the greatest difference in % area. .......................................................................... 82 Figure 4.3. Core area as a proportion of the space use area (95% contour), for two core delineation methods (maximum probability method of Seaman & Powell 1990) and isopleth volume method used here) and four distribution metrics. All Spearman's rank rho coefficients were significant (P < 0.005)................................................................................................ 83 Figure 4.4. Kernel density estimates of 95% (hollow) and core (filled) isopleths for a) dingoes Canis lupus dingo and b) feral cats Felis catus at Mornington and c) dingoes at the Siddins Valley (Marion Downs) site. The 95% and core isopleths and trajectory of transient dingo DS_M3 are not shown. Property boundaries, study areas and the Gibb River Rd are provided inset. See Appendix F for individual figures. ....................................................................... 87 Figure 4.5. Kernel density estimates of 95% (hollow) and core (filled) isopleths for a) dingoes Canis lupus dingo and b) feral cats Felis catus at Mornington in 2012. Property boundaries, study areas and the Gibb River Rd are provided inset. See Appendix F for individual figures.. 88 Figure 4.6. Indices of relative intensity of core area use (% core isopleth/core area as % of 95% isopleth area) for dingoes Canis lupus dingo (grey) and feral cats Felis catus (white) using different distribution metrics (mean ± se)............................................................................. 91. xxv i.
(28) Figure 4.7. The mean proportion of feral cat Felis catus and dingo Canis lupus dingo fixes within animal-specific core areas estimated using MKDE. Blue panels cover the range of sunrise and sunset times during the study periods. ................................................................ 91 Figure 4.8. Examples of temporal overlap between core isopleths of the KDE utilisation distribution for each two-week period for dingoes Canis lupus dingo a) DM_F5 and b) DS_M4 and feral cats Felis catus: c) CM_M2 and d) CM_M3. ......................................................... 93 Figure 4.9. Ninety-five percent isopleths of utilisation distribution estimates for dingo Canis lupus dingo DM_M1 (2011: purple, 2012: blue) and cat Felis catus CM_M4 (2011: orange, 2012: red) with core areas shaded, showing overlap between years. ...................................... 94 Figure 4.10. Movements and space use of dingo Canis lupus dingo DS_F1: a) High-frequency trajectory over 1-s slope layer with hillshading, showing avoidance of steep slopes; b) MKDE utilisation distribution, with 95% and core isopleths; c) MKDE intensity distribution with core isopleth and d) MKDE recursion distribution with core isopleth. ........................................... 95 Figure 5.1. The study site, Mornington Wildlife Sanctuary, located within the central Kimberley bioregion (light green) in north-western Australia (inset). Dingoes and feral cats were collared near Mornington’s Wildlifelink Research Station, in the area shaded blue, north of the Fitzroy River................................................................................................................................106 Figure 5.2. Contingency table of probabilities and number of simultaneous fixes for each possible space use outcome (adapted from Minta 1992). The number of simultaneous sightings of species and in the overlap zone (OZ) is represented by . Similarly, there were occasions when neither individual were in the OZ. The probability of both animals present in the OZ is. , while the probability of species. being in the OZ independent of. is. . ....110. Figure 5.3. Mean (± se) overlap values for a) UDOI and b) PHR indices for different dyads and distribution contours. Dingo-cat columns refer to the probability of a dingo being located within a feral cat contour, while cat-dingo columns represent the probability of a feral cat being located within a dingo contour. .....................................................................................................113 Figure 5.4. Feral cat locations collected at 15-min intervals over both years. CM_M1-5 were collared in 2011. CM_M4, CM_M6-8 and CM_F1 were collared in 2012.............................114 Figure 5.5. Percent frequency distributions for distances between pooled synchronous fixes and pooled asynchronous fixes from the randomised null distribution for a) dingo-cat dyads, to a maximum of 2,000 m, b) dingo-dingo dyads to a maximum of 5,000 m and c) cat-cat dyads to a maximum of 2,000 m. .......................................................................................................116 Figure 5.6. Examples of overlap between KDEs for a) and b) two pairs of female dingoes, c) a female dingo and male cat and d) a male dingo and male cat. Animals in a) and c) have significant symmetrical and simultaneous attraction to the OZ. Animals in d) both avoid the OZ.. xxv ii.
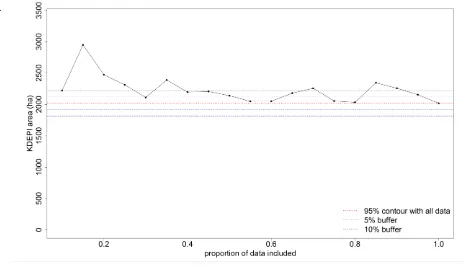
(29) Animals in b) were not analysed for dynamic overlap, and appear to represent dingoes in adjacent packs. ................................................................................................................ 121 Figure A.1. Examples of habitat from a) Cape York Peninsula, b) Einasleigh Uplands, c) Gulf Plain and d) the Kimberley. .............................................................................................. 183 Figure A.2. Percent frequency of occurrence of different prey categories for each survey area and total sample. .............................................................................................................. 188 Figure A.3. Volume of different prey categories in the dietary samples for each area and the total sample. .................................................................................................................... 189 Figure C.1.Distribution of all errors (a, c, e, g) and errors < 1 km (b, d, f, h) dependent on fix type (a, b), dilution of precision (c, d), number of satellites used (e, f) and satellite sensor value (g, h). .............................................................................................................................. 199 Figure C.2. Relationship between the difference in altitude reading and a) all errors, b) errors < 1 km and c) errors < 100 m. Fixes in c) are also restricted to those with < 200 m difference in altitude reading, and show the cut-off used in screening for altitude reading, and show the cutoff used in screening for altitude difference at 100 m (red dashed line). The trade-off between mean error (thick line) and data loss (thin line) with altitude value cut-off is shown in 2d. .... 200 Figure C.3. The mean (weighted) and standard deviation of error in fixes remaining once different screening methods were applied. The mean number of errors indicates levels of data loss. Filtering rule abbreviations are given in full in Table C.1. ........................................... 202 Figure C.4. The mean (weighted) and standard deviation of error in fixes following screening methods that removed fixes with differences in altitude ≥ 100 m. ........................................ 203 Figure E.1. Seasonal space use area (ha) against proportion of data included, for a) KDE (plugin method) and b) MKDE utilisation distributions for DS_M1, a male dingo collared in 2011 in Siddins Valley. Blue and purple lines represent 5% and 10% boundaries respectively, around the 95% KDE calculated with all data (red line). ................................................................ 212 Figure E.2. Seasonal space use area (ha) against proportion of data included, for a) KDE (plugin method) and b) MKDE utilisation distributions for DS_M2, a male dingo collared in 2011 in Siddins Valley. Blue and purple lines represent 5% and 10% boundaries respectively, around the 95% KDE calculated with all data (red line). ................................................................ 213 Figure E.3. Seasonal space use area (ha) against proportion of data included, for a) KDE (plugin method) and b) MKDE utilisation distributions for DS_M3, a male dingo collared in 2011 in Siddins Valley. Blue and purple lines represent 5% and 10% boundaries respectively, around the 95% KDE calculated with all data (red line). ................................................................ 214. xxv iii.
(30) Figure E.4. Seasonal space use area (ha) against proportion of data included, for a) KDE (plugin method) and b) MKDE utilisation distributions for DS_M4, a male dingo collared in 2011 in Siddins Valley. Blue and purple lines represent 5% and 10% boundaries respectively, around the 95% KDE calculated with all data (red line). .................................................................215 Figure E.5. Seasonal space use area (ha) against proportion of data included, for a) KDE (plugin method) and b) MKDE utilisation distributions for DS_F1, a female dingo collared in 2011 in Siddins Valley. Blue and purple lines represent 5% and 10% boundaries respectively, around the 95% KDE calculated with all data (red line). .................................................................216 Figure E.6. Seasonal space use area (ha) against proportion of data included, for a) KDE (plugin method) and b) MKDE utilisation distributions for DS_F2, a female dingo collared in 2011 in Siddins Valley. Blue and purple lines represent 5% and 10% boundaries respectively, around the 95% KDE calculated with all data (red line). .................................................................217 Figure E.7. Seasonal space use area (ha) against proportion of data included, for a) KDE (plugin method) and b) MKDE utilisation distributions using data from 2011 for DM_M1, a male dingo collared in both years at Mornington. Blue and purple lines represent 5% and 10% boundaries respectively, around the 95% KDE calculated with all data (red line). .................218 Figure E.8. Seasonal space use area (ha) against proportion of data included, for a) KDE (plugin method) and b) MKDE utilisation distributions using data from 2012 for DM_M1, a male dingo collared in both years at Mornington. Blue and purple lines represent 5% and 10% boundaries respectively, around the 95% KDE calculated with all data (red line). .................219 Figure E.9. Seasonal space use area (ha) against proportion of data included, for a) KDE (plugin method) and b) MKDE utilisation distributions using data from both years for DM_M1, a male dingo collared in both years at Mornington. Blue and purple lines represent 5% and 10% boundaries respectively, around the 95% KDE calculated with all data (red line). .................220 Figure E.10. Seasonal space use area (ha) against proportion of data included, for a) KDE (plugin method) and b) MKDE utilisation distributions for DM_M2, a male dingo collared in 2011 at Mornington. Blue and purple lines represent 5% and 10% boundaries respectively, around the 95% KDE calculated with all data (red line). ......................................................................221 Figure E.11. Seasonal space use area (ha) against proportion of data included, for a) KDE (plugin method) and b) MKDE utilisation distributions for DM_F1, a female dingo collared in 2011 at Mornington. Blue and purple lines represent 5% and 10% boundaries respectively, around the 95% KDE calculated with all data (red line). ......................................................................222 Figure E.12. Seasonal space use area (ha) against proportion of data included, for a) KDE (plugin method) and b) MKDE utilisation distributions for DM_F2, a female dingo collared in 2011 at Mornington. Blue and purple lines represent 5% and 10% boundaries respectively, around the 95% KDE calculated with all data (red line). ......................................................................223. xxi x.
(31) Figure E.13. Seasonal space use area (ha) against proportion of data included, for a) KDE (plugin method) and b) MKDE utilisation distributions for DM_F3, a female dingo collared in 2012 at Mornington. Blue and purple lines represent 5% and 10% boundaries respectively, around the 95% KDE calculated with all data (red line). ..................................................................... 224 Figure E.14. Seasonal space use area (ha) against proportion of data included, for a) KDE (plugin method) and b) MKDE utilisation distributions for DM_F4, a female dingo collared in 2012 at Mornington. Blue and purple lines represent 5% and 10% boundaries respectively, around the 95% KDE calculated with all data (red line). ..................................................................... 225 Figure E.15. Seasonal space use area (ha) against proportion of data included, for a) KDE (plugin method) and b) MKDE utilisation distributions for DM_F5, a female dingo collared in 2012 at Mornington. Blue and purple lines represent 5% and 10% boundaries respectively, around the 95% KDE calculated with all data (red line). ..................................................................... 226 Figure E.16. Seasonal space use area (ha) against proportion of data included, for a) KDE (plugin method) and b) MKDE utilisation distributions for DM_F6, a female dingo collared in 2012 at Mornington. Blue and purple lines represent 5% and 10% boundaries respectively, around the 95% KDE calculated with all data (red line). ..................................................................... 227 Figure E.17. Seasonal space use area (ha) against proportion of data included, for a) KDE (plugin method) and b) MKDE utilisation distributions for CM_M1, a male cat collared in 2011 at Mornington. Blue and purple lines represent 5% and 10% boundaries respectively, around the 95% KDE calculated with all data (red line). ..................................................................... 228 Figure E.18. Seasonal space use area (ha) against proportion of data included, for a) KDE (plugin method) and b) MKDE utilisation distributions for CM_M2, a male cat collared in 2011 at Mornington. Blue and purple lines represent 5% and 10% boundaries respectively, around the 95% KDE calculated with all data (red line). ..................................................................... 229 Figure E.19. Seasonal space use area (ha) against proportion of data included, for a) KDE (plugin method) and b) MKDE utilisation distributions for CM_M3, a male cat collared in 2011 at Mornington. Blue and purple lines represent 5% and 10% boundaries respectively, around the 95% KDE calculated with all data (red line). ..................................................................... 230 Figure E.20. Seasonal space use area (ha) against proportion of data included, for a) KDE (plugin method) and b) MKDE utilisation distributions using data from 2011 for CM_M4, a male cat collared in both years at Mornington. Blue and purple lines represent 5% and 10% boundaries respectively, around the 95% KDE calculated with all data (red line). ................................. 231 Figure E.21. Seasonal space use area (ha) against proportion of data included, for a) KDE (plugin method) and b) MKDE utilisation distributions using data from 2012 for CM_M4, a male cat collared in both years at Mornington. Blue and purple lines represent 5% and 10% boundaries respectively, around the 95% KDE calculated with all data (red line). ................................. 232. xxx.
(32) Figure E.22. Seasonal space use area (ha) against proportion of data included, for a) KDE (plugin method) and b) MKDE utilisation distributions using data from both years for CM_M4, a male cat collared in both years at Mornington. Blue and purple lines represent 5% and 10% boundaries respectively, around the 95% KDE calculated with all data (red line). .................233 Figure E.23. Seasonal space use area (ha) against proportion of data included, for a) KDE (plugin method) and b) MKDE utilisation distributions for CM_M6, a male cat collared in 2012 at Mornington. Blue and purple lines represent 5% and 10% boundaries respectively, around the 95% KDE calculated with all data (red line). ......................................................................234 Figure E.24. Seasonal space use area (ha) against proportion of data included, for a) KDE (plugin method) and b) MKDE utilisation distributions for CM_M7, a male cat collared in 2012 at Mornington. Blue and purple lines represent 5% and 10% boundaries respectively, around the 95% KDE calculated with all data (red line). ......................................................................235 Figure E.25. Seasonal space use area (ha) against proportion of data included, for a) KDE (plugin method) and b) MKDE utilisation distributions for CM_M8, a male cat collared in 2012 at Mornington. Blue and purple lines represent 5% and 10% boundaries respectively, around the 95% KDE calculated with all data (red line). ......................................................................236 Figure E.26. Seasonal space use area (ha) against proportion of data included, for a) KDE (plugin method) and b) MKDE utilisation distributions for CM_F1, a female cat collared in 2012 at Mornington. Blue and purple lines represent 5% and 10% boundaries respectively, around the 95% KDE calculated with all data (red line). ......................................................................237 Figure F.1. Ninety-five percent and core isopleths for the a) KDE and b) MKDE utilisation distributions and c) fixes and trajectory of DS_M1, and the d) KDE and e) MKDE utilisation distributions and f) fixes and trajectory of DS_M2, both male dingoes collared in 2011 in Siddins Valley. .................................................................................................................239 Figure F.2. Ninety-five percent and core isopleths for the a) KDE and b) MKDE utilisation distributions and c) fixes and trajectory of DS_M3, a male dingo, and the d) KDE and e) MKDE utilisation distributions and f) fixes and trajectory of DS_F1, a female dingo, both collared in 2011 in Siddins Valley. .....................................................................................................240 Figure F.3. Ninety-five percent and core isopleths for the a) KDE and b) MKDE utilisation distributions and c) fixes and trajectory of DS_M4, a male dingo, and the d) KDE and e) MKDE utilisation distributions and f) fixes and trajectory of DS_F2, a female dingo, both collared in 2011 in Siddins Valley. .....................................................................................................241 Figure F.4. Ninety-five percent and core isopleths for the a) KDE and b) MKDE utilisation distributions and c) fixes and trajectory of DM_M1, and the d) KDE and e) MKDE utilisation distributions and f) fixes and trajectory of DM_M2, both male dingoes collared in 2011 at Mornington. .....................................................................................................................242. xxxi.
(33) Figure F.5. Ninety-five percent and core isopleths for the a) KDE and b) MKDE utilisation distributions and c) fixes and trajectory of DM_F1, and the d) KDE and e) MKDE utilisation distributions and f) fixes and trajectory of DM_F2, both male dingoes collared in 2011 at Mornington. .................................................................................................................... 243 Figure F.6. Ninety-five percent and core isopleths for the a) KDE and b) MKDE utilisation distributions and c) fixes and trajectory of DM_F3, and the d) KDE and e) MKDE utilisation distributions and f) fixes and trajectory of DM_F4, both female dingoes collared in 2012 at Mornington. .................................................................................................................... 244 Figure F.7. Ninety-five percent and core isopleths for the a) KDE and b) MKDE utilisation distributions and c) fixes and trajectory of DM_F5, and the d) KDE and e) MKDE utilisation distributions and f) fixes and trajectory of DM_F6, both female dingoes collared in 2012 at Mornington. .................................................................................................................... 245 Figure F.8. Ninety-five percent and core isopleths for the a) KDE and b) MKDE utilisation distributions and c) fixes and trajectory of CM_M1, and the d) KDE and e) MKDE utilisation distributions and f) fixes and trajectory of CM_M2, both male cats collared in 2011 at Mornington. .................................................................................................................... 246 Figure F.9. Ninety-five percent and core isopleths for the a) KDE and b) MKDE utilisation distributions and c) fixes and trajectory of CM_M3, a male cat collared in 2011, and the d) KDE and e) MKDE utilisation distributions and f) fixes and trajectory of CM_M4, a male cat collared in both years at Mornington. ............................................................................................. 247 Figure F.10. Ninety-five percent and core isopleths for the a) KDE and b) MKDE utilisation distributions and c) fixes and trajectory of CM_M6, and the d) KDE and e) MKDE utilisation distributions and f) fixes and trajectory of CM_M7, both male cats collared in 2012 at Mornington. .................................................................................................................... 248 Figure F.11. Ninety-five percent and core isopleths for the a) KDE and b) MKDE utilisation distributions and c) fixes and trajectory of CM_M8, a male cat collared in 2012, and the d) KDE and e) MKDE utilisation distributions and f) fixes and trajectory of CM_F1, a female cat collared in 2012 at Mornington. ........................................................................................ 249 Figure G.1. Boxplots comparing a) UDOI and b) PHR between dyad types at the 95% and core contours for the MKDE utilisation distribution................................................................... 252. xxxii.
(34) List of Appendices Appendix A: Notes on prey consumed by dingoes and feral cats in northern Australia ..........179 Introduction ..............................................................................................................179 Methods....................................................................................................................182 Results ......................................................................................................................184 Discussion.................................................................................................................190 Appendix B: Sun-time calibration of activity data ...............................................................193 Appendix C: The effect of screening methods on bias and data loss in GPS fixes ..................195 Introduction ..............................................................................................................195 Methods....................................................................................................................196 Results ......................................................................................................................198 Discussion.................................................................................................................203 Appendix D: Additional tables from Chapter 4 ...................................................................205 Appendix E: Summary of Incremental Area Analysis..........................................................211 Appendix F: Figures of density estimates for dingoes and feral cats .....................................239 Appendix G: Additional plots and tables from Chapter 5 .....................................................251 Appendix H: Overlap in MCP as a measure of territoriality .................................................263 Methods....................................................................................................................263 Results ......................................................................................................................264. xxxiii.
(35) xxxiv.
(36) Chapter 1 General Introduction. The trophic role of the apex predator Predators characteristically occupy the top spot in the food chain, but when several predators co-occur, aggressive competition for resources can result. Interactions between apex predators, the dominant, largest-bodied predators in an ecosystem, and smaller-bodied species known as mesopredators, may be just as strong as interactions between predators and prey (Ritchie & Johnson 2009). Further, by restricting the abundance or behaviour of mesopredators (Prugh et al. 2009; Berger 2010), intraguild interactions can have flow-on effects on lower trophic guilds (Estes et al. 2011). Apex predators are often considered 'keystone' species (Paine 1969; Soulé et al. 2005), as they can impose ecosystem-wide effects via trophic cascades, by interacting both directly and indirectly with prey and other predators (Hebblewhite et al. 2005; Terborgh et al. 2010; Ripple & Beschta 2012). Apex predators can enhance diversity, by limiting competitively superior species in lower trophic guilds (Sergio et al. 2007). Some predators may selectively take weak, diseased or old individuals (Moore 2002; Husseman et al. 2003), maintaining the health of prey populations (Packer et al. 2003). Remaining carcasses can support populations of scavengers, raptors, smaller predators and invertebrates (Melis et al. 2004; Selva et al. 2005; Wikenros et al. 2013), and facilitate nutrient recycling (Towne 2000). Hairston, Smith and Slobodkin (HSS, 1960) proposed the 'Green World Hypothesis', that predators can structure ecosystems by limiting herbivores and ensuring vegetation communities are not depleted. Predators influence the population size and behaviour of large herbivore prey, both through direct killing and fear of predation, also known as nonconsumptive or risk effects (Lima 1998; Creel & Christianson 2008; Berger 2010). Risk effects that alter habitat use or foraging behaviour (Creel et al. 2005; Preisser & Bolnick 2008) can. 1.
(37) reduce the fitness (Preisser et al. 2005) or reproductive output of prey (Ruxton & Lima 1997; Creel et al. 2007; but see Middleton et al. 2013). Fear-driven risk effects may impose behaviourally-mediated trophic cascades (Schmitz et al. 1997), potentially influencing prey demography as significantly as direct predation (Preisser et al. 2005; Creel & Christianson 2008). Areas or habitats where prey are vulnerable carry a greater risk of predation compared to areas of refuge or low predator density. These 'hills' and 'valleys' of varying predation risk form a spatial and temporal 'landscape of fear' (Laundré et al. 2001). The decisions of prey are expected to be guided by fear associated with high-risk areas (Arias-Del Razo et al. 2012). The ecological benefits of large predators are perhaps most evident once they disappear. As human populations have expanded in recent centuries, increasing contact and conflict of people with predators, anthropogenic forces such as loss of habitat and prey, and direct persecution have reduced the diversity and distribution of large predators (Treves & Karanth 2003; Laliberte & Ripple 2004). Without the effects of predation and predation risk, herbivore populations can expand and increase demands on resources (Côté et al. 2004). This can lead to reduced plant growth or diversity, or changes to vegetation structure or communities (McLaren & Peterson 1994; Estes & Duggins 1995; Schmitz et al. 2000; Soulé et al. 2003; Beschta & Ripple 2009), prevention of forest regeneration (Ripple & Larsen 2000), and declines in other habitat-dependent taxa such as birds, amphibians, reptiles and invertebrates (Berger et al. 2001; Ripple & Beschta 2006). The cascading damage following the loss of apex predators can be seen through multiple trophic guilds (Terborgh et al. 2001; Estes et al. 2011) and may potentially shift ecosystems to alternative stable states (Scheffer et al. 2001; Terborgh et al. 2010).. Eliminating the competition: effects on mesopredators Intraguild competition can have negative impacts on subordinate predators. This competition can take several forms, two of which are discussed in this thesis: . Exploitative competition occurs when predators compete for finite shared resources, and is stronger when dietary overlap is high (Schoener 1983). Exploitative. 2.
Figure


+7


Related documents
Passed time until complete analysis result was obtained with regard to 4 separate isolation and identification methods which are discussed under this study is as
The theoretical concerns that should be addressed so that the proposed inter-mated breeding program can be effectively used are as follows: (1) the minimum sam- ple size that
comparison of the shortest course AmBisome arm from step 1 meeting predefined minimum safety and efficacy standards with standard daily AmBisome dosing, the pri- mary objective is
We describe four important ways in which the evidence from randomised trials is limited or partial: the problem of applying results, the problem of bias in the conduct of
Note here the problem of the extension to the ultracold atomic collisions in quasi-2D geometry of confining traps [27] needed for resolving the “puzzle” of the 2D CIR [6],
So, concise content about major biomedical applications of nano fl uids in drug delivery systems, imaging, and antibacterial activities is presented in this paper.. For example,
Accordingly, a systematic review and meta-regression was undertaken to assess the effect of the RRS on hospital mortality and cardiopulmonary arrest outside the ICU and to evaluate
Not all polynomials are factorable, but the Rational Root Theorem can help you find all possible rational roots of a polynomial equation.... 3-5 Finding Real Roots of
