A Dissertation on
NEUTROPHIL TO LYMPHOCYTE RATIO AS A MARKER
OF ACUTE EXACERBATION AND DISEASE SEVERITY IN
CHRONIC OBSTRUCTIVE PULMONARY DISEASE
Dissertation Submitted to
THE TAMILNADU Dr.M.G.R. MEDICAL UNIVERSITY CHENNAI - 600 032
With partial fulfillment of the regulations
for the award of the degree of
M.D. GENERAL MEDICINE BRANCH-I
COIMBATORE MEDICAL COLLEGE, COIMBATORE
DECLARATION
I Solemnly declare that the dissertation titled “Neutrophil to lymphocyte ratio as a marker of acute exacerbation and disease severity in chronic obstructive pulmonary disease” was done by me from JULY 2016 to JUNE 2017 under the guidance and supervision of PROF. Dr S.USHA M.D.
This dissertation is submitted to The Tamilnadu Dr.M.G.R. Medical University towards the partial fulfilment of the requirement for the award of MD degree in General Medicine (Branch 1)
CERTIFICATE
Certified that this is the bonafide dissertation done by Dr. ANOOP PAULOSE and submitted in partial fulfillment of the requirements for the Degree of M.D.,General Medicine, Branch I of The Tamilnadu Dr. M.G.R. Medical University, Chennai.
Date: Guide, Professor Of
Department of Medicine
Date: Dean
CERTIFICATE – II
This is to certify that this dissertation work titled “Neutrophil to lymphocyte ratio as a marker of acute exacerbation and disease severity in chronic obstructive pulmonary disease” of the candidate DR. ANOOP PAULOSE with registration Number- 201511301 for the award of M.D in the branch of General Medicine I personally verified the urkund.com website for the purpose of plagiarism Check. I found that the uploaded thesis file contains from introduction to conclusion pages and result shows 1% (One percentage) percentage of plagiarism in the dissertation.
Guide & Supervisor sign with Seal. Place :
ACKNOWLEDGEMENT
I wish to express my sincere thanks to our respected Dean Dr. B.ASOKAN M.S., MCh, for having allowed me to conduct this study in our hospital.
I express my heartfelt thanks and deep gratitude to the Head of the Department of Medicine Prof. Dr. KUMAR NATARAJAN, MD for his generous help and guidance in the course of the study
I sincerely thank PROF. Dr.S. USHA.M.D, for the valuable help and cooperation and allowing me to use institutional facilities.
I am extremely grateful to Dr. S. KEERTHIVASAN M.D., for his valuable help and cooperation and allowing me to use institutional facilities
I am extremely grateful to HOD, Dr. LALITHA Department of Pathology, for their valuable help and cooperation and allowing me to use institutional facilities.
I thank all my PATIENTS, who formed the backbone of this study without whom this study would not have been possible.
Lastly, I am ever grateful to the ALMIGHTY GOD for always showering His blessings on me and my family
LIST OF ABBREVIATIONS USED
COPD - Chronic Obstructive Pulmonary Disease
NLR - Neutrophil Lymphocyte Ratio-
HRCT - High resolution computed tomography
BODE - Body Mass Index, Airflow Obstruction, Dyspnea and Exercise
FEV1 - Forced Expiratory Volume in One second
FVC - Forced Vital Capacity
WHO - World Health Organisation
GOLD - Global Initiative for Chronic Obstructive Lung Disease
MMRC - Modified Medical Research Council
BMI - Body Mass Index
6WMT - Six Minute Walk Distance
TABLE OF CONTENTS
SL.NO TITLES PAGE.NO
1 INTRODUCTION 1
2 OBJECTIVES OF STUDY 3
3 REVIEW OF LITERATURE 4
4 MATERIALS &METHODS 55
5 RESULTS 59
6 DISCUSSION 94
7 SUMMARY 98
8 CONCLUSION 99
9 BIBLIOGRAPHY 100
10 ANNEXURES
A1.PROFORMA 108
A2.CONSENT FORM 110
A3.KEY TO MASTER CHART 114
LIST OF TABLES
SI NO NAME OF THE TABLES PAGE NO
1 Age Distribution 59
2 Age Distribution Vs Mean Neutrophil Lymphocyte Ratio
60
3 Sex Distribution 61
4 Sex Distribution Vs Mean Neutrophil Lymphocyte Ratio
61
5 Duration Of Years Of COPD 62
6 Duration Of Illness Vs Mean Neutrophil Lymphocyte Ratio
62
7 Smoking Status Of Patients 63 8 Smoking Status Vs Mean Neutrophil Lymphocyte
Ratio
64
9 Exposure To Biomass Fuel 64
10 Biomass Fuel Exposure Vs Mean Neutrophil Lymphocyte Ratio
65
11 Environmental Exposure 66
12 Environmental Exposure Vs Mean Neutrophil Lymphocyte Ratio
67
13 Hypertension Patients 67
14 Hypertension Vs Mean Neutrophil Lymphocyte Ratio 68
16 Place Of Origin Of Patients Vs Mean Neutrophil Lymphocyte Ratio
70
17 MMRC Grading Of Dysponea Of Patients 70 18 MMRC Grading Vs Mean Neutrophil Lymphocyte
Ratio
71
19 FEV1 Of Patients 72
20 FEV1 Vs Mean Neutrophil Lymphocyte Ratio 73
21 GOLD Grading Of COPD 73
22 GOLD Grading Vs Mean Neutrophil Lymphocyte Ratio
74
23 Body Mass Indices Of Patients 75 24 Body Mass Indices Vs Mean Neutrophil Lymphocyte
Ratio
76
25 Six Minute Walk Distance. 76 26 Minute Walk Distance Vs Mean Neutrophil
Lymphocyte Ratio
77
27 BODE Index Of Patients 78
28 BODE Index Vs Mean Neutrophil Lymphocyte Ratio 79 29 Number Of Patients With PAH 80 30 PAH Vs Mean Neutrophil Lymphocyte Ratio 81 31 Number Of Patients With Fever 82 32 Fever Vs Mean Neutrophil Lymphocyte Ratio 82
34 Number Of Patients Having Crepitation’s 84 35 Crepitation’s Vs Mean Neutrophil Lymphocyte Ratio 84 36 Number Of Patients Having Wheezing 85 37 Wheezing Vs Mean Neutrophil Lymphocyte Ratio 86 38 Number Of Patients Having Cyanosis 86 39 Cyanosis Vs Mean Neutrophil Lymphocyte Ratio 87 40 Number Of Patients Having Clubbing 88 41 Clubbing Vs Mean Neutrophil Lymphocyte Ratio 89 42 Number Of Patients With Pedal Edema 89 43 Pedal Edema Vs Mean neutrophil Lymphocyte Ratio 90 44 Chest X Ray Findings Of Patients 91 45 Chet X Ray Vs Mean Neutrophil Lymphocyte Ratio 92
46 CT Findings Of Patients 93
LIST OF CHARTS
SL NO
NAME OF CHARTS PAGE NO
1 Age Distribution 59
2 Age Distribution Vs Mean Neutrophil Lymphocyte Ratio
60
3 Sex Distribution 61
4 Duration Of Years Of COPD 62 5 Duration Of Years Vs Mean Neutrophil
Lymphocyte Ratio
63
6 Smoking Status Of Patients 63 7 Smoking Status Vs Mean Neutrophil Lymphocyte
Ratio
64
8 Exposure To Biomass Fuel 65 9 Biomass Fuel Exposure Vs Mean Neutrophil
Lymphocyte Ratio
66
10 Environmental Exposure 66
11 Environmental Exposure Vs Mean Neutrophil Lymphocyte Ratio
67
12 Hypertension Patients 68
13 Hypertension Vs Mean Neutrophil Lymphocyte Ratio
69
15 Place Of Origin Of Patients Vs Mean Neutrophil Lymphocyte Ratio
70
16 MMRC Grading Of Dysponea Of Patients 71 17 MMRC Grading Vs Mean Neutrophil Lymphocyte
Ratio
72
18 FEV1 Of Patients 72
19 FEV1 Vs Mean Neutrophil Lymphocyte Ratio 73
20 GOLD Grading Of COPD 74
21 GOLD Grading Vs Mean Neutrophil Lymphocyte Ratio
75
22 Body Mass Indices Of Patients 75 23 Body Mass Indices Vs Mean Neutrophil
Lymphocyte Ratio
76
24 Six Minute Walk Distance 77 25 6 Minute Walk Distance Vs Mean Neutrophil
Lymphocyte Ratio
78
26 BODE Index Of Patients 79
27 BODE Index Vs Mean Neutrophil Lymphocyte Ratio
80
33 Number Of Patients Having Crepitation’s 84 34 Crepitation’s Vs Mean Neutrophil Lymphocyte
Ratio
85
35 Number Of Patients Having Wheezing 85 36 Wheezing Vs Mean Neutrophil Lymphocyte Ratio 86 37 Number Of Patients Having Cyanosis 87 38 Cyanosis Vs Mean Neutrophil Lymphocyte Ratio 88 39 Number Of Patients Having Clubbing 88 40 Clubbing Vs Mean Neutrophil Lymphocyte Ratio 89 41 Number Of Patients With Pedal Edema 90 42 Pedal Edema Vs Mean Neutrophil Lymphocyte
Ratio
91
43 Chest X Ray Findings Of Patients 91 44 Chet X Ray Vs Mean Neutrophil Lymphocyte
Ratio
92
LIST OF FIGURES
SL.NO NAME OF FIGURES PAGE.NO
1 Theophile Bonet 4
2 Charles Badham 4
3 Rene Laennec with stethoscope 5 4 Hutchinson and his Water Spirometer 5 5 Formation of the Lower part of Respiratory
System
8
6 Conducting and Respiratory units of lung 11 7 Broncho pulmonary Segments 12
8 Pulmonary Circulation 14
9 Lymphatic drainage of Lungs 15 10 Volumes of Lung and Capacities-Normal
Spirogram
16
11 Genetics of alpha 1 antitrypsin deficiency 27 12 Pathogenesis of alpha 1 antitrypsin deficiency 28
13 GOLD staging of COPD 29
14 Inflammatory pathways in COPD pathogenesis 30
15 Pathogenic mechanism in COPD 32
16 Reid index in Chronic bronchitis 33
17 Clinical features of COPD 34
20 Systemic Manifestations of COPD 38
21 Factors Causing Exacerbations 39
22 COPD Patient Staging Assessment Tool 39
23 Pulmonary Function Test 40
24 Dynamic Flow Volume Loops 41
25 BODE Index 41
26 Chest X Ray 42
27 Smoking Cessation Nicotine Replacement Therapy
46
28 FEV1 prediction with smoking cessation 46 29 Pulmonary Rehabilitation Therapy 47 30 Gold Strategy in treating COPD 49 31 Treatment Options in COPD 49
1
INTRODUCTION
Chronic obstructive pulmonary disease is regarded as the most important public health problem that affect our part of the world. It is the fourth leading cause of mortality in the world, and by 2020 will become the next cause next to ischemic heart disease and stroke as per WHO. COPD mostly affecting males, who are mainly smokers and characterized by limitation of airflow which is not fully transformable to normal, along with increased long term inflammatory response in airways of the tracts of lungs, being viral and bacterial pathogens as the prime cause of exacerbations. Macrophage and cells lining the mucous membrane activation which produce proteinases and chemokines which attract other inflammatory and immune cells, interleukin 8 (IL8), and TNF alpha are released in turn cause attraction of neutrophils to the site are the main reasons of inflammation that is occurring in COPD.
2
regarded as a set of interactions between and among immune related cells such as lymphocytes, neutrophils which in turn lead to killing of tissues and destruction which is going on in COPD. One of the inflammatory markers in COPD is NLR and also has its relationship between many disease like, cardiovascular disease, kidney disease, etc.
3
OBJECTIVES OF THE STUDY
To identify the possible correlation between neutrophil to lymphocyte ratio and severity of COPD.
To identify correlation between NLR with pulmonary function test(FEV1) in COPD patients.
4
REVIEW OF LITERATURE
HISTORY – COPD
COPD was first described by the famous Swiss physician Theophile Bonet back in 1600, In autopsied patients he described about emphysema.
British born Charles Badham was the first one to use the word
“bronchitis” for inflammatory changes of epithelium.
Fig-1-Theophile Bonet Fig-2 – Charles Badham
5
Fig-3- Rene Laennec with stethoscope
John Hutchinson is the pioneer in invention of spirometer in 1846.
Fig-4- Hutchinson and his Water Spirometer
6
In 1959, at a symposium of doctors named a Ciba Guest meeting of doctors and health professional’s they made definition of component’s which constitute COPD.
The term FEV1 was first considered to find out expiratory flow in
1960.
Gaensler who was inspired by Tiffeneau’s work added forced vital capacity, become the core of spirometry-FEV1 and FEV1/FVC we use presently.
Dr. William Briscoe -now considered as the one who used the
word COPD in 1965.
Osler’s textbook of medicine in early 1900 describes about
emphysema.
EMBRYOLOGICAL FORMATION OF RESPIRATORY SYSTEM Following fertilization of ova and sperm, the GROWTH of human body can be staged into two divisions
1. embryonic period-includes the first 8weeks, where all major organs start to develop
7 Germinal layers
● ENDODERM
● MESODERM
● ECTODERM
From these three germinal layers all tissues in the body are developed.
Visceral pleura which is covering the external surface of lung develops from the mesoderm while, parietal pleura which is in proximity with the body cavity develops from somatic mesoderm. The cavity is the area in between parietal and visceral pleura.
Weeks 4–7
8
that protrudes from the foregut. The foregut is formed from endoderm lying just inferior part of the pharyngeal pouches. The laryngotracheal bud is an extension which originates from the lung bud. The part of laryngotracheal bud which is in proximity with the pharynx transforms to the trachea, while those which lie at terminal part transforms into bulbous, transforming into bronchial buds. A bronchial bud then forms all other lower respiratory tissues and the bronchi.
Fig No-5-Formation of the Lower part of Respiratory System.
Weeks 7–16
9
respiratory bronchioles are developed. All the major structures of the lung are formed by this stage.
Weeks 16–24
After the respiratory bronchioles development occurs, extensive vascularization, as along with the emergence of alveolar ducts and precursors of alveolar cells happens. Then cells which cover respiratory structures starts to transform into two types of cells type I along with type II pneumocytes. After the complete development of type II cells, they begin their function of secretion of the substance called pulmonary surfactant which is the reason and prime factor for lowering surface tension in lugs. At about 20th week of gestation breathing movements of fetus begins to occur.
From Weeks 24 till term of pregnancy
10 ANATOMY
Respiratory system consists of 1. upper respiratory tract 2. lower respiratory tract
UPPER RESPIRATORY PATHWAY
Components include the following- nasal cavity, pharynx, para nasal sinus and larynx.
Functions of upper airway tract are 1. Act as a conduct for air flow
2. Filtering, heating, conditioning of air, protection of airways, phonation, coughing olfaction and taste, also muscle action helps in swallowing.
LOWER RESPIRATORY PATHWAY Trachea
Trachea also called as windpipe which is about 5 inch tube formed by C shaped rings consisting of hyaline cartilage starts from cricoid cartilage and then divides into two at level corresponding to angle of louis in superior mediastinum and is covered by pseudo stratified ciliated
11
protect the air passage from collapsing. Trachea bifurcates at carina to form the left side main bronchus which is about5cm long and right side
bronchus 1– 2.8 cm long. The right bronchus is more in diameter, with small length and almost placed vertically compared to the left. So right lung is the most common site of aspiration rig. Both the two bronchi then pass to the lungs before branching into smaller sized secondary and then to tertiary bronchi. Further secondary bronchi splits into tertiary which
again divide into millions of minute terminal bronchioles.
The zone which conducts air of respiratory tract is up-to 16th division, followed by respiratory zone up-to 23rd division of respiratory tract.
12
BRONCHOPULOMONARY SEGMENTS
13 ALVEOLI
The terminal respiratory unit.
Six hundred million alveoli are occurring in the lungs. Its epithelium consists of 2 types of cells.
Type 1 cells – lining cells- these are flat cells, which are squamous epithelial cells and form over 95% of surface of alveoli.
Type II cells- Pneumocytes whose main function is to secrete surfactant; whose main function is to reduce surface tension inside the alveoli
also these cells act as reserve cells which can transform to type I pneumocytes when required.
PULMONARY CIRCULATION
14
passes to the left ventricle and to aorta and major arteries of the body thereby oxygenating the body.
The lungs therefore have dual blood supply-
1. Bronchial arteries which give oxygenated blood 2. Venous blood from pulmonary arteries.
In lungs some mixing of blood occurs, so that if one side of circulation gets blocked, blood supply to pulmonary parenchyma is supplied by the other vessel. Bronchial arteries then divide to capillaries, and then they empty into bronchial vein and then to azygos vein.
1
15 LYMPHATIC SYSTEM
Lymphatic’s in the respiratory system grossly divided in to
1. SUPERFICIAL PLEXUS
2. DEEP PLEXUS
Superficial plexus mainly drain from the viscera covering pleura, while deep plexus from peri -bronchial tissues.
Alveoli lack lymphatic drainage.
Lymphatic’s flow towards hilum and further to the extra pulmonary lymph nodes, which empty’s lymph into the thoracic duct.
16 PHYSIOLOGY
Fig no: 10 - Volumes of Lung and Capacities-Normal Spirogram
Lung volumes
1) Tidal volume: The quantity of air inhaled in or out at a normal resting respiratory cycle (500-750 ml).
2) Inspiratory reserve volume: This is the quantity of air which can be taken in by a persons maximal effort of inspiration, at the end of a normal inspiration (2 liters).
17
4) Residual volume: The quantity of air which is left in lungs after the end of a maximal expiration (value -1.3litres).
Lung Capacities
5) Vital capacity: Quantity of air expelled by maximum expiration after a deep inspiration, called index of lung function (3.5 liters).
6) Inspiratory capacity: It is the maximum air inspired after the end-expiratory level (IRV+ TV) (2.5 liters).
7) Functional residual capacity: The volume of air which remains in the lungs at the end point of normal expiration (RV+ ERV). (Value -2.5 liters).
8) Total lung capacity: It consists sum total of Tidal volume, plus Residual volume plus Inspiratory reserve volume, plus expiratory reserve volume (Value - about 5litres).
Spirogram is the modality which helps in measuring the following things
18
2. FVC (Forced vital capacity): maximum quantity of gas an individual can breathe out forcefully.
3. FEV1/FVC: It is a ratio. FEV1 expressed as how much part of the FVC.
CHRONIC OBSTRUCTIVE PULMONARY DISEASE (COPD)
DEFINITION
Chronic obstructive pulmonary disease (COPD): A preventable and treatable disease which consists of constant expiratory limitation of the flow of air which is not fully reversible. A progressive disease, which comprises of enhanced and chronic inflammatory response to gases and noxious materials of the mucosa of respiratory tract.
Detection of COPD is thought in a patient coming with symptoms of cough, excessive production of sputum, or dysponea, and or exposure to factors which causing the disease will be present.
19
that is due to airway and/or alveolar abnormalities usually caused by significant exposure to gases or noxious particles”.
COPD consists of two different types of clinical entities
1. CHRONIC BRONCHITIS
2. EMPHYSEMA.
They can also occur together.
Bronchitis is defined as occurrence of cough along with expectoration on most days for at least three months in at least
two consecutive years and no identifiable cause detected.
Bronchitis means the airways are inflamed and narrowed
Emphysema as the word indicates defined as abnormal permanent dilatation of alveoli occurring distal to the terminal
bronchioles which is associated with wall destruction and without
much fibrosis.
So Emphysema affects the air sacs.
Thus, chronic bronchitis definition is on the basis of clinical features,
20
As airways are narrowed, the movement of air become harder as it moves
in and moves out during breathing, and so lungs are not that much able to
acquire oxygen and exchange carbon dioxide from the lungs. In a healthy
lung, the tissue which lies in between stretches back so as to keep airways
open during normal respiration. In COPD patients, the airways get
narrowed because of the following reasons:
Less retraction force on the airways as the lung tissues are
damaged.
Lining of the airways which are naturally elastic wont function.
Lining of airway is inflamed
CHRONIC BRONCHITIS
Types:
1) Simple chronic bronchitis- is a entity with sputum production mainly mucoid in nature
21
3) Chronic asthmatic bronchitis/ chronic bronchitis associated with obstruction- severe dysponea and wheezing associated with inhaled
irritants or infections in the setting of bronchitis.
EMPHYSEMA
Emphysema is a disease which occurs when cigarette smoke or other
air pollutants, including dust fumes etc, destruct the inter alveolar walls.
When the alveoli weaken, their walls get ruptures, creating single air sacs
instead of multiple ones which decrease the exchange of oxygen with
carbon dioxide.
CLASSIFICATION
A. TRUE EMPHYSEMA
1) Centriacinar- Destruction which occurs in the proximal or central part of respiratory unit(acinus) resulting in its enlargement. Upper lobe and apices predominantly involved. Common in male who smokes.
22
3) Paraseptal- Only the distal acinus is involved. It is seen near pleura which often leads to spontaneous pneumothorax.
4) Irregular(para-cicatrical)- Any type of involvement can occur.
5) Mixed(unclassified) type emphysema
B. OVER INFLATION.
Histologically, the alveoli are dilated and distended or
overinflated but septal walls are preserved.
1) Compensatory over inflation (compensatory emphysema)
Compensatory emphysema is a condition in which one part of the lung
will increase in size and function, when another part of the lung may be
destroyed or functionless. It is seen in clinical conditions such as
pneumonias, destroyed lung, large pleural effusions and in
pneumothorax. Here, histologic examination shows dilatation and
distention of alveolar sac but septal walls are preserved. So in them the
term compensatory over inflation is accurate over compensatory
emphysema.
23
In old age, the lungs become voluminous because of loss of elastic
tissue, thinning and atrophy of ducts of the alveoli along with atrophy of
alveoli occurs.
3) Obstructive over inflation (Infantile lobar emphysema)
It is yet another variant of obstructive over inflation occurring in infants
in the initial days when a neonate is born who develop respiratory
distress or who have congenital hypoplasia of bronchial cartilage. Partial
obstruction of respiratory tract mainly in part of bronchial tree (tumor or
foreign body) causes over distention of the region supplied by
obstructed bronchus. So air enters the while inspiration into the lungs
but cannot leave on expiration resulting in ballooning up of the
affected areas.
4) Unilateral translucent lung (Unilateral emphysema)
One lung or one of the lobes or segments become radiolucent. The
condition occurs in adults. Usually we can elicit a history of serious
pulmonary infection in childhood.
24
Mediastinal emphysema occurs due to rapid outward release of air
into mediastinum following rupture of alveoli. The escaped air leaks
into the subcutaneous tissues causing surgical emphysema
Cigarette smoking is considered as one of the important reason
which results in COPD according to WHO, the smoke originating from
the cigarette consists of many different free radicals along with other
oxidant substances, these will cause inflammation in the lining
epitheliums of airway tracts and also in the parenchyma of the lung
tissue, along with surplus production of mucous decreases the air flow to
lungs resulting in COPDs pathological and clinical features. Smoking
will reduce the flow rates and decreases the pulmonary function.
Smoking cessation is the most important and the effective
treatment of COPD, it decreases the rapidity of development of
pulmonary deterioration.
CAUSES OF COPD
Environmental factors
25
• Indoor air pollution; cooking by using the biomass fuels in confined areas happens in developing countries especially in females of our part of world.
• Occupational exposures, such as coal dust, silica, Cadmium, ammonia
• Reduced birth weight may reduce lung function
• Lung growth: Smoking by mother and infections during childhood period affect growth of lung, leading to decreased lung function
• Infections: recurrent infection may cause decline in FEV1; occurrence of adenovirus in mucosa and lung tissue can cause alteration in local inflammatory response; HIV infection may sometimes associated with the occurrence of emphysema
• Low socioeconomic status
• Cannabis smoking
Host factors
• Genetic factors: α1-antiproteinase deficiency, COPD susceptibility genes
26
Risk factors for the development of COPD
EXPOSURE TO TOBACCO SMOKE. Significant and the most
important risk factor in the development of COPD is long-term use
of cigarette.
Other variety of tobacco exposure includes – Pipe smokers, chewing
tobacco, cigars, electronic cigarettes, marijuana smokers etc.
PEOPLE WITH ASTHMA WHO SMOKE. In them the severity
of disease will be even more because of the combined effect.
OCCUPATIONAL EXPOSURE TOCHEMICALS AND
DUSTS. The irritation of lung along with progression to COPD can
happen in people who are exposed to long term chemical fumes,
volatile substance, dusts and vapors.
BIO-MASS FUEL AND ITS EFFECTS ON LUNGS. In mainly
developing part of the world, those who inhale the fumes of burning
of bio mass fuels for purposes like cooking are more susceptible to
develop COPD, and mainly occurs in females as they are more
exposed to the same.
AGE. COPD develops gradually and progress. So most of the
27
GENETICS- ALPHA-1 ANTITRYPSIN DEFICIENCY
Normally in people there will be adequate amount of alpha 1
antitrypsin and in some COPD patients accounting about 1 percent, low
level of the enzyme is noted because of genetic alterations.
Alpha-1-antitrypsin (AAt) is an enzyme which inhibits the serine protease
inhibitor and thus by inhibiting neutrophil elastase. The neutrophil
elastase is made in the liver and released to blood for its action in the
lungs, thus the enzyme deficiency affects two major organs both the liver
and the lungs. Individuals with deficient alpha 1 antitrypsin cause
emphysema in there third to fourth decades of life.
Fig No: 11- Genetics of alpha 1 antitrypsin deficiency
Protease-ant protease hypothesis. Alpha-1-antitrypsin (α1-AT), also
28
normal constituent in the α 1-globulin part of the plasma proteins on
serum electrophoresis. The single gene locus that codes for α -1-AT is
whose locus is on chromosome 15th long arm. The normal function of α
1-AT is to inhibit proteases and hence its name α 1-protease inhibitor.
The proteases (mainly elastases) are derived from neutrophils. Neutrophil
elastase normally in lung tissue is prevented from eating the lung
parenchyma because of the anti-elastase activity of the enzyme. So any
alterations in the system can results in the pathology occurring in
emphysema-By decreased anti-elastase activity i.e. deficiency of α -1
antitrypsin. -By increased activity of elastase i.e. increased neutrophilic
activation and also lung infiltration producing more neutrophil elastase.
29
Spirometry – severity of COPD classified on basis of post-bronchodilator FEV1
Fig No: 13- GOLD staging of COPD
*Lung function should not be the only mandatory thing in diagnosing a patient with mild COPD.
PATHOGENESIS
COPD in most of the patients have simultaneous pulmonary
emphysema and chronic bronchitis. Chronic bronchitis does not always
lead to emphysema nor all cases of emphysema have the morphological
alterations of chronic bronchitis. The relationship that happens in two
30
importantly tobacco smoke and air pollutants. Occupational exposure,
infection and familial and genetic influences are other less significant
contributory factors. However, the main pathology that result in
emphysema, is the walls of alveoli get destructed, and is not linked to
bronchial changes but is closely related to deficiency of serum
alpha-1-antitrypsin, termed protease-anti protease hypothesis.
31
Factors contributing in COPD pathogenesis are:
1) Inflammation
Chronic inflammation is the specific feature occurring in COPD
which is characterized by inflammation in the airways, parenchyma of
the lungs, and vascular structures of the lung. Increased neutrophils,
Macrophages, CD8+ T-lymphocytes occur in the lung. The
inflammatory mediators- leukotriene B4 (LTB4), interleukin 8 (IL-8),
tumor necrosis factor alpha are released by the activated cells which
can damage lung structures.
2) Proteinases and anti proteinases imbalancecauses destruction in walls
of alveoli causing emphysema. In alpha 1 anti trypsin low patients (a
major protease inhibitor), emphysema develops at a younger age
especially in smokers.
Smoking will result in emphysema as a result of increased elastolytic
protease in the lungs. These are as under:
Oxidant in cigarette smoke will cause inhibition of α
32
Smokers lungs are rich with neutrophils and phagocytes than
the non smoker population; thus they have very high elastase
activity.
3) Oxidative stress : Impaction of smoke particles in bronchioles causes
inflammatory cell aggregation, increased elastase and decreased
alpha 1 antitrypsin resulting in centriacinar emphysema in
smokers.
33
Chronic bronchitis
MORPHOLOGIC FEATURES.
Gross: the walls of the bronchi will have increased thickness, hyperemic
and edematous. Inside the lumen of bronchi and bronchioles mucus plugs
and purulent exudate are present.
Microscopy: Reid index is used for the histological definition. Reid
index is the ratio between width of the sub mucosal mucus producing
glands (i.e. hypertrophy and hyperplasia) in the cartilage-containing large
airways to that of the total bronchial wall.
normal chronic bronchitis
34
Emphysema
Grossly: Voluminous lungs with, pale little blood. The edges are
rounded. Enlargement of air spaces is seen in mild cases. Bullae and
blebs are seen from the surface of lungs in progressed cases. The bullae
(1 cm or more in diameter) are formed by the rupture of adjacent air
spaces while blebs are formed by rupture of alveoli into the sub pleural
space resulting in spontaneous pneumothorax.
Microscopy: Based on the different types of emphysema already
mentioned, either respiratory bronchioles or alveolar ducts or alveolar
sacs are dilated. Fibrosis are not found in bullae and blebs.
CLINICAL FEATURES OF COPD
Fig No: 17- Clinical features of COPD
The typical finding that occur in COPD patients are limitation in
the expiratory flow which can’t be fully reversed. The main symptoms
35
sputum production. It is usually seen that the symptoms will have a
prolonged course and incremental over a tome period.
Cough
Cough and sputum production are usually the first symptoms, often
termed as ‘smoker’s cough’. Usually the first symptom the patient will
be telling is cough. Hemoptysis may be a complication of COPD but
usually will not occur.
Shortness of breath
COPD expiratory airflow obstruction is typically not
reversible. Typically the difficulty in breathing is more on exertion of a
prolonged duration and increases over time.] In the advanced stages, even
at rest be always present. Breathlessness results in anxiety and decreases
COPD patients quality of life and makes the patient seek healthcare. The
severity should be quantified by documenting the level exertion the
patient can manage before stopping. Modified MRC dysponea scale is
36
Fig No: 18-Modified MRC Dysponea Scale
Core pulmonale was classically described as-“hypertrophy of right
ventricle from pathology affecting function or lung structure”. Pulmonary
hypertension is the underling pathological mechanism in hypertrophy of
right ventricle in cor pulmonale.
37 Other features
In COPD, patient will be having more difficulty in exhaling out the
air compared to inspiring. When obstruction or narrowing of air pathways
associated with COPD is present, there will be musical quality sound
called wheezing. Barrel shaped chest is typically described in advanced
cases of COPD.
In more progressed cases of COPD, the pressure will be reflected
back on the heart which will produce strain of right ventricle, and the
same pressure is transmitted as raised jugular venous pulse. Usually
clubbing is not a significant finding in COPD, but if a patient has
clubbing underling malignancy should be ruled out.
COPD often associated with lot of systemic manifestations like
metabolic disorders which includes diabetes mellitus, hypertension,
obesity ,obstructive lung disorders, skeletal muscle wasting ,depression
38
Fig No: 20- Systemic Manifestations of COPD
EXACERBATION
Acute exacerbations of COPD is the condition where there will be
increased in breathlessness or increase in production of sputum or
increase in cough and a change in color of the sputum produced. The
patient who have acute exacerbations shows signs of more difficulty in
breathing such as fast breathing, a fast heart rate, sweating or active use
of muscles in neck and other accessory muscles, may be associated with
bluish coloration of the skin along with mucosa. Patient may have
39
Fig No: 21- Factors Causing Exacerbations
40 INVESTIGATIONS
1) Pulmonary function testing
The diagnosis of COPD is confirmed by spirometry. It helps in diagnosing the same and also help to know the severity of the disease.
Fig No: 23- Pulmonary Function Test
41
Fig No: 24-Dynamic Flow Volume Loops
PROGNOSIS
42
By the help of BODE index we can tell the prognosis of COPD patients, their 4 year survival percentage and its components include exercise capacity, body mass index, dyspnea on MMRC scale and what distance the patient can walk by 6 minute’s. It is a good prognostic grading and predict death and early hospitalization.
2) Chest X- ray
A plain Chest X-Ray posterio-anterior view and lateral view are done
Fig No: 26-Chest X Ray
Emphysema can be diagnosed in chest X-Ray if there is two out of five criteria
43
2. Hyper-lucency of lung fields in X ray
3. Flat and low diaphragm on lateral view
4. Flat and low diaphragm on PA view
5. Clear walled lesions or Bullae seen.
3) Blood count
A blood count is useful to find out polycythemia or anemia in patients.
4) ABG and pulse oximetry
Arterial blood gas analysis helps to find out the hypoxemic status of the blood.
Pulse oximetry is a simple and bed side investigation which help to find out the oxygen saturation and help to intervene the patient as early as possible.
5) α1-antiproteinase
the enzyme deficiency is investigated usually in young patients predominantly present as emphysema.
44
These tests are not routinely done help to asses the hyper inflation and body pletismography will help to find out volumes especially in COPD patients having bullae.
7) Exercise tests
Exercise tests help to find out the exercise tolerance of the patients and also help to judge the patients responding to rehabilitation therapy.
8) HRCT
45 MANAGEMENT
TREATMENT GOALS OF A COPD PATIENT
NON – PHARMACOLOGICAL METHODS
SMOKING CESSATION
LONG TERM OXYGEN THERAPY
PULMONARY REHABILITATION
NON INVASIVE VENTILATION
SURGERY
46
Fig No: 27- Smoking Cessation Nicotine Replacement Therapy
Fig No:28- FEV1 prediction with smoking cessation
OXYGEN THERAPY
47 INDICATIONS
Continuous use of oxygen Intermittent use of oxygen Resting Pao2 ≤ 55 mm Hg
Resting Pao2 of 56-59 mm Hg with any one of the following
Edema suggestive of CCF
P pulmonale in ECG increased RBC (hematocrit, > 56%)
desaturation with exercise<88% desaturation at night <88%
PULMONARY REHABILITATION THERAPY
Fig No: 29- Pulmonary Rehabilitation Therapy
NON INVASIVE VENTILATION
48 VACCINATION STRATEGIES
Influence and pneumococcal vaccinations are given especially who have recurrent exacerbations in order to decrease the number of exacerbations.
SURGERIES
1) Bullectomy- large bullae excised to prevent airflow limitation
2) Lung volume reduction surgery (LVRS)-upper lobe emphysema, with preserved gas transfer and no evidence of pulmonary hypertension, may benefit
3) Lung transplantation
49
PHARMACOLOGICAL MANAGEMENT
Fig No: 30- Gold Strategy in treating COPD
50
Mild COPD: Add short acting β2-agonists Fenoterol / Salbutamol / Terbutaline.
Moderate COPD: Add one or more long acting bronchodilators such as Formterol/ Salmeterol and if needed add either short acting( Ipratropium bromide/ Oxitropium bromide) or long acting (Tiotropium) anticholinergics.
Severe COPD: Add inhaled steroids (Budesonide / Fluticasone/ Triamcinolone and if the response is not satisfactory, systemic steroids( Prednisone/ Methyl-prednisolone).
NEUTROPHIL LYMPHOCYTE RATIO(NLR)
51 Normal differential leucocyte count Neutrophils 40-75%
Basophils <1-2% Eosinophils 2-6% Lymphocytes 20-40% Monocytes 2-8%
52
treatment with various therapies. The usefulness of NLR as an inflammatory marker can compared to other routinely used inflammatory markers like C-reactive protein interleukin-1, tumor necrosis factor-α, ESR etc.
Recently, it has been found that the use of NLR in various cancer prognostication including breast cancer, esophageal cancer, pancreatic cancer, colorectal cancers an elevated preoperative or pretreatment NLR, calculated from peripheral blood tests, was identified as an independent and readily available prognostic biomarker related to poor survival in numerous cancers, including colorectal cancer, breast cancer, gastric cancer and esophageal cancer, renal cell carcinomas and various study’s are undergoing in evaluating the same as inflammation is a basic pathogenesis happening in all cancers and in those states the NLR values are altered.
NLR is a tool which helps to find out the severity of disease and also the activity status of the disease in COPD patients.
Significance of NLR:
53
(2) COPD exacerbations can be predicted with NLR, and if NLR is more in routinely followed patients we can say the chances of future exacerbations are more.
(3) The severity of the exacerbation state can be said by the NLR value with out the help of spirometry.
(4) NLR can also predict the prognosis of the COPD patient by comparing it with the BODE index.
In COPD there will be continuous inflammatory process happening in the airways and also in the lung tissues. Now a days COPD is thought to be a systemic inflammatory disease, as result of that the levels of inflammatory markers which are in blood will be high compared to normal subjects. It has been found out that even in normal states in COPD patients the inflammatory marker levels will be high than in healthy subjects, and higher the markers higher the chances that patient can get future exacerbations.
54
WBC counts in their blood picture and there raised value is a predictor of mortality. Elevated WBC and neutrophil counts were independently and significantly associated with mortality. Lymphopenia is also associate with poor prognosis and out come especially in acute infectious states like sepsis or bacteremia in COPD patients. So there comes the role of NLR which consists of both the things in which increased neutrophil count indicates activity of inflammation and decreased lymphocyte count shows poor general condition and the incompetence of immune system. So combing the factors NLR and the spirometry especially FEV1 helps to predict the future exacerbations of COPD and also with rise in NLR values the exercise capacity of the patient decreases. So everything adds to the fact that NLR reflects the severity and helps to monitor the same.
55
MATERIALS AND METHODS
Source of Study
The study is conducted on patients attending Coimbatore Medical College Hospital, Coimbatore during the study period (July 2016 to June 2017). A sum total of 100 patients with Chronic Obstructive Pulmonary Disease attending Coimbatore Medical College Hospital was included in the study, based on the inclusion and exclusion criteria. The study is done after getting informed signed consent from the patients participated in the same. Duration of study was one year.
Design of Study- Cross Sectional Study
Methods of Collection of Data
Sample Size-100 patients
Sampling Method: Random sampling
56
onset or worsening of more than two respiratory symptoms (ie, dyspnea, cough or wheeze, sputum amount or purulence) for two or more consecutive days.
Inclusion criteria
Stable diagnosed COPD patients of age 40 years or older who were current or ex smokers based on clinical history and examination attending Coimbatore Medical College Hospital.
Exclusion criteria
age < 40 years
Patients with and diagnosed as Bronchial Asthma, Bronchiectasis or Bullous lung disorders.
Patients with active pulmonary tuberculosis.
Patients with malignancy.
Patients with hepatic disease, renal disease, myocardial infaction.
Patients with any other acute or chronic infections.
Patients with pneumonia.
57
Patients with Diabetes Mellitus.
Patients receiving systemic corticosteroids, antibiotics.
Patients receiving immunosuppressive treatment.
Methods of study:
Data is collected using pretest proformas according to the objectives of the study. After getting informed signed consent detailed history and examination were done in 100 patients included in the study. The aim and purpose of study was was informed to the patients and there informed consent obtained.
Those patients who satisfied all the inclusion and exclusion criteria were selected for the study
INVESTIGATIONS
1.ROUTINE COMPLETE BLOOD COUNT
58 2.BLOOD BIOCHEMISTRY
Random blood sugar Blood urea
Serum creatinine
Serum electrolytes: Sodium, Potassium
3.ECG
4.IMAGING STUDIES
CT Chest
Chest X ray PA view
5.PULMONARY FUNCTION TEST
6.sputum AFB, sputum culture and sensitivity (if needed)
STATISTCAL METHODS
59
RESULTS
TABLE NO: 1: AGE DISTRIBUTION
AGE IN YEARS NO OF PATIENTS PERCENTAGE
< 50 9 9%
51-60 31 31%
61-70 48 48%
>70 12 12%
CHART NO: 1- AGE DISTRIBUTION
9
31
48
12
AGE DISTRIBUTION
60
TABLE NO: 2: AGE DISTRIBUTION VS MEAN NEUTROPHIL LYMPHOCYTE RATIO
AGE IN YEARS NEUTROPHIL LYMPHOCYTE RATIO
MEAN SD
< 50 4.08 1.34
51-60 3.87 1.79
61-70 3.7 1.47
>70 4.15 1.44
P VALUE - 0.784 NON SIGNIFICANT
ANOVA
CHART NO: 2: AGE DISTRIBUTION VS MEAN NEUTROPHIL LYMPHOCYTE RATIO 4.08 3.87 3.7 4.15 3.4 3.5 3.6 3.7 3.8 3.9 4 4.1 4.2
< 50 51-60 61-70 >70
61
TABLE NO: 3: SEX DISTRIBUTION
SEX NO OF PATIENTS PERCENTAGE
MALE 91 91%
FEMALE 9 9%
CHART NO: 3: SEX DISTRIBUTION
TABLE NO: 4- SEX DISTRIBUTION VS MEAN NEUTROPHIL LYMPHOCYTE RATIO
SEX
NEUTROPHIL LYMPHOCYTE RATIO
MEAN SD
MALE 3.83 1.55
FEMALE 3.87 1.65
P VALUE - 0.922 NON SIGNIFICANT
UNPAIRED T TEST
91 9
62
TABLE NO: 5-DURATION OF YEARS OF COPD
DURATION NO OF PATIENTS PERCENTAGE
< 5 YEARS 30 30%
5-10 YEARS 24 24%
> 10 YEARS 46 46%
CHART NO: 4-DURATION OF YEARS OF COPD
TABLE NO:6- DURATION OF ILLNESS VS MEAN NEUTROPHIL LYMPHOCYTE RATIO
DURATION NEUTROPHIL LYMPHOCYTE RATIO
MEAN SD
< 5 YEARS 2.78 1.47
5-10 YEARS 3.99 1.48
> 10 YEARS 4.45 1.28
P VALUE - 0.001 SIGNIFICANT
ANOVA
30
24 46
DURATION
63
CHART NO:5-DURATION OF YEARS VS MEAN NLR
TABLE NO:7-SMOKING STATUS OF PATIENTS
SMOKING NO OF
PATIENTS PERCENTAGE
YES 68 68%
NO 32 32%
CHART NO:6-SMOKING STATUS OF PATIENTS 2.78
3.99
4.45
0 0.5 1 1.5 2 2.5 3 3.5 4 4.5 5
< 5 YEARS 5-10 YEARS > 10 YEARS
MEAN NLR
68% 32%
SMOKING
YES
64
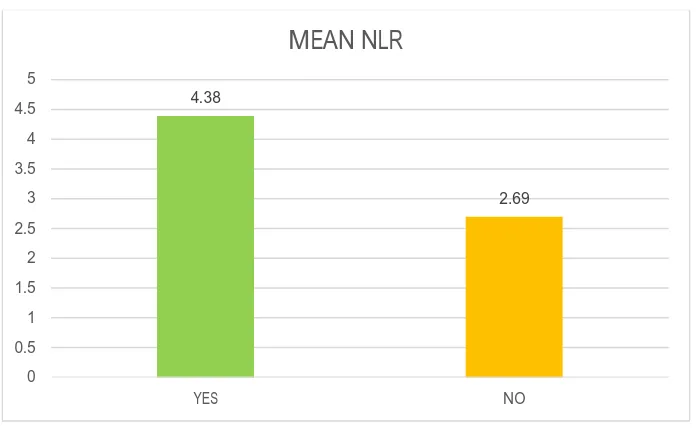
TABLE NO:8- SMOKING STATUS VS MEAN NEUTROPHIL LYMPHOCYTE RATIO
SMOKING NEUTROPHIL LYMPHOCYTE RATIO
MEAN SD
YES 4.38 1.37
NO 2.69 1.27
P VALUE - 0.001 SIGNIFICANT UNPAIRED T TEST
[image:83.612.149.497.339.553.2]CHART NO:7- SMOKING STATUS VS MEAN NEUTROPHIL LYMPHOCYTE RATIO
TABLE NO:9-EXPOSURE TO BIOMASS FUEL
BIOMASS FUEL NO OF PATIENTS PERCENTAGE
YES 52 52%
NO 48 48%
65
[image:84.612.126.518.77.333.2]CHART NO:8 -EXPOSURE TO BIOMASS FUEL
TABLE NO:10- BIOMASS FUEL EXPOSURE VS MEAN NEUTROPHIL LYMPHOCYTE RATIO
BIOMASS FUEL NEUTROPHIL LYMPHOCYTE RATIO
MEAN SD
YES 4.25 1.54
NO 3.39 1.45
P VALUE - 0.005 SIGNIFICANT UNPAIRED T TEST
52% 48%
BIOMASS FUEL
YES
66
[image:85.612.121.533.68.440.2]CHART NO:9- BIOMASS FUEL EXPOSURE VS MEAN NEUTROPHIL LYMPHOCYTE RATIO
TABLE NO: 11- ENVIRONMENTAL EXPOSURE ENVIRONMENTAL
EXPOSURE NO OF PATIENTS PERCENTAGE
YES 56 56%
NO 44 44%
CHART NO: 10- ENVIRONMENTAL EXPOSURE
4.25
3.39
0 0.5 1 1.5 2 2.5 3 3.5 4 4.5
YES NO
MEAN NLR
56 44
ENVIRONMENTAL EXPOSURE
YES
67
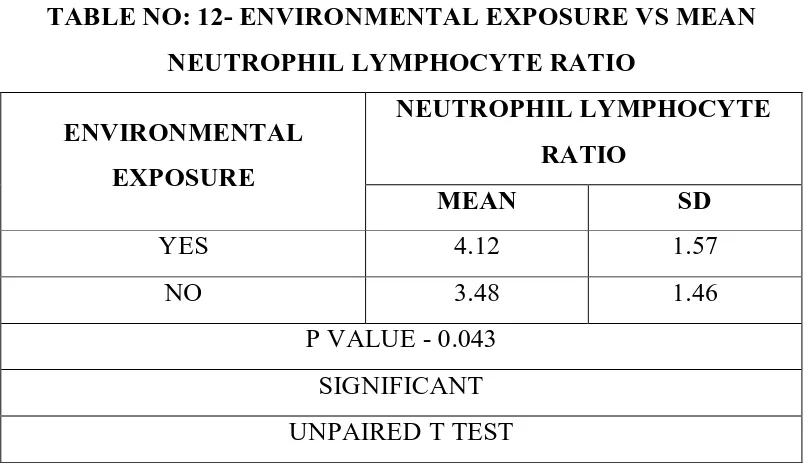
TABLE NO: 12- ENVIRONMENTAL EXPOSURE VS MEAN NEUTROPHIL LYMPHOCYTE RATIO
ENVIRONMENTAL EXPOSURE
NEUTROPHIL LYMPHOCYTE RATIO
MEAN SD
YES 4.12 1.57
NO 3.48 1.46
P VALUE - 0.043 SIGNIFICANT UNPAIRED T TEST
CHART NO: 11- ENVIRONMENTAL EXPOSURE VS MEAN NEUTROPHIL LYMPHOCYTE RATIO
TABLE NO: 13- HYPERTENSION PATIENTS
HYPERTENSION NO OF
PATIENTS PERCENTAGE
PRESENT 36 36%
ABSENT 64 64%
4
.1
2
3
.4
8
Y E S N O
68
[image:87.612.127.526.82.334.2]CHART NO: 12- HYPERTENSION PATIENTS
TABLE NO: 14- HYPERTENSION VS MEAN NEUTROPHIL LYMPHOCYTE RATIO
HYPERTENSION NEUTROPHIL LYMPHOCYTE RATIO
MEAN SD
PRESENT 4.16 1.67
ABSENT 3.66 1.46
P VALUE - 0.119 NON SIGNIFICANT
UNPAIRED T TEST 36, 36%
64, 64%
HYPERTENSION
PRESENT
69
[image:88.612.135.511.81.485.2]CHART NO: 13- HYPERTENSION VS MEAN NEUTROPHIL LYMPHOCYTE RATIO
TABLE NO:15- PLACE OF PATIENTS
PLACE NO OF
PATIENTS PERCENTAGE
URBAN 39 39%
RURAL 61 61%
CHART NO:14- PLACE OF PATIENTS
3.4 3.5 3.6 3.7 3.8 3.9 4 4.1 4.2
PRESENT ABSENT
MEAN NLR
39%
61%
PLACE
URBAN
70
TABLE NO: 16- PLACE OF ORIGIN OF PATIENTS VS MEAN NEUTROPHIL LYMPHOCYTE RATIO
PLACE NEUTROPHIL LYMPHOCYTE RATIO
MEAN SD
URBAN 3.72 1.64
RURAL 3.91 1.5
P VALUE - 0.558 NON SIGNIFICANT
UNPAIRED T TEST
[image:89.612.144.500.331.538.2]CHART NO: 15- PLACE OF ORIGIN OF PATIENTS VS MEAN NEUTROPHIL LYMPHOCYTE RATIO
TABLE NO: 17- MMRC GRADING OF DYSPONEA OF PATIENTS
MMRC GRADING NO OF PATIENTS PERCENTAGE
GRADE 1 12 12%
GRADE 2 26 26%
GRADE 3 49 49%
GRADE 4 13 13%
3
.7
2
3
.9
1
U R B A N R U R A L
71
[image:90.612.149.494.88.303.2]CHART NO: 16- MMRC GRADING OF DYSPONEA OF PATIENTS
TABLE NO:18- MMRC GRADING VS MEAN NEUTROPHIL LYMPHOCYTE RATIO
MMRC GRADING
NEUTROPHIL LYMPHOCYTE RATIO
MEAN SD
GRADE 1 1.98 0.48
GRADE 2 2.52 0.98
GRADE 3 4.74 1.17
GRADE 4 4.8 0.77
P VALUE - 0.001 SIGNIFICANT
ANOVA
12
26
49
13
MMRC GRADING
72
[image:91.612.131.515.65.472.2]CHART NO:17- MMRC GRADING VS MEAN NEUTROPHIL LYMPHOCYTE RATIO
TABLE NO :19- FEV1 OF PATIENTS
FEV1 NO OF PATIENTS PERCENTAGE
MILD 12 12%
MODERATE 30 30%
SEVERE 15 15%
VERY SEVERE 43 43%
CHART NO :18- FEV1 OF PATIENTS 1.98 2.52 4.74 4.8 0 1 2 3 4 5 6
73
TABLE NO:20-FEV1 VS MEAN NEUTROPHIL LYMPHOCYTE RATIO
FEV1 NEUTROPHIL LYMPHOCYTE RATIO
MEAN SD
MILD 2.09 0.65
MODERATE 2.59 1.04
SEVERE 4.38 1.35
VERY SEVERE 5.01 0.84
P VALUE - 0.001 SIGNIFICANT
ANOVA
CHART NO:19-FEV1 VS MEAN NEUTROPHIL LYMPHOCYTE RATIO
TABLE NO:21- GOLD GRADING OF COPD
GOLD NO OF PATIENTS PERCENTAGE
MILD 10 10%
MODERATE 32 32%
SEVERE 17 17%
VERY SEVERE 41 41%
2
.0
9 2.5
9
4
.3
8 5
.0
1
M I L D M O D E R A T E S E V E R E V E R Y S E V E R E
74
[image:93.612.141.506.81.307.2]CHART NO:20- GOLD GRADING OF COPD
TABLE NO: 22- GOLD GRADING VS MEAN NEUTROPHIL LYMPHOCYTE RATIO
GOLD NEUTROPHIL LYMPHOCYTE RATIO
MEAN SD
MILD 2.03 0.47
MODERATE 2.58 1.05
SEVERE 4.29 1.19
VERY SEVERE 5.08 0.86
P VALUE - 0.001 SIGNIFICANT
ANOVA 10%
32%
17% 41%
GOLD
MILD
MODERATE
SEVERE
75
[image:94.612.132.516.64.480.2]CHART: 21- GOLD GRADING VS MEAN NEUTROPHIL LYMPHOCYTE RATIO
TABLE NO: 23- BODY MASS INDICES OF PATIENTS
BODY MASS INDEX NO OF PATIENTS PERCENTAGE
< 18 32 32%
18-23 35 35%
> 23 33 33%
CHART NO: 22- BODY MASS INDICES OF PATIENTS 2.03
2.58
4.29
5.08
0 1 2 3 4 5 6
MILD MODERATE SEVERE VERY SEVERE
MEAN NLR
32%
35% 33%
BODY MASS INDEX
< 18
18-23
76
TABLE NO: 24- BODY MASS INDICES VS MEAN NEUTROPHIL LYMPHOCYTE RATIO
BODY MASS INDEX
NEUTROPHIL LYMPHOCYTE RATIO
MEAN SD
< 50 4.71 1.37
51-60 3.96 1.45
>70 2.97 1.36
P VALUE - 0.001 SIGNIFICANT
ANOVA
CHART NO:23- BODY MASS INDICES VS MEAN NEUTROPHIL LYMPHOCYTE RATIO
TABLE NO:25- SIX MINUTE WALK DISTANCE
6MWD NO OF PATIENTS PERCENTAGE
> 350 MTS 31 31%
250-349 MTS 21 21%
150-249 MTS 17 17%
< 149 MTS 31 31%
4.71 3.96 2.97 0 0.5 1 1.5 2 2.5 3 3.5 4 4.5 5
< 50 51-60 >70
[image:95.612.118.519.92.710.2]77
[image:96.612.138.507.89.479.2]CHART NO: 24- SIX MINUTE WALK DISTANCE.
TABLE NO:26- 6 MINUTE WALK DISTANCE VS MEAN NEUTROPHIL LYMPHOCYTE RATIO
6MWD NEUTROPHIL LYMPHOCYTE RATIO
MEAN SD
> 350 MTS 2.18 0.81
250-349 MTS 3.87 1.4
150-249 MTS 4.19 1.28
> 149 MTS 5.13 0.89
P VALUE - 0.001 SIGNIFICANT
ANOVA 31%
21% 17%
31%
6MWD
> 350 MTS
250-349 MTS
150-249 MTS
78
CHART NO:25- 6 MINUTE WALK DISTANCE VS MEAN NEUTROPHIL LYMPHOCYTE RATIO
TABLE NO: 27- BODE INDEX OF PATIENTS BODE INDEX
(SURVIVAL %) NO OF PATIENTS PERCENTAGE
1(80%) 20 20%
2(67%) 19 19%
3(57%) 20 20%
4(18%) 41 41%
0 1 2 3 4 5 6
> 350 MTS 250-349 MTS 150-249 MTS > 149 MTS 2.18
3.87 4.19
79
[image:98.612.150.496.75.299.2]CHART NO:26- BODE INDEX OF PATIENTS
TABLE NO: 28- BODE INDEX VS MEAN NEUTROPHIL LYMPHOCYTE RATIO
BODE INDEX (SURVIVAL %)
NEUTROPHIL LYMPHOCYTE RATIO
MEAN SD
1(80%) 2.07 0.62
2(67%) 3 1.19
3(57%) 4.25 1.44
4(18%) 4.89 1.04
P VALUE - 0.001 SIGNIFICANT
ANOVA
20
19
20 41
BODE INDEX
80
CHART NO:27- BODE INDEX VS MEAN NEUTROPHIL LYMPHOCYTE RATIO
TABLE NO: 29- NUMBER OF PATIENTS WITH PAH
PAH NO OF
PATIENTS PERCENTAGE
PRESENT 46 46%
ABSENT 54 54%
CHART NO:28- NUMBER OF PATIENTS WITH PAH
2
.0
7
3
4
.2
5 4
.8
9
1 ( 8 0 % ) 2 ( 6 7 % ) 3 ( 5 7 % ) 4 ( 1 8 % )
MEAN NLR
46% 54%
PAH
PRESENT
81
TABLE NO: 30-PAH VS MEAN NEUTROPHIL LYMPHOCYTE RATIO
NEUTROPHIL LYMPHOCYTE RATIO
PAH MEAN SD
PRESENT 4.81 1.18
ABSENT 3.01 1.35
P VALUE - 0.001 SIGNIFICANT UNPAIRED T TEST
CHART NO:29-PAH VS MEAN NEUTROPHIL LYMPHOCYTE RATIO
CHART NO:30-PAH VS SEVERITY OF DISEASE
4.81 3.01 0 1 2 3 4 5 6 PRESENT ABSENT PAH MEAN NLR 0 3 7 35 12 27 8 7 0 5 10 15 20 25 30 35 40
M I L D M O D E R A T E S E V E R E V E R Y S E V E R E
PAH VS SEVRITY
82
TABLE NO: 31- NUMBER OF PATIENTS WITH FEVER FEVER NO OF PATIENTS PERCENTAGE
PRESENT 34 46%
ABSENT 66 54%
CHART NO:31- NUMBER OF PATIENTS WITH FEVER
TABLE NO:32- FEVER VS MEAN NEUTROPHIL LYMPHOCYTE RATIO
FEVER NEUTROPHIL LYMPHOCYTE RATIO
MEAN SD
PRESENT 4.81 1.19
ABSENT 3.34 1.48
P VALUE - 0.001 SIGNIFICANT UNPAIRED T TEST
34
66
FEVER
83
[image:102.612.133.511.64.337.2]CHART NO:32- FEVER VS MEAN NEUTROPHIL LYMPHOCYTE RATIO
TABLE NO: 33 –FEVER VS FEV1
SEVERITY(FEV1) FEVER
PRESENT ABSENT
MILD 1 11
MODERATE 1 29
SEVERE 3 12
VERY SEVERE 29 14
P VALUE - 0.001 SIGNIFICANT
KRUSKAL WALLIS TEST
4
.8
1
3
.3
4
P R E S E N T A B S E N T
84
TABLE NO: 34- NUMBER OF PATIENTS HAVING CREPITATIONS
CREPITATION NO OF PATIENTS PERCENTAGE
PRESENT 58 58%
ABSENT 42 42%
CHART NO: 33- NUMBER OF PATIENTS HAVING CREPITATIONS
TABLE NO: 35- CREPITATIONS VS MEAN NEUTROPHIL LYMPHOCYE RATIO
CREPITATIONS NEUTROPHIL LYMPHOCYTE RATIO
MEAN SD
PRESENT 4.75 1.15
ABSENT 2.58 1.09
P VALUE - 0.001 SIGNIFICANT UNPAIRED T TEST
58% 42%
CREPITATION
PRESENT
85
[image:104.612.149.497.107.324.2]CHART NO: 34- CREPITATIONS VS MEAN NEUTROPHIL LYMPHOCYE RATIO
TABLE NO: 36- NUMBER OF PATIENTS HAVING WHEEZING WHEEZE NO OF PATIENTS PERCENTAGE
PRESENT 88 88%
ABSENT 12 12%
CHART NO: 35- NUMBER OF PATIENTS HAVING WHEEZING
0 0.5 1 1.5 2 2.5 3 3.5 4 4.5 5
PRESENT ABSENT
4.75
2.58
CREPITATIONS
MEAN NLR
88% 12%
WHEEZE
PRESENT
86
TABLE NO: 37- WHEEZING VS MEAN NEUTROPHIL LYMPHOCYTE RATIO
WHEEZE NEUTROPHIL LYMPHOCYTE RATIO
MEAN SD
PRESENT 4.04 1.54
ABSENT 2.34 0.34
P VALUE - 0.001 SIGNIFICANT UNPAIRED T TEST
[image:105.612.121.524.64.280.2]CHART NO: 36- WHEEZING VS MEAN NEUTROPHIL LYMPHOCYTE RATIO
TABLE NO: 38- NUMBER OF PATIENTS HAVING CYANOSIS
CYANOSIS NO OF PATIENTS PERCENTAGE
PRESENT 45 45%
ABSENT 55 55%
87
CHART NO: 37- NUMBER OF PATIENTS HAVING CYANOSIS
TABLE NO: 39- CYANOSIS VS MEAN NEUTROPHIL LYMPHOCYTE RATIO
CYANOSIS NEUTROPHIL LYMPHOCYTE RATIO
MEAN SD
PRESENT 5.07 0.84
ABSENT 2.83 1.25
P VALUE - 0.001 SIGNIFICANT UNPAIRED T TEST
45
55
CYANOSIS
88
[image:107.612.158.489.66.314.2]CHART NO: 38- CYANOSIS VS MEAN NEUTROPHIL LYMPHOCYTE RATIO
TABLE NO: 40- NUMBER OF PATIENTS HAVING CLUBBING
CLUBBING NO OF PATIENTS PERCENTAGE
PRESENT 24 24%
ABSENT 76 76%
CHART NO: 39- NUMBER OF PATIENTS HAVING CLUBBING
5.07
2.83
0 1 2 3 4 5 6
PRESENT ABSENT
CYANOSIS
MEAN NLR
24
76
CLUBBING