Int. J. Electrochem. Sci., 12 (2017) 5818 – 5827, doi: 10.20964/2017.07.10
International Journal of
ELECTROCHEMICAL
SCIENCE
www.electrochemsci.org
Short Communication
A Electrochemical Performance Analysis of High and Low Pt
Loading in Pt/C Catalysts by Rotating Disk Electrode
Yan Rao1,2, Fen Zhou1,2, Kailin Fu1,2, Wei Guo1,2,*, Mu Pan1,2,*
1
State Key Laboratory of Advanced Technology for Materials Synthesis and Processing, Wuhan University of Technology, Luoshi Road 122#, Wuhan 430070, PR China
2
Hubei Key Laboratory of Fuel Cells, Wuhan University of Technology, Luoshi Road 122#, Wuhan 430070, PR China
*
E-mail:[email protected], [email protected]
Received: 17 March 2017 / Accepted: 25 April 2017 / Published: 12 June 2017
A series of Pt/C catalyst electrodes with different Pt loadings ranging from 12μg/cm2 to 400μg/cm2 was characterized in our experiments by rotational disk electrode (RDE) system. The influence of Pt loading on the performance of the catalyst was systematically analyzed. We found that if the Pt loading was very low, which the electrode thickness could be neglected, the H+ in solution can be quickly penetrated into the electrode, the impact of mass transfer can be ignored and the electrochemical active area (ECSA) was equal to the inherent value; when the electrode thickness increases gradually with the increasing Pt loading, the mass transfer gets restricted as well as ohm potential drop in the solution, the electrode potential was to shift significantly as a result, and the ECSA was lower than the inherent value. Oxygen reduction reaction (ORR) performance also verified this point. The content of effective Pt loading in high Pt loading electrode (>100μg/cm2
, or electrode thickness >2.17μm) can be calculated by the ratio of ECSA for high to low Pt loading.
Keywords: Rotating disk electrode, Pt/C catalyst, Pt loading, Electrochemical active area, Oxygen reduction reaction
1. INTRODUCTION
As an electrochemical device that converts chemical energy from hydrogen and oxygen directly into electrical energy, proton exchange membrane fuel cell (PEMFC), which shows high energy conversion efficiency, environmentally friendly and produces only water (no hazardous gases, such as NOx, SOx and CO2), has become an preferred clean and efficient power generation technology
for PEMFCs due to their high catalytic activity and stability.[4, 5] However, the lack of Pt resources and high cost has become a major problem which affects its further application. Therefore, the development of new catalysts with low Pt loading and high catalytic performance is particularly important.
The performance of PEMFC is limited by the kinetics of membrane electrode assembly (MEA) (the hydrogen oxidation and oxygen reduction), and the reaction rate of catalysts has played a decisive role during the reaction in fuel cells.[6] In the previous work, researchers found that the main reason of catalyst efficiency loss in the PEMFC is due to the low kinetics process of the oxygen reduction reaction at working temperature (-30~100℃).[7, 8] Moreover, the reaction rate of the oxygen reduction for the Pt catalysts is 6 orders of magnitude lower than the hydrogen oxidation, which means that a high Pt loading in the cathode is required to provide a sufficient rate of oxygen reduction reaction.[9] Usually, for the commercial Pt/C catalyst, the Pt loading in cathode is about 0.4mg/cm2, which is larger than the anode (about 0.1mg/cm2).[10] Therefore, studying the oxygen reduction performance is a more effectively method to reduce the Pt loading in the Pt/C catalyst.
Rotational disk electrode (RDE) technology, which is widely used for testing the electrochemical properties of catalysts in PEMFC, has become the first choice for most electrochemical researchers.[11, 12] Normally, in order to reduce the effect of mass transfer resistance, the study of oxygen reduction for Pt/C catalysts by RDE is mainly focused on the low Pt loading range (4~36μg/cm2
).[13] However, the actual Pt loading in cathode for PEMFC is usually up to 400μg/cm2, which is a large difference in the oxygen reduction test by RDE. Therefore, the traditional RDE test does not fully reflect the actual catalytic activity of the cathode catalyst in PEMFC. So it is of great scientific significance to test the actual Pt loading to predict the electrochemical performance of the fuel cell cathode catalyst by RDE test system.
The electrochemical active area (ECSA) is an important indicator for the performance of catalysts. However, researchers found that high Pt loading will result in smaller ECSA. Pozio et al. reported that some Pt particles were blocked in the carbon substrate and could not be exposed to the electrolyte solution with the Pt loading increasing (28~900μg/cm2) (the electrode thickness growing, resulting in a gradual decrease in the ECSA.[5] But the authors didn’t consider the effect of the mass transfer on Pt surface, which cannot be ignored because the surface of Pt is covered with a layer of ionomer. When the electrode thickness is very thin, the H+ in solution can be quickly penetrated into the electrode, the impact of mass transfer can be ignored; when the electrode thickness increases gradually, the decrease of the H+ permeation rate will cause the shortage of H+ in the Pt catalyst surface, which would lower the measured electrode potential. Lin et al. found that the peak potential of hydrogen adsorption/desorption would appear a significant shift if the reaction of adsorption/desorption processes of H+ in the Pt surface become very slow (or shortage).[14] This means that the peak potential shift of hydrogen adsorption/desorption can be observed in the CV curve (which is clearly observed in our laboratory) if hydrogen diffusion is restricted in high Pt loading electrode. Therefore, under the influence of mass transfer, it is important to reexamine the electrochemical performance of Pt/C catalysts with different Pt/C loading.
In this paper, the oxygen reduction performance of a series of Pt/C catalysts with Pt/C loading from 12μg/cm2
voltammetry (LSV). The main goal of this work is to study the effect of Pt loading on oxygen reduction activity at different stages, to explain the decrease of ECSA in the case of high Pt loading. Moreover, we propose a method to calculate the content of effective Pt loading under the condition of high Pt loading (>100μg/cm2, or electrode thickness >2.17μm).
2. EXPERIMENTAL AND CHARACTERIZATION
In this work, a series of electrodes with different Pt loadings were prepared by using Pt/C catalyst ink with the same I/C ratio (the ratio of ionomer mass to carbon support mass) and characterized using CV and LSV. All of the electrochemical tests were performed using a three-electrode system on an electrochemical workstation (Shanghai Chenhua, CHI660E) and rotating disk equipment. The working electrode is a glassy carbon electrode with a diameter of 5mm (Russell Technology). The reference electrode is a home-made reversible hydrogen electrode and the counter electrode is Pt black (Russell Technology). The electrolyte was 0.1M HClO4 (perchloric acid,
analytical grade, Sinopharm 72.0%), and the experimental temperature was room temperature (24℃).
2.1 Preparation of the Electrode
Twelve electrodes with different Pt loading were prepared by using 57.9% commercial Pt/C catalysts (TKK Corporation, Japan) with the I/C ratio of 0.5. The Pt loading of electrodes were 12μg/cm2
(thickness 0.26μm), 20μg/cm2 (thickness 0.43μm), 40μg/cm2 (thickness 0.87μm), 60μg/cm2 (thickness 1.30μm), 80μg/cm2
(thickness 1.73μm), 100μg/cm2 (thickness 2.17μm), 150μg/cm2 (thickness 3.25μm), 200μg/cm2
(thickness 4.33μm), 250μg/cm2 (thickness 5.12μm), 300μg/cm2 (thickness 6.50μm), 350μg/cm2
(thickness: 7.58μm) and 400μg/cm2 (thickness: 8.67μm) respectively. To prepare the catalyst layer, a certain amount of Pt/C catalyst was taken into the 2mL sample tube. Following, 100μL of deionized water, 900μL of isopropyl alcohol (analytical grade, Sinopharm 99.7%) and 20μL of Nafion (DuPont 5wt%) solution were sequentially added in sample tube by pipetting. And then, the samples were put into an ultrasonic cell under ice-cooling conditions for 20 minutes to obtain a homogeneous dispersion of catalyst ink. Subsequently, a pipette gun was used to take different volumes of ink to the surface of the glassy carbon electrode, followed by drying the solution to form a homogeneous catalyst film. Before to test, the electrode coated the catalyst was immersed in the electrolyte solution for 30min.
2.2 Cyclic voltammetry (CV) analysis of the Pt/C catalyst
Before the experiment, the electrolyte was bubbled with 99.999% high-purity N2 for 30
minutes to exclude O2. And then, the electrodes were scanned for 80 cycles at a high scan rate
M V S ECSA
1 .
2 (1) V is the scan rate (V/s), ECSA is the electrochemical active area (m2/gPt), S is the integral area
between the current and voltage in the hydrogen adsorption area (mA•V), M is the Pt loading (mg).
2.3 Linear scan voltammetry (LSV) analysis of the Pt/C catalyst
Similar to the CV test, the electrolyte was bubbled with 99.999% high-purity O2 for 30min to
achieve oxygen saturation. The experimental voltage range is set to 0~1.2V (vs. RHE) and the scan rate is 5mV/s.
In this paper, the reaction current at 0.9V is divided by the true surface area and the actual mass of the Pt to obtain the specific activity (SA). The reaction current at 0.9V is divided by the actual mass of the Pt to obtain the mass activity (MA). The SA is calculated using Equation 2:
0.9V Loading
I SA
ECSA Pt
(2) The MA is calculated using Equation 3:
0.9V Loading
I MA
Pt
(3) I0.9V is the reaction current in the LSV curve at 0.9V (mA), PtLoading is the Pt loading of the
catalyst electrode (mg).
3. RESULTS AND DISCUSSION
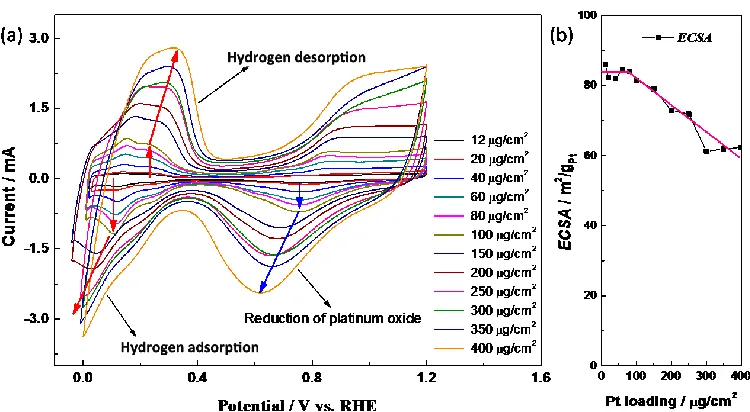
Figure 1. (a) The CV curves of a series of Pt/C catalyst electrodes with the same I/C ratio and different Pt loading; (b) Relationship between ECSA and Pt loading of Pt/C catalyst electrodes with the same I/C ratio and different Pt loadings. The testing condition was in 0.1M HClO4 solution
[image:4.596.112.487.476.682.2]
Figure1a shows the CV curves of Pt/C catalyst electrodes with the same I/C ratio and different Pt loading. The hydrogen adsorption/desorption peak is at about 0.2V, which is consistent with previous literature.[15] The hydrogen adsorption/desorption peak area (or total active area) is gradually increased with the increasing Pt loading (or thickness). According to the hydrogen absorption/desorption peak (potential: 0.05~0.4V vs.RHE) of the CV curves, the ECSA of Pt/C catalyst electrodes can be calculated by the eRec software and Equation 1. In our calculation, all Pt loadings in the electrode were considered to be electrochemically active. The results showed that the ECSA of Pt loadings (from 12μg/cm2 to 400μg/cm2) were 85.89m2/g (12μg/cm2), 82.24m2/g (20μg/cm2), 82.08m2/g (40μg/cm2), 84.52m2/g (60μg/cm2), 84.08m2/g (80μg/cm2), 81.55m2/g (100μg/cm2), 79.05m2/g (150μg/cm2), 72.81m2/g (200μg/cm2), 71.90m2/g (250μg/cm2), 61.31m2/g (300μg/cm2), 61.90m2/g (350μg/cm2), 62.36m2/g (400μg/cm2), respectively (as shown in Figure 1b and Table 1).
At low Pt loading region (<100μg/cm2, or electrode thickness <2.17μm), we observed
significant hydrogen adsorption/desorption peaks with longitudinal symmetry. This result indicated that the adsorption/desorption process of hydrogen on the electrode surface is reversible, and there is no mass transfer. Theoretically, under the same testing conditions, the ECSA of Pt/C catalysts with the same I/C ratio and preparation method are always same. As shown in Figure 1b, ECSA is about 85m2/g in the low Pt loading range (<100μg/cm2
), as have been reported in many articles which gave range from 60 to 110 m2/gPt,[16-22]indicating that the electrode does not experience mass transfer
difficulties because the electrode thickness is small enough. Interestingly, when the Pt loading was further increased (>100μg/cm2
, or electrode thickness >2.17μm), the peak potential of hydrogen adsorption/desorption began to shift. Simultaneously, the ECSA started to decrease gradually and dropped to almost 60m2/gPt. Yannick Garsany.et al had reported relatively low ECSA value for
commercial Pt/C catalysts,[23]which could prove the accuracy of our experimental data. The impact of scan rates can be ignored because the scan rate used in this experiment (50mV/s) was very slow. Therefore, we believe that the peak shift at high electrode thickness was due to the incomplete H-adsorption process caused by the ohm potential drop in the solution, which resulted in the lower measured electrode potential compared to the low thickness electrode.
The hydrogen adsorption/desorption process on the surface of the electrode can be understood as the adsorption/desorption process of H+ between the catalyst surface and the ionic solution. And the CV testing process can be equal to the oxidation/reduction process of H+ on the catalyst surface, as shown in Equation 4:
Had eƒ Had (4)
Had is hydrogen ion adsorbed on the electrode surface, Had is hydrogen atom adsorbed on the electrode surface.
When the electrode thickness is very thin (low Pt loading), there is no mass transfer limitation for H+ and electron-transfer reaction, the reaction shown in Equation 4 is very rapid and reversible. That is, the peak potential of adsorption/desorption is independent of the H+ transfer rate (or the scan rate) in solution. So the peak potential of adsorption/desorption (EP,low) does not shift. The peak current
(IP,low) can be calculated by Equation 5:
2 2
,
4
r P low
n F vA I
RT
Where n is the stoichiometric number of electrons involved in the electrode reaction, F is the Faraday constant, Ar is the real surface area, is the moles of adsorbed hydrogen atoms per unit Pt
surface area, R and T are the gas constant and temperature, respectively. In the case of thin electrode thickness, same as low Pt loading, Ar is equal to the total surface area (A) in catalysts, and IP,low and Ar
show a linear relationship. Therefore, ECSA values remain unchanged.
When the electrode thickness increased with the increasing Pt loading, the H+ is difficult to transfer between the electrode surface and solution due to the shortage of H+ inside the electrode, the electrical conversion reaction represented by Equation 4 significantly slowed down and got partially reversible. So the peak potential of adsorption/desorption is related to the H+ transfer rate (or the scan rate) in solution. When the scan rate is constant, the H+ transfer rate caused by electrode thickness will increase the mass transfer resistance. Thus the peak potential of adsorption/desorption (EP,high) will
shift. The peak current (IP,high) can be calculated by Equation 6:
2
,
2.718
a r
P high
n n F vA I
RT
(6) Where a is the transfer coefficient and na is the number of electron transfer. When the thickness
of the electrode increases gradually, that is, the loading of Pt increases, the ratio of the true surface area (Ar) to the total surface area (A) of catalysts will decrease gradually. It means that IP,high is directly
proportional to a, na and Ar, resulting the drop of the ECSA value, gradually.
Moreover, in the high Pt loading electrode, some Pt particles are blocked in the carbon substrate and not exposed to the electrolyte solution. This means that the effective Pt loading (Pteffective)
is less than the actual Pt loading (Ptactual). The Pteffective can be calculated by Equation7:
2.1 high real low S Pt V ECSA
(7)
ECSAlow is the electrochemical active area in low Pt loading electrode (m2/gPt), Shigh is the
integrated area between the current and voltage in the hydrogen desorption area in high Pt loading electrode (mA•V).
Thus, we propose the effective Pt loading (C) by Equation 8:
2.1
high high real
high low high low
S ECSA
Pt C
Pt V ECSA Pt ECSA
(8) More interesting, the thickness of MEA which the Pt loading is 400μg/cm2 in the fuel cell is normally 5~10μm, and the ECSA values for MEA in the fuel cell are around 60m2/g, which is in agreement with the values obtained the catalyst of Pt loading greater than 250μg/cm2 (or electrode thickness >5.12μm) as measured by a rotating disk electrode system.
0 100 200 300 400
0.0 0.2 0.4 0.6 0.8 1.0 1.2
Curre
nt
/
mA
Pt loading / g/cm2 Current0.9V
0.2 0.4 0.6 0.8 1.0 1.2
1.2 0.8 0.4 0.0
12 g/cm2 20 g/cm2 40 g/cm2 60g/cm2 80g/cm2 100g/cm2 150g/cm2 200 g/cm2 250 g/cm2 300g/cm2 350 g/cm2 400 g/cm2
Cu
rrent
/
mA
Potential / V vs. RHE 0.9 V
(a)
(b)
Figure 2. (a) The LSV curves of a series of Pt/C catalyst electrodes with the same I/C ratio and different Pt loading; (b) Relationship between current at 0.9V and Pt loading of Pt/C catalyst electrodes.
[image:7.596.55.548.73.348.2] [image:7.596.84.498.438.689.2]
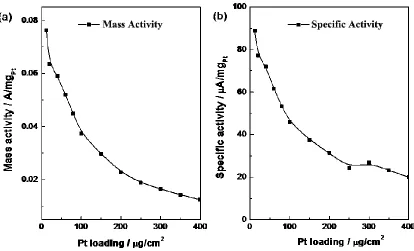
Blizanac et al. announced that MA in their experiments was about 0.03A/mgPt at
0.9V.[24]While Huiyuan Zhu et al. reported that of commercial Pt/C catalysts was 0.035 A/mgPt and
SA was 0.068 mA/cm2 at 557mV (vs. Ag/AgCl), respectively.[25]However, there were still some literatures claimed higher value of MA and SA depending on the kinetics current at 0.9V,which is calculated from the current at 0.9V but larger.[26-29]It has been proved that the kinetics current at 0.9V would be more accurate at very low Pt loadings (<<100μg/cm2),accounting for why we did not choose the current. [29-30] According to the ratio of MA to Pt loading and ratio of SA to Pt loading, it was clear to see that the MA and the SA decreased with the increase of Pt loading, which proved that the catalyst loading would have a significant impact on its activity. With the increase of the catalyst Pt loading, the internal mass transfer resistance of the catalyst increased, which further affected the active area of the catalyst.
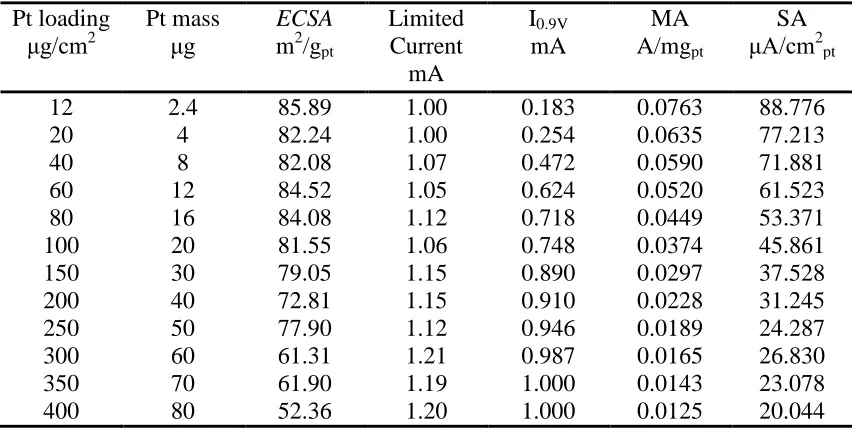
Table 1. ECSA, current, MA, SA and limiting current of a series of Pt/C catalyst electrodes with the same I/C ratio and different Pt loading.
Pt loading Pt mass ECSA Limited I0.9V MA SA
μg/cm2 μg
m2/gpt Current mA A/mgpt μA/cm2pt
mA
12 2.4 85.89 1.00 0.183 0.0763 88.776
20 4 82.24 1.00 0.254 0.0635 77.213
40 8 82.08 1.07 0.472 0.0590 71.881
60 12 84.52 1.05 0.624 0.0520 61.523
80 16 84.08 1.12 0.718 0.0449 53.371
100 20 81.55 1.06 0.748 0.0374 45.861
150 30 79.05 1.15 0.890 0.0297 37.528
200 40 72.81 1.15 0.910 0.0228 31.245
250 50 77.90 1.12 0.946 0.0189 24.287
300 60 61.31 1.21 0.987 0.0165 26.830
350 70 61.90 1.19 1.000 0.0143 23.078
400 80 52.36 1.20 1.000 0.0125 20.044
4. CONCLUSION
In this paper, the electrochemical performance of Pt/C catalyst electrodes with the same I/C ratio and different Pt loadings were measured by the RDE system.We got the following conclusions:
(1) When the Pt loading (or thickness) is small enough (<100μg/cm2, or <2.17μm), the measured ECSA was equal to the inherent value;
[image:8.596.85.511.326.540.2]
(3) The concept of effective Pt loading in high Pt loading electrode (>100μg/cm2, or electrode thickness >2.17μm) was proposed and could be defined as the ratio of ECSA for high to low Pt loading.
ACKNOWLEDGEMENT
This work is financially supported by the Natural Science Foundation of China (Program No. 21476178).
References
1. M. Winter and R. J. Brodd, Chem. Rev., 105 (2005) 1021. 2. A. Z. Weber and J. Newman, Chem. Rev., 104 (2004) 4679.
3. M. S. Whittingham, R. F. Savinell and T. Zawodzinski, Chem. Rev., 104 (2004) 4243.
4. Y. H. Bing, H. S. Liu, L. Zhang, D. Ghosh and J. J. Zhang, Chem. Soc. Rev., 39 (2010) 2184. 5. A. Pozio, M. De Francesco, A. Cemmi, F. Cardellini and L. Giorgi, J. Power Sources, 105 (2002)
13.
6. B. C. H. Steele and A. Heinzel, Nature, 414 (2001) 345.
7. J. L. Zhang, Z. Xie, J. J. Zhang, Y. H. Tanga, C. J. Song, T. Navessin, Z. Q. Shi, D. T. Song, H. J. Wang, D. P. Wilkinson, Z. S. Liu and S. Holdcroft, J. Power Sources, 160 (2006) 872.
8. Y. H. Lin, X. L. Cui, C. Yen and C. M. Wai, J. Phys. Chem. B, 109 (2005) 14410.
9. J. L. Zhang, Z. Xie, J. J. Zhang, Y. H. Tanga, C. J. Song, T. Navessin, Z. Q. Shi, D. T. Song, H. J. Wang, D. P. Wilkinson, Z. S. Liu, S. Holdcroft, J. Power Sources, 160 (2006) 872-891.
10. J. H. Wee, K. Y. Lee and S. H. Kim, J. Power Sources, 165 (2007) 667. 11. M. Shao, J. Power Sources, 196 (2011) 2433.
12. J. Wu and H. Yang, Accounts of Chemical Research, 46 (2013) 1848.
13. E. Higuchi, H. Uchida and M. Watanabe, J. Electroanal. Chem., 583 (2005) 69. 14. R. B. Lin and S. M. Shih, J. Chin. Inst. Chem. Eng., 37 (2006) 311.
15. S. Y. Huang, P. Ganesan, B. N. Popov, Applied catalysis B – environmental, 102 (2011) 71. 16. I. Takahashi and S. S. Kocha, Journal of Power Sources. 195 (2010) 6312.
17. 7. S. S. Kocha, J. W. Zack, S. M. Alia, K. Neyerlin and B. S. Pivovar, ECS Transactions. 50 (2013) 1475.
18. O. J. Curnick, B. G. Pollet and P. M. Mendes, Rsc Adv. 2 (2012) 8368.
19. W. Sheng, S. Chen, E. Vescovo and Y. Shao-Horn, J Electrochem Soc. 159 (2011) B96.
20. K. Ke, K. Hiroshima, Y. Kamitaka, T. Hatanaka and Y. Morimoto, Electrochim Acta. 72 (2012) 120.
21. M. Nesselberger, S. Ashton, J. C. Meier, I. Katsounaros, K. J. Mayrhofer and M. Arenz, J Am Chem Soc. 133 (2011) 17428.
22. J.-M. Sansiñena, M. S. Wilson and F. H. Garzón, ECS Transactions. 50 (2013) 1693. 23. Y. Garsany, O. A. Baturina, K. E. Swider-Lyons and S. S. Kocha, ACS Publications (2010). 24. H. Gasteiger, W. Gu, R. Makharia, M. Mathias and B. Sompalli, Handbook of Fuel Cells (2003). 25. H. Zhu, S. Zhang, S. Guo, D. Su and S. Sun, J Am Chem Soc. 135 (2013) 7130.
26. K. Shinozaki, J. W. Zack, R. M. Richards, B. S. Pivovar and S. S. Kocha, J Electrochem Soc. 162 (2015) F1144.
27. Y. J. Sa, D.-J. Seo, J. Woo, J. T. Lim, J. Y. Cheon, S. Y. Yang, J. M. Lee, D. Kang, T. J. Shin and H. S. Shin, J Am Chem Soc. 138 (2016) 15046.
28. S. A. Mauger, K. Neyerlin, S. M. Alia, K. Hurst, S. Shulda, C. Ngo, J. N. Weker, S. Pylypenko and B. S. Pivovar, in Meeting Abstracts, p. 2447 (2016).
56 (2005) 9.
30. T. Schmidt and H. Gasteiger, Handbook of Fuel Cells (2003).