Int. J. Electrochem. Sci., 12 (2017) 6156 – 6169, doi: 10.20964/2017.07.68
International Journal of
ELECTROCHEMICAL
SCIENCE
www.electrochemsci.orgPoly-lysine/cyclodextrin polymer-MWCNTs as a Selective
Sensing Platform for Hydroquinone and Catechol Simultaneous
Determination
Qian Han*, Kangkang He, Ruisheng Han, Jianda Zhang
Laboratory of Environment change and Ecological Construction of Hebei Province, College of Resources and Environment Science, Hebei Normal University, Shijiazhuang, Hebei 050024, PR China.
*
E-mail: [email protected]
Received: 28 March 2017 / Accepted: 14 May 2017 / Published: 12 June 2017
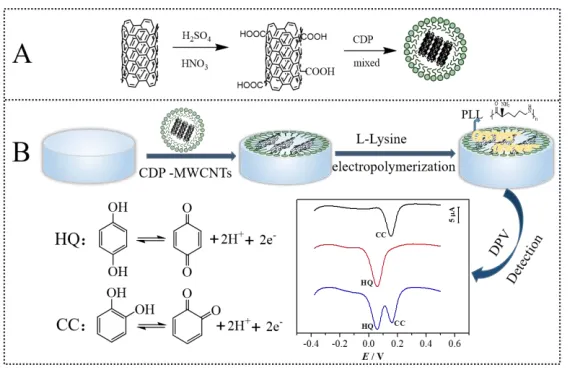
Electropolymerization of L-lysine incorporating multiwall carbon nanotubes (MWCNTs) dispersed in β-cyclodextrin prepolymer (CDP) solution was constructed a very efficient sensor. Scanning electron microscopy was employed to characterize the surface morphology of the modified electrode. The proposed sensor excellently enhanced the selectivity in the simultaneous determination of HQ and CC by differential pulse voltammetry and cyclic voltammetry. Comparing with bare GCE, MWCNTs/GCE, CDP-MWCNTs/GCE, the introduction of L-lysine polymer film effectively declined the shoulder peak of buffer soultion which seriously interfered the dection of hydroquinone (HQ) and catechol (CC) isomers. The PLL/CDP-MWCNTs/GCE displayed good discrimination ability and high sensitivity toward HQ and CC, peak-to-peak separation about 105 mV were obtained. The linear response range for hydroquinone and catechol were 0.1 μM – 100 μM. The detection limits of HQ and CC were 0.044 μM, 0.058 μM, respectively.
Keywords: Hydroquinone; Catechol; L-lysine polymer; Multiwall carbon nanotubes; β-Cyclodextrin
prepolymer; Electrochemical behavior
1. INTRODUCTION
pollutants in environment are extremely harmful to human and animals. Hydroquinone can cause headache, kidney damage, fatigue and tachycardia [2], catechol is carcinogen, teratogen, and irritation to skin [3]. Because of their similar properties, structures, and coexistence in environmental samples, it is a great challenge to separate and simultaneous determine HQ and CC [4]. Therefore, the development of methods for HQ and CC detection have been exploited to meet the rising demands, such as gas or liquid chromatography [5], capillary electrophoresis [6], chemiluminescence detection [7], and fluorescence detection [8], and electrochemical methods [9,10]. Compared with other techniques’ excessive time consumption, complicated sample pretreatments and manipulations, the electrochemical methods have displayed the distinct advantages such as efficiency, high sensitivity, quick response and ease of use [11,12]. Poor electrochemical signal and overlapped oxidation and reduction peaks were often happened in detecting phenol compounds on conventional working electrodes (GCE or Au), it is highly necessary to establish simply, rapid and excellent selective and sensitive methods for simultaneous detection of HQ and CC [13,14].
Nanomaterials have displayed promising potential applications in most interdisciplinary research fields due to their unique physico-chemical properties and device stability [15]. Among them, carbon nanotubes (CNTs) as fascinating materials, relying on their large surface areas, excellent electrical conductivity and extremely high mechanical strength, are widely developed to fabricate electrochemical sensing interfaces. Multiwalled carbon nanotubes (MWCNTs) and functionalized MWCNTs have received more attention for development of electrochemical sensors [16]. Nevertheless, MWCNTs tend to form irreversible agglomerates in water, and sometimes it is poor stability and reproducibility when it was dropped on the electrode surface [17]. So it is very important to search some methods to solve the questions.
β-Cyclodextrin (β-CD) is a cyclic oligosaccharide with seven glucopyranose units. Relying on its unique structural properties, β-CD has a wide application in the design of sensors [18]. However its water-solution characteristics of β-CD restrict its development of sensors’ stability. To overcome the problem, water-soluble β-CD cross-linked with water-insoluble β-CD prepolymer (CDP) showed excellent film-forming ability and electrode more stability [19]. Meanwhile, it was environmentally friendly to improve the dispersibility of functional materials. So the water-insoluble CDP with carbon materials have been successfully applied in electrochemical area. Through dissolving CNTs in mixed solution of CD and pre-CDP, a glucose biosensor have been successfully prepared [20]. Multiwall carbon nanotubes and graphene sheets in the mixed solution of cyclodextrin and cyclodextrin prepolymer were used to constructed a biosensor to simultaneous determine dopamine, ascorbic acid and nitrite [21]. Moreover, Ploy L-lysine (PLL) film which can be easily formed on electrode surface by electropolymerizationas, has been applied on manufacture electrochemical sensors because of its rapid preparation, good stability, reproducibility and the presence of multiple functional groups [22]. In previous studies, PLL was most as a linker to attach bioactive molecules or nanomaterials because of its plentiful amino groups or electrical property [23,24] .
the matrix, a realizable fabricated sensor was successfully applied to the simultaneous determination of HQ and CC. The cooperation of PLL and CDP-MWCNTs have improved the catalytic activity and sensitivity of sensor. Poly-L-lysine on the sensor surface displayed a critical need for the immobilization procedure. Meanwhile, the sensor displayed high stability and satisfactory reproducibility.
2. EXPERIMENTAL
2.1 Reagents and materials
L-lysine, hydroquinone and catechol were obtained from Sigma Chemical Co. (St. Louis, MO, USA). β-cyclodextrin was purchased from Aladdin Chemistry Co. Ltd (Shanghai, China). Multiwalled carbon nanotubes were obtained from Nanjing Xianfeng Nano Co. (Nanjing, China). All other chemicals were analytical grade and used without further purification. Phosphate buffer solution (PBS 0.01M) with various pH was used as supporting electrolyte. Doubly distilled water was used throughout all experiments.
2.2 Apparatus
Differential pulse voltammetry (DPV) and cyclic voltammetry (CV) measurements were carried out on a CHI 650E electrochemistry workstation (Shanghai Chenhua Instruments Co., China). A conventional three electrode system comprised a bare glassy carbon electrode or a modifed electrode as working electrode, a saturated calomel electrode as reference, a platinum wire as auxiliary in all electrochemical experiments. All experiments were performed at room temperature (25.0±0.5℃). The scanning electron micrograph was taken with scanning electron microscope (SEM, S-4800, Hitachi).
2.3 Preparation of the sensor
The purchased MWCNTs were acid-treated by refluxing in a mixture of concentrated H2SO4
and HNO3 (v/v, 3:1) under constant circumfluence at 70 ℃ for 8 h [25]. β-CD prepolymer (pre-CDP)
was synthesized according to the previous report [26]. Then 2 mg acid-treated MWCNTs were mixed with equivalent β-CD (1 wt.%) and pre-CD (1 wt.%) for 1 h in an ultrasonic bath to obtained a black homogenous suspension (1.0 mg·mL-1
, CDP-MWCNTs). The synthesis procedure of CDP-MWCNTs was shown in Scheme 1A.
solution (pH 7.0) containing 5.0×10⁻³ mol·L−1 L-lysine, cycle voltammetric scans were performed for 15 cycles by cyclic potential scanning from 0.0 to 1.9 V with a scan rate of 100 mV·s-1
. The final obtained electrode was denoted as PLL/CDP-MWCNTs/GCE. Scheme 1 was the schematic representation of the stepwise immobilization of the sensor.
Scheme 1. Schematic diagram of the prapared process of electrochemical sensors for the determination of HQ and CC.
3. RESULTS AND DISCUSSION
3.1 Characterizations of fabricated interface
Figure 1. SEM micrographs of (A) MWCNTs, (B) CDP-MWCNTs composite, (C) PLL/CDP-MWCNTs film.
[image:4.596.159.443.162.346.2]
slightly, indicating that MWCNTs were dispersed well with CDP, the grafting of CDP did not affect the bodily microstructures of MWCNTs. With the electrodeposition of PLL films on CDP-MWCNTs (Fig.1 C), layers of thin sheet like PLL structures were adhered to the surface. Cyclic voltammetry was further to probe the packing structure and fully to catch these interface properties of the composite electrodes (as shown in Fig. S1 of Supporting information).
3.2 Electrochemical behavior of HQ and CC at the modified electrode
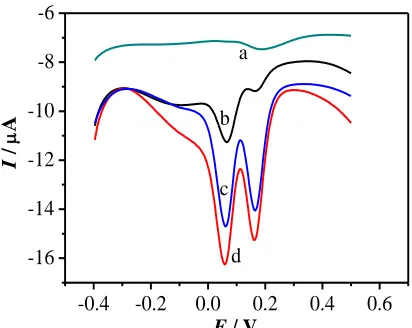
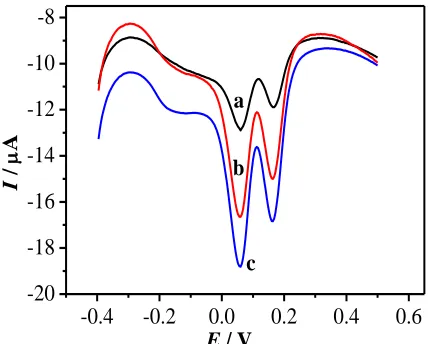
For the detection of low concentrations, the electro-polymerization of L-lysine were introduced to the electrode surface. The electrochemical behaviors of 3.0×10⁻⁵ M HQ and CC at different modified electrodes were investigated by DPVs. As shown in Fig. 2, compared with a broad, unresolved oxidation peak at the bare GCE (curve a), two improved oxidation currents of HQ and CC at PLL/GCE were observed (curve b), and the shoulder peak at -0.1 V was dissolved. This phenomenon may be explained that the presence of the PLL on the electrode surface made base solution oxidation more difficult, the overpotential at the modified electrode became declined. In the case of PLL-MWCNTs/GCE, two separately oxidation peaks with higher currents were presented (curve c). The DPV of PLL/CDP-MWCNTs/GCE in a 3.0×10⁻⁵ M mixture of HQ and CC represented a increased remarkably oxidation peak (curve d). The oxidation peak potential of HQ and CC appeared at +56.7 mV and +161.7 mV, respectively. The peak potential separation (ΔEp) was 105 mV.
Moreover, the oxidation peak currents of HQ and CC at the PLL/CDP-MWCNTs/GCE were -16.27 μA and -15.28 μA. The good results illustrated that the novel sensor not only could enhance the oxidations of HQ and CC, but also emarkably enlarge the peak separation among HQ and CC. But when electrochemical determination of HQ and CC for low concentrations at MWCNTs/GCE or CDP-MWCNTs/GCE, a large overpotential was seriously affected the detection of HQ and CC, the oxidation peak of HQ and CC were nearly disappeared (Fig. S2).
-0.4 -0.2 0.0 0.2 0.4 0.6 -16
-14 -12 -10 -8 -6
I
/
A
E / V
d c b
[image:5.596.185.391.515.679.2]a
Above all, not only CDP-MWCNTs provided large surface, good electronic conductivity and stability on the electrode surface [20], but also the poly-lysine film has both clear advantages: (1) the synergistic effect with CDP-MWCNTs facilitated an electron transfer between the substrate and the electrode, the redox peaks of HQ and CC can be obviously increased and divided, and (2) the random coil structures of L-lysine polymer prevented the overpotential of the electrode in phosphate buffer solution, the shoulder peak current was declined, and it was benefited for the detection of HQ with a low detection limit [27,28].
3.3 Optimization of experimental conditions
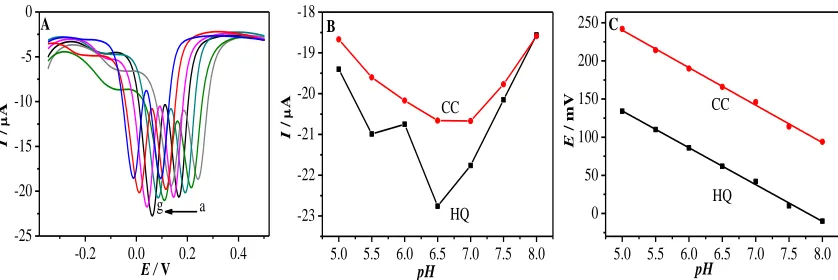
The pH was an important factor to investigate the electro-oxidation behavior of HQ and CC at the PLL/CDP-MWCNTs/GCE. The relationships between the oxidation peak and the pH values (from 5.0 to 8.0) were displayed in Fig. 3. The peak currents of HQ and CC gradually increased with increasing pH, the maximum current response at pH 6.5 was used as the optimum pH condition. The peak potentials of HQ and CC shifted more negative values with increasing pH, indicating that protons directly participate in the electrode reaction. The linear-regression equations of HQ and CC were Epa
(mV) = 486.0 − 49.14pH (R2
= 0.9974), Epa (mV) =375.9 − 48.29 pH (R2 = 0.9977), respectively. The
[image:6.596.82.501.461.601.2]slopes of the two regression equations were close to the theoretical value of 59 mV/pH, the results demonstrated that the electrochemical oxidation of HQ and CC were two electrons and two protons process. The probable mechanisms of electron generation for HQ and CC were presented in Scheme 1B.
Figure 3. (A) DPVs of 10×10-5 M HQ and CC in different pH values at PLL/CDP-MWCNTs/GCE. (B) Effect of pH value on the peak currents of HQ and CC. (C) The relationship between oxidation peak potential and pH.
The effect of scan rate on the response of 3.0×10⁻⁵ M HQ and CC was studied in Fig. 4. Both redox peak currens of HQ and CC increased gradually with the square root of the scan rate in the range from 50 to 200mV/s. From Fig. 4, we can see that the HQ and CC at PLL/CDP-MWCNTs/GCE were typical diffusion-controlled process [29]. The scan cycles of L-lysine from 5 to 25 cycles were aslo
5.0 5.5 6.0 6.5 7.0 7.5 8.0 -23
-22 -21 -20 -19 -18
I
/
A
pH
CC
HQ
B
-0.2 0.0 0.2 0.4 -25
-20 -15 -10 -5 0
I
/
A
g a
E / V A
5.0 5.5 6.0 6.5 7.0 7.5 8.0 0
50 100 150 200 250 C
E
/
mV CC
HQ
investigated (see Fig. S3). The electrochemical response of HQ and CC increased with increasing scan cycle up to 15 cycles, and then has no obvious increase. So 15 cycles were used as the PLL modification for the detection of HQ and CC.
-0.4 -0.2 0.0 0.2 0.4 0.6
-30 -20 -10 0 10 20 30
78 9 10 11 12 13 14 15 -30
-25 -20 -15 -10
I
/
A
CC
v1/2
HQ
7 8 910 11 12 13 14 15
5 10 15 20 25
CC HQ
v1/2
I
/
A
CC HQ
I
/
A
E / V
[image:7.596.211.372.155.296.2]g a
Figure 4. Cyclic voltammograms of HQ and CC at PLL/CDP-MWCNTs/GCE in 0.01M PBS (pH 6.5) at different scan rates. From above down: 50, 80, 100, 120, 150, 180 and 200mV/s. Insets: The relationships between peak currents and scan rate.
3.4 Simultaneous determination of HQ and CC
The selective determination of individual HQ or CC in their mixtures with a concentration of one species as a constant was showed in Fig. 5. The peak currents of HQ or CC were all presented good linear relationship with the concentrations. Fig.5A showed various concentration of HQ (0.1–100 μM) with a constant concentration of CC (5.0 μM). The oxidation peak currents gradually increased with increased HQ concentrations. The increased of Ipa were proportional to the HQ concentrations
from 0.1μM to 10 μM and between 10 and 100 μM. The linear equations were Ipa
(μA)=-6.623-0.4213c (μM) (R2=0.9941) , and Ipa (μA)=-11.50-0.1471c (μM) (R2=0.9918), respectively (Fig. 5C).
Analogously, Fig. 5B showed DPVs of CC with different concentrations in presence of 5.0 μM HQ. We can see that the HQ did not affect the detection of CC. As shown in Fig. 5D, the regression equation was Ipa (μA)=-2.882-0.3898c (μM) (R2=0.9955) when the concentration range was 0.1 μM-10
μM, whereas the linear regression equation was Ipa (μA)=-7.712-0.1396c (μM) (R2=0.9945) when the
Figure 5. DPVs of (A) different concentrations (0.1 μM, 0.5 μM, 1 μM, 3 μM, 5 μM, 10 μM, 30 μM,
50 μM, 100 μM) of HQ containing 5.0 μM CC and (B) different concentrations (0.1 μM, 0.5 μM, 1μM, 3 μM, 5 μM, 10 μM, 30 μM, 50 μM, 100 μM) of CC containing 5.0 μM HQ. (C) and (D) represent the calibration plots of HQ and CC, respectively.
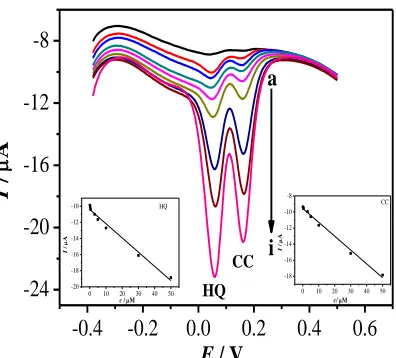
Figure 6. DPV curves for simultaneous determination of HQ and CC with different concentrations: (from a to i) 0.1 μM, 0.3 μM, 0.5 μM, 3 μM, 5 μM, 10 μM, 30 μM, 50 μM, 100 μM, Insets were HQ: calibration plot of HQ concentrations versus the oxidation current. CC: calibration plot of CC concentrations versus the oxidation current.
0 20 40 60 80 100
-30 -25 -20 -15 -10 -5 I / A
c / M
y=-0.1471c-11.5030 R2
=0.9918
y=-0.4213c-6.6225 R2
=0.9941
C
0 20 40 60 80 100
-25 -20 -15 -10 -5 0
y=-0.3898c-2.8815 R2=0.9955
I
/
A
c / M
y=-0.1396c-7.7121 R2=0.9945
D
-0.4 -0.2 0.0 0.2 0.4
-20 -16 -12 -8 -4 0 B
E / V
I
/
A
CC
-0.4 -0.2 0.0 0.2 0.4
-28 -24 -20 -16 -12 -8 -4 A I / A
E / V
HQ
-0.4 -0.2 0.0 0.2 0.4 0.6
-24 -20 -16 -12 -8 I / A
E / V
i
CC HQ
a
0 10 20 30 40 50
-18 -16 -14 -12 -10 -8 I / A CC
c/M
0 10 20 30 40 50
-20 -18 -16 -14 -12 -10 I / A
c /M
[image:8.596.190.388.500.679.2]
Then, the simultaneous determination of HQ and CC at PLL/CDP-MWCNTs/GCE was examined by DPV (Fig. 6). Under the optimized conditions, it showed two well-defined peaks for HQ and CC linearly increased with increasing concentration. The current concentration range of HQ was from 0.1 μM to 100 μM and the linear regression equation was Ipa (μA) = -10.41-0.1764c (μM)
(R2=0.9819) with a detection limit of 0.044 μM (S/N=3). The linear equation of CC was Ipa (μA) =
-9.565-0.1724c (μM) (R2=0.9906) and the detection limit was 0.058 μM. Thus, the fabricated sensor can be successfully used for simultaneous determination of the binary mixtures.
Table 1. Comparison of the fabricated electrode for simultaneous determination of HQ and CC with other modified electrodes.
Electrode
Linear range (μM)
Detection limit
(μM Refs.
HQ CC HQ CC
MWCNTsa 1-100 0.6-100 0.75 0.2 30 PASA/MWCNTsb 6-400 6-700 1 1 11 RGO-MWCNTs/GCc 8.0-391 5.5-540 2.6 1.8 31 PDDA-G/GCEd 1-500 1-400 0.25 0.2 32 poly-(p-ABA)/GCEe 1.2-600 2-900 0.4 0.5 33 (MWCNTs-NHCH2CH2NH)6/GCEf 10-120 5-80 2.3 1 34
GR–TiO2/GCEg 0.5-100 0.5-100 0.082 0.087 13
PLL/CDP-MWCNTs/GCE 0.1-100 0.1-100 0.044 0.058 this work
a
MWCNT=multiwall carbon nanotubes; bPASA=poly-amidosulfonic acid; cRGO=reduced graphene oxide; dpoly (diallyldimethylammonium chloride) functionalized graphene; epoly-(p-ABA)=Poly(p-aminobenzoic acid); f (MWCNTs-NHCH2CH2NH)6=layer-by-layer self-assembly of carboxylated multi-wall carbon nanotubes;
g
GR-TiO2=graphene-d
titanium dioxide nanocomposite
A comparison of the proposed electrode with different modified electrodes for HQ and CC detection was provided in Table 1. Compared with other carbon materials modified electrodes, the surface morphology of PLL/CDP-MWCNTs with its porous nanostructure has forcefully facilitate the efficient electron transfer for detection of HQ and CC. It showed that PLL/CDP-MWCNTs/GCE exhibited a wider linear ranges and more satisfied detection limits than other electrodes. So it obviously turned out that PLL/CDP-MWCNTs/GCE was potential for simultaneous and sensitive detection of HQ and CC.
3.5 Reproducibility and Stability
The stability of the modified electrode was further tested. No significant decrease (only 1.7%) in the initial peak current was observed after successive cyclic scans for 20 cycles. When the sensor was kept in storage for a week, the peak current intensity remained 95.8%, 96.2% for HQ and CC, respectively.
3.6 Real samples analysis
To evaluate the practical application of PLL/CDP-MWCNTs/GCE, tap water as real sample for quantitative analysis of HQ and CC by standard addition method. The recoveries were 100.3-102.4% for HQ and 96.6-100.8% for CC, respectively (Table S1). Fig. S4 also showed the DPVs of added different concentration of HQ and CC in tap water sample. These satisfactory results indicated that the good modified platform of PLL/CDP-MWCNTs could be efficiently carried out for simultaneous determination of HQ and CC in real samples.
4. CONCLUSION
Based on electropolymerization of L-lysine (PLL), β-cyclodextrin polymer (CDP) and MWCNTs nanocomposites modified GCE, a realizable sensor was successfully designed to simultaneous determine HQ and CC. It showed that a well-separated peaks for HQ and CC, wide linear range and low detection limit were obtained. Additionally, the introduction of PLL availably eliminated the interference of background current, with the enhanced electrochemical signal of CDP and MWCNTs, the proposed electrode revealed successful sensitivity and selectivity towards HQ and CC. Also, the fascinating strategy provided an efficient and promising platform in electrochemical sensor application.
SUPPLEMENTARY MATERIAL:
Electrochemical behavior of modified electrodes
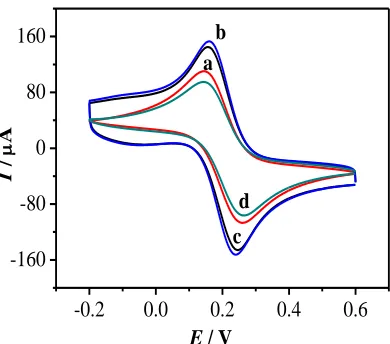
Cyclic voltammetry was to probe the packing structure and fully to catch these interface properties of the composite electrodes. As shown in Fig. S1, the CVs of bare GCE, MWCNTs/GCE, CDP-MWCNTs/GCE and PLL/CDP-MWCNTs in 5 mM [Fe(CN6)]3-/4- were demonstrated. A standard
-0.2 0.0 0.2 0.4 0.6
-160 -80 0 80 160
d
c b
I
/
A
[image:11.596.192.387.89.261.2]E / V a
Figure S1. Cyclic voltammograms of (a) bare GCE; (b) MWCNTs/GCE; (c) CDP-MWCNTs/GCE; (d) PLL/CDP-MWCNTs/GCE in 5mM [Fe(CN6)]3-/4- containing 0.1 M KCl.
Electrochemical behavior of HQ and CC at MWCNTs/GCE or CDP-MWCNTs/GCE
The electrochemical determination of HQ and CC was carried out at MWCNTs/GCE or MWCNTs/GCE (Fig. S2A and B). It can be seen that the peak currents of HQ and CC at MWCNTs/GCE were larger than the peak currents at MWCNTs/GCE, suggesting that the CDP-MWCNTs composites exhibited stronger electrocatalytic ability to HQ and CC. But a shoulder peak was apparently appeared at -0.1V in Fig.S 2A or 2B. Although CDP-MWCNTs and MWCNTs have an electrochemical catalytic effect on the oxidation of HQ and CC, a large overpotential at the modified GCE was seriously affected the detection of HQ and CC. With the decreasing concentrations of HQ and CC, the oxidation peak of 10×10-5 M (red line) and 3.0×10⁻⁵ M (black line) HQ and CC were gradually disappeared. If concentration was much smaller, the peak currents at -0.1 V would submerge the oxidation peak of HQ. So as contrast experiments, simultaneous determination of HQ and CC at low concentrations can not be realized at MWCNTs/GCE or CDP-MWCNTs/GCE.
Figure S2 (A) DPVs of (a) 3.0×10⁻⁵ M and (b) 10×10-5 M of HQ and CC at MWCNTs/GCE; (B) DPVs of (a) 3.0×10⁻⁵ M and (b)10×10-5 M of HQ and CC at CDP-MWCNTs/GCE.
The effect of scan cycles of L-Lysine on the determination of HQ and CC
The scan cycles of L-lysine from 5 to 25 cycles were investigated in Fig. S3. The electrochemical response of HQ and CC increased with increasing scan cycle up to 15 cycles, and then has no obvious
-0.4 -0.2 0.0 0.2 0.4 0.6 -50
-40 -30 -20 -10 0
I
/
A
E / V
MWCNTs/GCE
A
-0.4 -0.2 0.0 0.2 0.4 0.6 -50
-40 -30 -20 -10
I
/
A
E / V
CDP-MWCNTs/GCE
[image:11.596.118.467.529.671.2][image:12.596.104.478.157.320.2]
increase, but decreased from 15 to 20 cycles (Fig. S3A). This maybe attributed to the thickness of L-lys with more scan cycles increasing the impedance between electrode and solution. So 15 cycles were used as the PLL modification for the detection of HQ and CC. The Fig. S3B displayed the electropolymerization of L-lysine between 0.0 and 1.9 V for 15 cycles via CV.
Figure S3. (A) Effects of scan cycles on the oxidation peak currents for the determination of HQ and CC. (B) CVs of electropolymerization of 1.0 mM L-lysine solution for 15 cycles on GCE.
Real samples analysis
In order to evaluate the practical application of PLL/CDP-MWCNTs, tap water as real sample for quantitative analysis of HQ and CC by standard addition method. The recoveries were 100.3-102.4% for HQ and 96.6-100.8% for CC, respectively (Table S1). Fig. S4 showed the DPVs of added 10 μM HQ and CC (a), 30 μM HQ and CC (b), 50 μM HQ and CC (c) in tap water sample,respectively.These satisfactory results demonstrated that the good modified platform of PLL/CDP-MWCNTs could be efficiently carried out for simultaneous determination of HQ and CC in real samples.
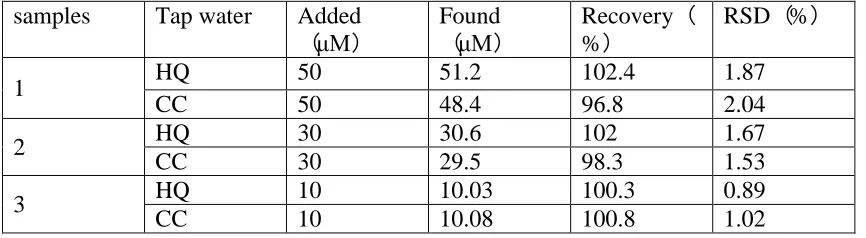
Table S1. Simultaneous determination results for HQ and CC in tap water sample samples Tap water Added
(μM)
Found
(μM)
Recovery( %)
RSD(%)
1 HQ 50 51.2 102.4 1.87
CC 50 48.4 96.8 2.04
2 HQ 30 30.6 102 1.67
CC 30 29.5 98.3 1.53
3 HQ 10 10.03 100.3 0.89
CC 10 10.08 100.8 1.02
5 10 15 20 25
-16 -15 -14 -13 -12 -11
I
/
A
HQ
scan cycles CC A
0.0 0.5 1.0 1.5 2.0 -600
-450 -300 -150 0 150
B
I
/
A
E / V
15th 1st
[image:12.596.84.517.517.636.2]
-0.4 -0.2 0.0 0.2 0.4 0.6
-20 -18 -16 -14 -12 -10 -8
c b
I
/
A
E / V
[image:13.596.181.396.91.263.2]a
Figure S4. DPVs of added different concentration of HQ and CC in real tap water sample. 10 μM HQ and CC (curve a), 30 μM HQ and CC (curve b), 50 μM HQ and CC (curve c).
ACKNOWLEDGEMENT
The authors are grateful for the Natural Science Foundation for Young Scientists of Hebei Province, China (B2015205169) and National Natural Science Foundation of China (41401562).
References
1. L. Tang, Y.Y. Zhou, G.M. Zeng, Z. Li, Y.Y. Liu, Y. Zhang, G.Q. Chen, G.D. Yang, X.X. Lei and M.S. Wu, Analyst, 138 (2013) 3552.
2. M.U.A. Prathap, B. Satpati, R. Srivastava, Sens. Actuators B, 186 (2013) 67. 3. X. Zhao, D.W. He, Y.S. Wang, Y. Hu, C. Fu, Chem. Phys. Lett., 647 (2016) 165.
4. T.C. Canevari, L. T. Arenas, R. Landers, R. Custodio and Y. Gushikem, Analyst, 138 (2013) 315. 5. B.L. Lee, H.Y. Ong, C.Y. Shi, C.N. Ong, J. Chromatogr. B, 619 (1993) 259.
6. Z. Lin, X.B. Sun, W.L. Hu, Y.Q. Yin, G.N. Chen, Electrophoresis, 35 (2014) 993.
7. Q.Y. Lu, H.X. Hu, Y.Y. Wu, S.H. Chen, D.H. Yuan, R. Yuan, Biosens. Bioelectron., 60 (2014) 325.
8. M.F. Pistonesi, M.S. Di Nezio, M.E. Centurion, M.E. Palomeque, A.G. Lista, B.S.F. Band, Talanta, 69 (2006) 1265.
9. J. Zhou, X. Li, L.L. Yang, S.L. Yan, M.M. Wang, D. Cheng, Q. Chen, Y.L. Dong, P. Liu, W.Q. Cai, C.C. Zhang, Anal. Chim. Acta, 899 (2015) 57.
10.J. Fu, X.H. Tan, Z. Shi, X.J. Song, S.H. Zhang, Electroanal., 28 (2016) 203.
11.D.M. Zhao, X.H. Zhang, L.J. Feng, L. Jia, S.F. Wang, Colloid. Surface. B, 74 (2009) 317.
12.P. Majzlik, A. Strasky, V. Adam, M. Nemec, L. Trnkova, J. Zehnalek, J. Hubalek, I. Provaznik and R. Kizek, Int. J. Electrochem. Sci., 6 (2011) 2171.
13.Y.L. Zhang, S.X. Xiao, J.L. Xie, Z.M. Yang, P.F. Pang, Y.T. Gao, Sens. Actuators B., 204 (2014) 102.
14.H. Jiang, D. Zhang, Z. He, Q. Lian, Z. Xue, X. Zhou, X. Lu, Anal. Lett., 48 (2015) 1426. 15.V.K. Khanna, Sensor Review., 28 (2008) 39.
16.X. Feng, W.W. Gao, S.H. Zhou, H.Y. Shi, H. Huang, W.B. Song, Anal. Chim. Acta, 805 (2013) 36. 17.K.L. Salipira, B.B. Mamba, R. W. Krause, T. J. Malefetse, S. H. Durbach, Environ. Chem. Lett., 5
18.L. Yang, H. Zhao, Y.C. Li, C.P. Li, Sens. Actuators B., 207 (2015) 1. 19.M. Zhu, S.B. Han, Z.B. Yuan, J. Electroanal. Chem., 480 (2000) 255.
20.L. Yang, S.M. Fana, G.H. Deng, Y.C. Li, X.Ran, H. Zhao, C.P. Li, Biosens. Bioelectron., 68 (2015) 617.
21.Y. Zhang, R. Yuan, Y.Q. Chai, W.J. Li, X. Zhong, H.A. Zhong, Biosens. Bioelectron., 26 (2011) 3977.
22.Z.Y.He, S. Zang , Y.J. Liu, Y. He, H.T. Lei, Biosens. Bioelectron., 73 (2015) 85.
23.Z. Guo, G.Q. Huang, J. Li, Z.Y. Wang, X.F. Xu, J. Electroanal. Chem., 759 (2015) 113.
24.L.Y. Yu, Q. Xu, D.Q. Jin, Q. Zhang, A.R. Mao, Y. Shu, B.Y. Yan, X.Y. Hu, Chem. Eng. J., 294 (2016) 122.
25.T. Thomas, R.J. Mascarenhas, O.J. D’Souza, P. Martis, J. Dalhalle, B.E.K Swamy, J. Colloid Interf. Sci., 402 (2013) 223.
26.M. Zhu, S. Han, Z. Yuan, J. Electroanal. Chem., 480 (2000) 255.
27.Y.H. Huang, Q. Han, Q. Zhang, L.J. Guo, D.M. Guo, Y.Z. Fu, Electrochim. Acta., 113 (2013) 564. 28.D.D. Zhang, L.Z. Li, W.N. Ma, X. Chen, Y.M. Zhang, Mater. Sci. Eng. C., 70 (2017) 241.
29.H.Q. Zhang, Y.H. Huang, S.R. Hu, Q.T. Huang, C. Wei, W.X., Zhang, W.Z. Zhang, P.H., Dong, A.Y. Hao, Electrochim. Acta., 176 (2015) 28.
30.H. Qi, C. Zhang, Electroanal., 17(2005) 832.
31.F.X. Hu, S.H. Chen, C.Y. Wang, R. Yuan, D.H. Yuan, C. Wang, Anal. Chim. Acta, 724 (2012) 40. 32.L.T.Wang, Y. Zhang, Y.L. Du, D.B. Lu, Y.Z. Zhang, C.M. Wang, J Solid State Electrochem., 16
(2012) 1323.
33.P. Yang, Q.Y. Zhu, Y.H. Chen, F.W. Wang, J. Appl. Polym. Sci., 113 (2009) 2881.
34.S.Q. Feng, Y.Y. Zhang, Y.M. Zhong, Y.C. Li, S.X. Li, J. Electroanal. Chem., 733(2014) 1.