S
TRATHCLYDE
D
ISCUSSION
P
APERS IN
E
CONOMICS
C
ONSTRUCTION OF A
M
ULTI
-S
ECTORAL
I
NTER
-R
EGIONAL
IO
AND
SAM
D
ATABASE FOR THE
UK
B
Y
G
RANT
A
LLAN
,
P
ETER
G
M
C
G
REGOR
,
J
K
IM
S
WALES
AND
K
AREN
T
URNER
N
O
.
04-22
D
EPARTMENT OF
E
CONOMICS
U
NIVERSITY OF
S
TRATHCLYDE
Construction of a multi-sectoral inter-regional IO and SAM
By
Grant Allan, Peter G. McGrego
Kim Swales and Karen Turner
Fraser of Allander Institute and Department of Economics,
Corresponding author:
[email protected]
database for the UK*
r, J.
University of Strathclyde
* The authors acknowledge the support of the ESRC (Grant No. L219252102) under the
Devolution and Constitutional Change research programme. We would like to thank members
of the Scottish Executive, the Welsh Economic Research Unit and Paul Caskie of the
Department of Enterprise Trade and Investment in Northern Ireland for help in accessing
1. Introduction
The purpose of this paper is to explain the construction of the input-output (IO) and social
accounting matrix (SAM) databases for the inter-regional computable general equilibrium
(CGE) model of the UK developed as part of the project ‘An Analysis of National and
Devolved Economic Policies’ undertaken as part of the ESRC Devolution and Constitutional
Change research programme.
We identify four main regions of the UK: Scotland, Wales, Northern Ireland and England.
However, in Section 2, we begin by constructing a set of two-region accounts where we focus
on Scotland, Wales or Northern Ireland with the other aggregate ‘region’ labelled ‘rest of the
UK’ or RUK. Then, in Section 3, we extend to a three-region framework where we identify
Scotland, Wales and RUK. Finally, in Section 4, we extend further to construct the full
4-region IO and SAM.
The main problems we encounter relate to data availability, in particular the absence of recent
analytical IO tables and inter-regional trade data for the UK, but also the absence of any form
of IO accounts for Northern Ireland. Another key issue is problems of consistency between
regional and national data. These problems are discussed in more detail at appropriate points
throughout the paper and summarised in the conclusions in Section 5.
2. Two-region IO and SAM accounts
This section outlines the data requirements and methods used to generate two-region IO tables
and SAM. The basic approach is then extended to the multi-region case. We begin with the
IO tables, which are then augmented with information on income flows between the main
aggregate transactors to construct the SAM.
2.1 Data requirements for the inter-regional IO table
Insert Figure 1a
Figure 1a shows the schematic structure of the 2-region IO framework (for the example of
Scotland-RUK). The columns show the inputs of production sectors and expenditures by final
consumers in each of the two regions and ROW export demand. The rows show the
and primary inputs. It is useful to consider the data requirements in terms of a set of use
matrices, so that to construct an inter-regional IO framework for Scotland (or any other UK
region) and RUK we ideally require (all for a common base year):
1. A set of symmetric (i.e. product-by-product, PxP, or industry-by-industry, IxI) analytical
IO tables (reported in basic/producer prices) for the national (UK) economy for the
chosen base year. This gives us a matrix , showing local intermediate and final
consumption of UK production (superscripts denote the producing region and subscripts
to denote the consuming region.) It also gives us the primary input matrix and the
column vector of external final consumption demand from the rest of the world (ROW)
for UK production (exports to ROW), .
UK UK
M
UKF
( ) UK i ROW c2. A compatible set regional (Scottish) IO tables (i.e. for the same base year and sectoral
breakdown). This gives us the matrix
M
SSof Scottish intermediate and final consumptionof Scottish production – the local demand matrices in Figure 1a - as well as the primary
input matrix and a column vector of Scottish exports to ROW, (and
subtracting these from and respectively gives us and ).
However Scottish consumption of RUK goods and services is given in a single row vector
of imports, , and RUK consumption of Scottish goods and services is given in a
single column vector of exports, .
S
F
ci ROWS( )) ) )
UK
F
( UK i ROWc
F
RUK ( )RUK i ROW c RUK S
m
( S i RUK c 13. To determine the matrix, , of Scottish intermediate and final consumption of the
RUK production – the Scottish imports from RUK matrices in Figure 1a - we need data
that disaggregate the imports vector in the Scottish IO table in terms of the i=1,..,I
RUK production sectors.
RUK S
M
RUK Sm
4. Similarly, to determine the matrix, , of RUK intermediate and final consumption of
the Scottish production, we need data that disaggregate the exports vector in the
Scottish IO table in terms of the i=1,..,I production sectors and z=1,..,Z final consumption
groups in RUK.
S RUK
M
( S i RUK c 12.2 The UK (national) IO table
Our first problem is that analytical IO tables are not produced for the UK on a regular basis,
with only annual PxI Supply-Use Tables (SUT) reported in purchaser prices being publicly
available. That is to say, there are problems in even establishing the UK Use matrices,
and and the aggregate ROW export demand vector, .
UK UK
M
F
UK UK( )i ROW
c
The most recent set of analytical IO tables for the UK were produced for 1995 (National
Statistics, 2002), a year for which Scottish and Welsh IO tables are not available. In order to
convert the UK SUT for any year to analytical IO format, data are required on commodity
taxes, distribution margins and sectoral imports. This allows production of a PxI IO table,
which can then be converted to PxP or IxI format using the make matrix. However, due to
confidentiality constraints, the ONS do not make the commodity tax, distribution margin and
make matrixes public so we are unable to make the required conversions. Therefore, the
option we have chosen at this time is to take information on gross industry outputs and final
demand expenditures from the 1999 SUT and use these to mechanically roll forward the 1995
IO tables forward to estimate a UK industry-by-industry domestic flows matrix in basic prices
for 1999, which is the most recent year for which Scottish IO tables are available.2
However, there is a problem with this approach that we have not yet overcome. The control
total data that are suitable for rolling forward the 1995 analytical tables are the column totals
of the 1999 SUT, which give industry gross outputs. However, only PxI and PxP tables are
available for 1995. We cannot roll forward the PxP tables because the SUT only give product
gross outputs in purchaser prices and do not distinguish imports and locally produced goods.
Therefore, what we have done in the first instance is roll forward the 1995 PxI tables, and
then used a mechanical balancing programme to produce an IxI table.3 This means that we are
allowing the programme to randomly reallocate products to industries, rather than
systematically reallocating the off-diagonal entries of the make matrix (of which we have no
knowledge). This is obviously unsatisfactory and we hope to find alternative data to allow
something more systematic.
2
The 1999 Scottish IO tables (Scottish Executive 2002), are consistent with the version of the 1999 UK SUT reported in the 2001 Blue Book (National Statistics, 2001). (Note, though, that there may be some differences in accounting conventions at the regional and national levels.) As we explain below, Welsh IO tables are available for 2000 rather than 1999. However, due to the greater degree of compatibility between the Scottish and UK national accounts, we choose our base year on the basis of the availability of Scottish IO tables. Note also that since the work reported here was carried out, Scottish IO tables for 2000 have actually become available. We intend to update the whole UK inter-regional framework to the base year of 2000 in future work.
3
2.3 Two-region IO table for Scotland-RUK
The second data requirement for construction of a Scotland-RUK IO table is an
industry-by-industry regional IO table for Scotland in analytical and consistent format with the national
IO table. This directly gives us the Scotland-Scotland use matrix,
M
SS, which we split intothe (IxI) matrix of local intermediate demands from Scottish production sectors,
X
SS, and the(IxZ) matrix of local consumption demand by Scottish final demand groups, . It also
gives us the matrix of Scottish use of primary inputs (value added and net product and
production taxes), which we split into and for intermediate and final
consumption respectively. Finally it gives us the vector of Scottish exports to ROW, .
All of these elements directly enter the Scotland-RUK inter-regional IO table (see Figure 1b).
The RUK elements, , and can also be determined by subtracting
Scottish exports to ROW and primary input use from the corresponding elements from the
UK IO table.
( , )
S i z S
C
S
F
( , )i S
F
F
( , )z S( ) S i ROW c ( ) RUK i ROW
c
F
( ,i RUK)F
( ,z RUK)Insert Figure 1b
However, no published data are available to allow us to determine the inter-regional trade
matrices , which we split into the (IxI) sub-matrix of imports from RUK to
Scottish intermediate consumption demand, and the (ZxI) sub-matrix of imports from
RUK to Scottish final consumption demand, and , which we split into the
sub-matrics and of Scottish exports to, respectively, RUK intermediate and final
consumption demand. Therefore we must estimate these matrices.
RUK S
M
X
SRUK( , )
RUK i z S
C S RUK
M
S RUKX
Ci z RUKS( , )In the case of , the Scottish Executive has kindly given us permission to use
experimental (and unpublished) information on Scottish sectoral imports from RUK 1999.
These data are consistent with the row vector of Scottish imports from RUK, , from the
1999 industry-by-industry Scottish IO table. However, these data are reported in terms of
RUK products imported by Scottish industries and final demand sectors – i.e. PxI, rather than
the symmetric PxP or IxI. In the first instance, we have attempted to overcome this by
adjusting the row totals (total imports to Scotland of each RUK product) of the Px(I+Z)
imports matrix provided by the Scottish Executive using the ratio of the output of each RUK
industry to the corresponding product output (taken as the difference between UK product
outputs from the estimated PxI table for 99 – see Section 2.2 – and Scottish product outputs
from the PxP version of the 1999 Scottish IO table) to convert the row totals from commodity
to industry outputs. We then use the RAS mechanical balancing programme to adjust the
matrix to the revised row totals. Again, as with the conversion of the estimated 1999 UK IO
table from PxI to IxI format in Section 2.2, this means that we are allowing the programme to
randomly reallocate products to industries. It would, of course be preferable to do this more
systematically using make matrix data, were this publicly available.
Together the matrices
M
SS, taken directly from the Scottish IO table, and , estimatedas described above, give us the Scottish-UK Use matrix, . The RUK-UK use matrix,
, can be calculated by subtracting the Scottish-UK Use matrix from the UK local use
matrix, . However, for the inter-regional framework it is necessary to split the RUK-UK
Use matrix, , into the sub-matrices (= ) and
(= ) that identify RUK intermediate and final consumption of, respectively,
local (RUK) and imported Scottish goods and services.
RUK S
M
UK SM
UK RUKM
UK UKM
UK RUKM
M
RUKRUK XRUKRUK+Ci z RUKRUK,( , )M
RUKS( , )
S S
RUK i z RUK
X +C
The problem is that no are no data available to identify – imports to RUK industries
and final consumers from Scottish production sectors. The Scottish IO tables tell us the value
of exports to RUK from each Scottish industry in the column vector . What is missing
is the destination of these exports in terms of which RUK production or final demand sectors
purchase them, either as intermediate inputs or as final consumption goods. Our next step,
then, is to attempt to estimate the RUK-Scotland Use matrix, , using what data we do
have from the Scottish and UK IO tables (including the aggregate RUK-UK Use matrix,
). S RUK
M
( S i RUK c ) S RUKM
UK RUKM
The method we have applied to identify is to take the ratio of exports to RUK from
each Scottish sector, i, to total RUK use of UK sector i outputs. We then apply this to each
RUK production and final demand sector’s use of UK sector i outputs. This means we are
assuming that, in using goods and services from UK sector i for intermediate or final
consumption, each RUK sector makes the same proportionate use of Scottish or RUK outputs.
S RUK
For example, in the case of Primary commodities (see the 10-sector breakdown in Table 1
below), the ratio of Scottish produced commodities to total RUK use is
Scottish Primary exports to RUK (Scottish IO table)
Total RUK use of UK Primary commodities (Primary row total, RUK use)
= 0.0527
Therefore, we assume that each RUK production sector, i, and final consumption sector, z,
purchases 5.3% of the UK-produced Primary inputs it uses from Scotland. When we sum
along each row of the resulting matrix, the totals are equal to the RUK exports entries from
the Scottish IO table (i.e. the elements of the column vector ). However, in order to
balance the Scottish rows in the inter-regional IO table across ( S i RUK c ) S S
M
and there is onefurther adjustment in the Scotland-RUK case. The Scottish IO tables identify an additional
type of export demand: tourist expenditure by visitors from RUK and ROW. Therefore, we
must add (estimated) RUK tourist expenditure in Scotland to the RUK households column.
S RUK
M
Once we have estimated RUK-Scotland Use matrix, , we take this away from the
RUK-UK use matrix, to get the unbalanced RUK-RUK Use matrix, . This
matrix is slightly unbalanced because of the adjustment made above in allocating tourist
expenditure by RUK residents in Scotland to the household vector of ( ). This
is because the Scottish IO tables are unique in the UK in identifying tourist expenditure as a
separate category of final consumption demand. In the UK IO tables local tourist expenditure
(i.e. UK residents visiting other UK regions) is allocated to households, and in Wales, RUK
tourist expenditure is allocated to RUK exports. In allocating tourist expenditure by RUK
households in Scotland to a minor imbalance is introduced because of the
differences in accounting conventions so we need to make some adjustments to balance the
system. First of all, we need to add the imports from RUK to RUK tourist expenditure
recorded in the Scottish imports matrix to the RUK household expenditure column in
. Then we take the resulting matrix and use the RAS programme to balance it to the
row and column totals required to balance the use matrix – i.e. the row/column total
from the UK IO table minus the row/column total in the Scottish IO table for each production
and final demand sector.
S RUK
M
UK RUK
M
M
RUKRUKS RUK
M
Ci z RUKS( , )( , )
S i z RUK
C
( , )
RUK i z RUK
C
RUK RUK
2.4 Two-region IO table for Wales-RUK
For the Wales-RUK case corresponding data components were available – i.e. the estimated
UK IO table for 1999, region-specific analytical Welsh IO tables and data on
imports-by-commodity. However, the latter two are available for 2000 rather than 1999 (the previous set
of tables are for 1996). Therefore, we had to estimate the 1999 Welsh IO table and
imports-by-commodity data by rolling back the corresponding 2000 data constructed by WERU
(Bryan et al, 2004). We did this using control total data on sectoral outputs, primary inputs
and final demand expenditures provided by WERU.
The Wales-RUK IO tables are constructed by following the same process as outlined above
for Scotland-RUK. There is one difference, though. As noted above, tourist expenditure is not
identified as a separate category of final demand in the Welsh IO tables. Therefore, the
additional stages to balance the use matrix are not required. That is to say, is
derived by simply subtracting from without any further adjustments or RAS
application.
RUK RUK
M
M
RUKRUKW RUK
M
M
UKRUKIn using the Welsh IO tables as a component in our inter-regional UK framework, however,
we must be aware of potential problems of compatibility and consistency with the UK and
Scottish tables. The basic issue is that while the UK national IO accounts and Scottish
regional tables are both based on the same survey carried out by the Office for National
Statistics, the Annual Business Inquiry (ABI), WERU do not have access to this source in
constructing the Welsh IO tables. Instead, WERU conducts an independent industry survey
for the production side of the table. In estimating final demands, use is made of data on the
purchasing patterns of Welsh Households from the Family Expenditure Survey published by
ONS, and for other categories of final demand adjusted UK IO data are used. Fuller details
are given in Bryan et al (2004). However, the key point here is that, unlike the case of
Scotland, the Welsh IO tables are constructed without the co-operation of the UK Office for
National Statistics.
2.5 Two-region IO table for NI-RUK
In the case of Northern Ireland, the situation is somewhat worse, in that no official (or, to our
knowledge, unofficial) IO tables are available. Therefore we have had to estimate an
analytical IO table for Northern Ireland (NI) in 1999 in a format consistent with the Scottish
of the NI table are given in the Appendix. Here it is sufficient to state that we took what
control total data were available and used the input coefficients from the Welsh IO for 1999
(aggregated to 3 sectors) to estimate the 4 quadrants of the IO matrix for NI in 1999.
To construct the NI-RUK 2-region IO we adopt the same method as described in Section 2.3
for Scotland-RUK (and Wales-RUK), with one exception. No data on RUK
imports-by-commodity are available for NI. Therefore, we derive the matrix using coefficients
from the corresponding Welsh matrix, , to determine the commodity composition of
RUK imports in the NI IO. Thereafter we follow the steps as outlined in Section 2.3 to
determine the RUK use matrices for the NI-RUK case.
RUK NI
M
RUK W
M
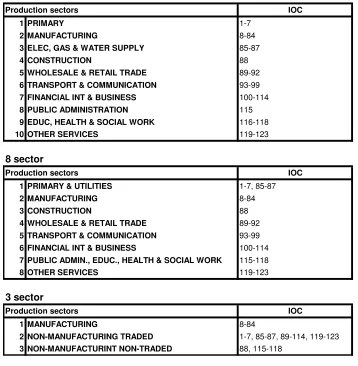
2.6 Sectoral breakdown
Both the Scotland-RUK and Wales-RUK 2-region IO tables have initially been constructed at
the 10 sector/commodity breakdown shown in the first box in Table 1. However, in the case
of Wales-RUK, the 10-sector IO table has negative entries in RUK GDFCF in the ‘Electricity,
gas and water supply’ and ‘Education, health & social work’ sectors. This is because of
differences in accounting conventions: the Welsh IO records entries for output to GDFCF in
these sectors, while the (estimated) UK IO table does not. Therefore we identify an alternative
8-sector aggregation in the second box of Table 1. This is the sectoral breakdown at which the
3-region (Scotland-Wales-RUK) IO table is constructed in Section 3 below.
However, the inter-regional CGE modelling framework that uses the inter-regional IO and
SAM tables as its core database only identifies 3 production sectors/commodities. The
3-sector breakdown is identified in the bottom box in Table 3. Because we have to entirely
estimate the inter-sectoral transactions in the Northern Ireland IO table, we limit the sectoral
breakdown of this and the NI-RUK IO framework to the 3-sector breakdown required for the
model.
All of the inter-regional IO tables constructed for this project are available on request from
the corresponding author.
As with a single region SAM (e.g. Turner, 2002) we construct an inter-regional SAM using
data from the inter-regional IO tables (above) and from income-expenditure accounts for the
two regions in question.
Before discussing the income transfer data in the income-expenditure accounts, note that one
adjustment is required to the IO data in the SAM framework used for the AMOSUK model.
In the inter-regional IO tables we record net product (commodity) and production taxes in a
single row (in the primary inputs/value added block). In the SAM we split this so that in each
region commodity taxes paid on goods imported from the other region are paid to a net
commodity tax account (and subsequently the government account) in the exporting region.
In the case of net commodity taxes paid on regional exports (from Scotland/Wales/NI) to
RUK, the inter-regional IO tables give an aggregate figure. In the absence of better
information, we split this across RUK production and final demand sectors according to the
distribution of exports to RUK (imports from Scotland/Wales/NI). For net commodity taxes
on regional imports from RUK, we have to strip these out of the existing net product and
production taxes in the inter-regional IO table. The residual is then allocated to
Scottish/Welsh/NI payments to the own-region commodity tax account. Note that this process
means that the income to Scottish/Welsh/NI government from commodity taxes is lower than
in the single region SAM, with the difference being reallocated through RUK government
transfers to Scottish/Welsh/NI government. The final set of net commodity tax entries are
from RUK producers and consumers to the RUK commodity tax account. These are
determined the commodity tax entries for RUK producers and consumers minus the payments
(above) to the Scottish/Welsh/NI commodity tax account relating to Scottish/Welsh/NI
exports to RUK.
The remaining SAM entries, recording income transfers between the aggregate/institutional
transactors, are determined using the income-expenditure account method. The intra-regional
entries are identical to what they would be in a single region SAM. Inter-regional transfers are
also recorded in single region income-expenditure accounts, as transfers to or from RUK in
the single region household, government and corporate accounts. In the inter-regional SAM
these transfers are recorded as intra-agent UK transfers – e.g. Scottish households to RUK
households, Scottish (Welsh) government to RUK government etc. There are no inter-agent
UK transfers (i.e. no Scottish household to RUK government etc) in the inter-regional SAM
(note that the opposite is true in the case of region transfers, where there are no
Following the method adopted so far, payments to the Scottish/Welsh/NI capital account from
RUK should flow from RUK capital to Scottish/Welsh/NI capital and correspond to the
‘transfers from RUK’ entry in the single region capital income account. This is the way these
transfers are recorded in the inter-regional SAM attribution analyses in Allan et al (2004) and
McGregor et al (2004). However, the AMOS model identifies variables for payments to
capital in the other region by households, government and corporate. Therefore, here, for
example, we split the RUK to Scottish/Welsh/NI capital entry over RUK households,
government and corporate spending according to the distribution of total savings by these
transactors. This is offset in the RUK capital account when these amounts are reallocated out
of the corresponding entries in the Scottish/Welsh/NI capital row.
The remaining intra-UK income transfers are between RUK transactors. As the definition of
RUK differs across the different 2-region and 3- and 4-region cases we have to construct an
RUK expenditure account for each case. We do this by constructing a set of
income-expenditure accounts (and SAM) for the UK and taking all RUK-RUK entries as the
difference between the corresponding UK and other region income-expenditure account
entries. All inter-regional transfers are already determined from the other region
income-expenditure accounts.
The final income transfer entries in the inter-regional SAM are those to and from ROW. In
the case of Scotland/Wales/NI these are taken from the single region income-expenditure
accounts. In the case of RUK these are equal to the UK SAM entries minus those for the other
regions.
As with the inter-regional IO tables, all the SAM accounts constructed for this project are
available on request from the corresponding author.
3.
Three-region IO and SAM accounts
3.1 The 3-region IO
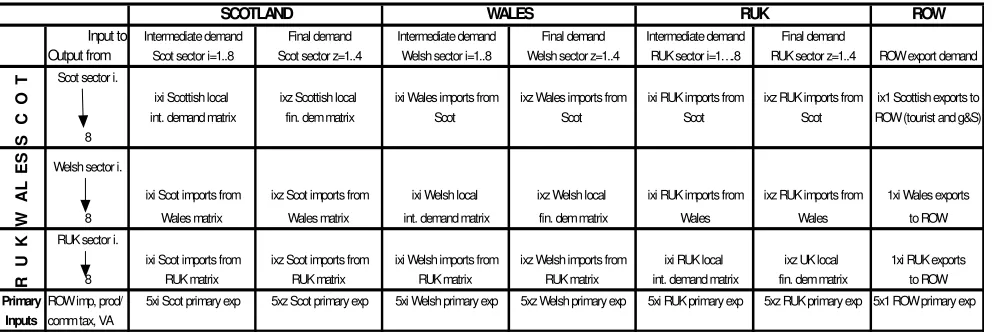
Figure 2a shows the schematic structure of the 3-region IO framework
(Scotland-Wales-RUK). All but the inter-regional trade flows and the RUK-RUK use matrix are determined
from the existing UK, Scottish and Welsh single region IO tables and/or the Scot-RUK and
The Scottish Use Matrices (column entries)
The Scottish local intermediate and final demand matrices,
X
SS and respectively inFigure 2b, which combine to give the Scotland-Scotland use matrix, ( , )
S i z S
C
S S
M
, are given by the1999 Scottish IO table and correspond to their counterparts in the 2-region system in Figures
1a and 1b. Similarly, the Scottish primary expenditure matrices, and , are also
given by the Scottish IO table and correspond to their counterparts in the 2-region system.
However, the Scottish imports from the rest of the UK matrices for the 3-region case – i.e.
imports from Wales,
( , )i S
F
F
( , )z SW S
X
and , and from RUK, and - need to beseparated in the existing imports from RUK matrix, in Figure 1b (2-region
Scotland-RUK case), where the latter is derived from the experimental commodity-by-industry data
supplied by the Input-Output team at the Scottish Executive. ( , )
W i z S
C
X
SRUK Ci z SRUK( , )RUK S
M
The Welsh Use Matrices
Similarly, the Welsh local intermediate and final demand matrices and the primary
expenditure matrices are given by the estimated 1999 Welsh IO table and correspond to their
counterparts in the 2-region Wales-RUK system. However, the Welsh imports matrices –
imports from Scotland,
X
WS and , and from RUK, and in Figure 2b -need to be separated in the existing imports from RUK matrix, in Figure 1b (2-region
Wales-RUK case), where the latter is derived from the experimental commodity-by-industry
data supplied by WERU.
( , )
S i z W
C
X
WRUK Ci z WRUK( , )RUK W
M
The RUK Use Matrices
Unlike the Scottish and Welsh cases, we cannot take the RUK local intermediate and final
demand matrices - where = - from the existing 2-region systems.
This is because RUK is defined differently in each of the 2-region cases and in the 3-region
case. As in the 2-region case outline in Section 2, we can determine the total RUK-UK use
matrix, at this stage, but need to determine inter-regional trade flows first, with
being the residual (i.e. ).
RUK RUK
M
RUK RUK,( , )RUK i z RUK
X +C
UK RUK
M
M
RUKRUKRUK UK S W
RUK RUK RUK RUK
However, the RUK primary expenditure matrices, and , can be determined
from the existing single and 2-region IO data, as the residual after taking the Scottish and
Welsh entries away from those in the UK IO table – i.e. ( ,i RUK)
F
F
( ,z RUK)RUK UK S W
F
=
F
−
F
−
F
.The ROW Use Matrices
The vectors of Scottish and Welsh exports to ROW, and respectively in
Figure 2b, are given by the Scottish and Welsh IO tables for 1999 and correspond to their
counterparts in the 2-region system. The vector of RUK exports to ROW, can also be
determined from the existing single and 2-region IO data, as the residual after taking the
Scottish and Welsh entries away from those in the UK IO table – i.e.
. Finally the vector of ROW primary expenditures in the
UK, , is given by the corresponding entries in the UK IO table. (
S i ROW
c ) )
) ) ( W i ROW c ( RUK i ROW c ( ) ( ) ( ) (
RUK UK S W
i ROW i ROW i ROW i ROW
c =c −c −c
ROW
F
The unshaded cells in Figure 2b indicate all the matrices we can derive directly from the
single and 2-region IO frameworks as described above. The grey shaded cells indicate the
matrices that need to be derived separately. We do this in 5 steps:
1. Scottish imports from Wales and RUK
First, we complete the set of Scottish Use matrices. This involves separating the matrices
W S
X
, , and from the estimated matrix of Scottish imports from the restof the UK in the 2-region Scotland-RUK table (i.e. in Figure 1b). The method we have
applied to do this is to take the ratio of output production in Wales for each sector i to total
Welsh plus RUK sector i output (Welsh plus RUK sector i output corresponds to sector i
RUK output in the Scotland-RUK 2-region framework). We then apply this ratio to each
Scottish production and final demand sector’s use of Welsh plus RUK imports (i.e. imports
from RUK in the 2-region case, given by in Figure 1b). This means that, in using
imported UK sector i goods and services, each Scottish sector makes the same proportionate
use of Welsh or RUK outputs, based on the total output shares of the Welsh and RUK sector.
For example, in the case of Primary commodities, the ratio of Welsh produced commodities
to total Primary production in the rest of the UK (Wales+RUK) is ( , )
W i z S
C RUK
S
X
( , )RUK i z S
Welsh Primary sector gross output
Welsh Primary sector gross output plus RUK Primary sector gross output
= 0.0529
Therefore, we assume that each Scottish production sector, i, and final consumption sector, z,
purchases 5.3% of its UK imports of Primary goods and services from Wales and the
remaining 94.7% from RUK. Doing this for all I=8 imported goods and services gives us the
matrix
M
WS , which in turn is split intoX
WS and Ci z SW( , ) in Figure 2b. Then, by subtractingW S
M
from the 2-region version ofM
SRUK, or by subtracting W SM
plusM
SS from the totalScottish-UK use matrix, , we get the new (3-region version) matrix of Scottish
imports from RUK.
UK S
M
M
SRUK2. Welsh imports from Scotland and RUK
The set of Welsh Use matrices –
M
WS ,M
WW and - which form the Welsh columnentries in Figures 2a and 2b - is determined by following the same steps as outlined above for
Scotland.
RUK W
M
3. Scottish exports to RUK
Note from Figure 2a that, reading along the rows of the 3-region IO, the estimation of the
matrix
M
WS in Step 2 gives us Scottish exports to Wales. From the single/2-region IO tableswe already have Scottish output going to Scottish producers and consumers,
M
SS, andScottish exports to ROW, . Therefore, the residual matrix in the Scottish row block is
the exports to RUK, or the RUK-Scotland use matrix, . This can be determined by one
of two methods. In the first instance, we attempted to calculate as indicated in Figure
2b. That is, we subtract the Wales-Scottish use matrix, (
S i ROW
c )
S RUK
M
S RUK
M
S W
M
, from the Scotland to RUKexports matrix from the 2-region Scotland-RUK system. This appeal of this method is that the
3-region framework is numerically consistent with both the Scotland-RUK and Wales-RUK
2-region systems in that the former is simply a more disaggregated version of the latter.
However, it results in several negative entries in the inter-regional trade matrix . This is
due to the general problem highlighted already in this paper: inconsistency in accounting
S RUK
methods and data sources at the national and regional levels in the UK. This problem is
compounded by the fact that we have had to estimate the Welsh and UK IO tables for 1999
(by rolling back/forward analytical tables constructed for other years) and the inter-regional
trade flows matrices (using experimental imports-by-commodity data for Scotland and
Wales).
Therefore, we use a second method to estimate the residual matrix in the Scottish
output rows. This is consistent with the method used to estimate in the 2-region case
(see Section 2.3), where we take the ratio of exports to RUK from each Scottish sector, i, to
total RUK use of UK sector i outputs and apply this to each RUK production and final
demand sector’s use of UK sector i outputs. The difference in the 3-region case is that the
vector of Scottish exports to RUK, , is not taken directly from the Scottish IO table.
Instead we are taking account of the estimated data on Welsh use of Scottish commodities
with
S RUK
M
S RUK
M
(
S i RUK
c )
S W
M
before we enact this assumption regarding Scottish exports to the rest of the UK(England and Northern Ireland). Therefore the ratio for calculating exports from each Scottish
sector i to RUK in the 3-region case (see Section 2.3) to each production sector i and final
consumption sector z becomes
Sector i exports to RUK (Scottish IO table) minus sector i exports to Wales
Total RUK use (England and NI) use of UK sector i commodities
4. Welsh exports to RUK
The RUK-Wales Use matrix, , is estimated using the same process as explained for
Scottish export to RUK in Step 3. Again, using the first method, which means that the
3-region framework is numerically consistent with the 2-3-region Wales-RUK IO table – i.e.
where we subtract the Scotland-Wales use matrix,
W RUK
M
W S
M
(see Step 1) from the Wales to RUKexports matrix from the 2-region Wales-RUK system. However, as is the case with Scottish
exports to RUK in Step 3, this results in negative entries in the resulting residual matrix,
. Therefore we adopt the second method, which, while it is not numerically consistent
with the 2-region system, it is consistent in terms of the method used to estimate exports to
RUK (where RUK is defined differently due to the identification of Scotland as a third trading
region).
W RUK
5. The RUK-RUK use matrix
Once Steps 1-4 are completed, Figure 2a and 2b show that only one matrix in the 3 region IO
framework remains to be calculated. As in the two-region case, this balancing matrix is the
RUK-RUK use matrix, . In steps 3 and 4 we have determined the matrices and
showing RUK imports from the other UK regions. Therefore, we can calculate
as the residual of the RUK-UK use matrix (i.e. ).
RUK RUK
M
M
RUKSW RUK
M
M
RUKRUKRUK UK S W
RUK RUK RUK RUK
M
=
M
−
M
−
M
This completes and balances the 3-region IO table (note that no RASing is required as we are
simply splitting down matrices already determined in the single and two-region IO tables). As
with the 2-region tables, the 3-region IO table is available on request from the corresponding
author.
3.2 The 3-region SAM
As in the single and 2-region case the 3-region SAM takes data from the 3-region IO table
and from income-expenditure accounts for the each of the 3-regions. Here we need to: (a)
split RUK transfers in the Scottish and Welsh income-expenditure accounts into transfers to
and from RUK and Wales in the Scottish case and RUK and Scotland in the Welsh case; (b)
create a new RUK income-expenditure account for the 3 region framework.
As in the 2-region case, before discussing the income transfer data in the income expenditure
accounts one adjustment is required to the IO data in the SAM framework used for the
AMOSUK model. We need to split the single net product and production tax row in the
3-region IO table to allow taxes paid on goods and services imported from other UK 3-regions to
be recorded as going to the net commodity tax and government accounts in the exporting
region. However, we have already separated net commodity taxes on domestic purchases
from aggregate UK imports in the 2-region case for the Scotland-RUK and Wales-RUK
cases. Therefore, all that we have to do here is separate these according to the split in imports
determined in steps 1 and 2 in Section 3.1 above. Then the net commodity taxes paid on
Scottish and Welsh exports to RUK are determined as in the 2-region case – i.e. according the
distribution of exports from Scotland and Wales to RUK, rather than on the distribution of
imports. The product and production taxes paid by RUK in RUK are the residual entries
The remaining SAM entries, recording income transfers between the aggregate/institutional
transactors are again determined using the income-expenditure account method. Basically the
Scotland-Scotland and Wales-Wales entries are taken from the 2-region income-expenditure
accounts. However, here we need to split transfers to and from RUK in the Scottish and
Welsh accounts into Wales and RUK in the Scottish case and Scotland and RUK in the Welsh
case. Note that we only split the RUK transfer entries in the case of the household and
corporate accounts. In the case of governmental transfers (remember that all
inter-regional transfers, except capital, are intra-agent flows), we assume that these will between
the devolved administrations of Wales and Scotland and central government located in
England (the main part of RUK, along with Northern Ireland in the 3-region framework). For
the split in the RUK transfers in the household accounts, we base this on the expenditure
entries in the Scottish and Welsh accounts, which are estimated transfers of wage income.
Therefore, we estimate the income from Scotland and Wales to the Welsh and Scottish
income accounts respectively based on the share of RUK wage income that is generated in
Scotland and Wales. Transfers to Scottish and Welsh households also include dividends etc
but here we assume these come from RUK. The split in inter-regional transfers in the
corporate accounts is done on the basis of regional shares in the generation of other
value-added.
In the case of the capital account, as in the single and 2-region cases, positive income
transfers from any one region into the capital account of another are not allocated as capital-
to-capital intra-agent transfers. Instead they are reallocated from the own-region capital
account entries for households, government and corporate based on the distribution of savings
across these transactors in the income-expenditure account of the home-region.
As in the 2-region case the remaining intra-UK income transfers are between RUK
transactors. To determine these entries we again use the income-expenditure accounts
constructed for the UK national economy and take the RUK-RUK entries as the residual after
subtracting the corresponding Scottish and Welsh entries from each RUK one. All
inter-regional transfers are already determined from the Scottish-RUK and Welsh-RUK transfers in
the 3-region versions of the Scottish and Welsh income-expenditure accounts.
The final income transfer entries in the 3-region SAM are those to and from ROW. For
Scotland and Wales, these correspond to the 2-region entries in each of these cases and the
RUK entries will again be the residuals after subtracting the Scottish and Welsh entries from
The 3-region income-expenditure accounts and SAM are available from the corresponding
author on request.
4.
Four-region IO and SAM accounts
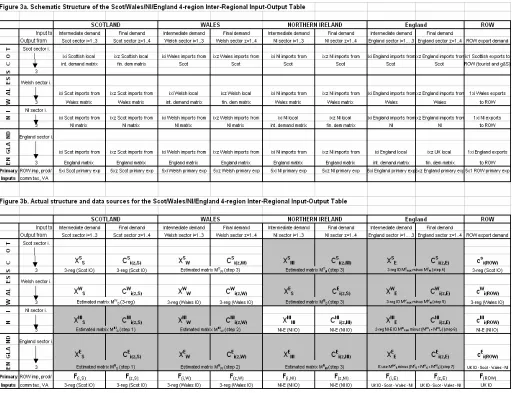
4.1 The 4-region IO
Constructing the 4-region IO involves extending the framework illustrated in Figure 2a to that
shown in Figure 3a. The additional data/estimation requirements are identified in Figure 3b.
Note that the 4-region database is limited to the 3-sector breakdown in the bottom box in
Table 1 (the sectoral breakdown that the 4-region CGE model is specficied for).
The unshaded cells in Figure 3b indicate all the matrices that have already been determined
through the single and 3-region IO frameworks. The grey shaded cells indicate the matrices
that need to be derived separately. These are the Northern Ireland (NI) use matrices from the
other 3 UK regions and the England use matrices (the ‘residual’ region RUK is redefined as
‘England’ in the 4-sector tables). We follow the same basic approach as described in Section
3.1 for the 3-region IO tables and estimate these matrices in 7 steps:
1. Scottish imports from NI and RUK
The 3-region tables give us Scottish imports from Wales and from RUK, where the latter
includes England and NI. For the 4-region framework we have to separate imports from NI
and England – i.e. identify the matrices
M
SNIandM
SE for the Scottish use columns in Figure3b. We adopt the same method as reported in to separate imports to Scotland from Wales
from other RUK in the construction of the 3-region tables in Section 3.1 above. That is, we
take the ratio of output production in NI for each sector i to total NI plus England sector i
output (or 3-region RUK sector i output). We then apply this to each Scottish production and
final demand sector’s use of NI plus RUK imports (i.e. imports from RUK in the 3-region
case). Therefore, because we use the same method to derive
M
SW in Section 3.1, in usingimported UK sector i goods/services, Scottish production and final demand sectors make the
same proportionate use of Welsh, NI or RUK outputs, based on the total output shares of the
Welsh, NI and RUK sectors. For example, in the case of Primary commodities, in the
4-region calculation the ratio of NI produced commodities to total Primary production in the
NI Primary sector gross output
NI Primary sector gross output plus England Primary sector gross output
= 0.0364
Therefore, we assume that each Scottish production sector, i, and final consumption sector, z,
purchases 3.6% of its (3-region) RUK imports of Primary goods and services from NI and the
remaining 94.7% from England. Doing this for all i=3 imported goods and services gives us
the matrix
M
SNI , which in turn is split intoX
SNI and in Figure 3b. Then, bysubtracting
( , )
NI i z S
C
NI S
M
from the 3-region version ofM
SRUK, or by subtracting NI SM
plusM
WS plusS S
M
from the total Scottish-UK use matrix,M
SUK, we get the matrixM
SE of Scottish importsfrom England.
2. Welsh imports from NI and RUK
We employ exactly the same method to derive Welsh imports from NI and England, i.e. the
matrices
M
WNI and in Figure 3b. The 3-region table gives us Welsh imports fromScotland,
RUK W
M
S W
M
, which are derived as explained in Section 3.1 using the output share method.Therefore we employ this method again to split NI from other RUK imports in the manner
described above for Scotland.
3. NI imports from Scotland, Wales and RUK
Again we employ the output share method explained in steps 1&2 and section 3.1 above. The
only difference is that in the case of NI we are starting with the 2-region case. we identify
imports from Scotland and from Wales –
M
NIS andM
WNI – using the output share method andtake imports from England as the residual – i.e. subtract
M
NIS plusM
WNI from the 2-regionversion of
M
NIRUK.4. Scottish exports to England
Figure 3b shows that once we have estimated NI imports from Scotland – i.e. matrix
M
NIS –in the 3-region case, we begin by calculating
M
ES as a residual matrix, by subtractingM
NISfrom the 3-region version of . However, once again this results in the problem of
negative entries. The alternative is to adopt the second approach outlined in Section 3.1,
where we take the residual vector of exports to the rest of the UK after
S RUK
M
S W
M
andM
NIS havebeen accounted for and distributing this across English production sectors. This is done using
the ratio of total exports to England from each Scottish sector, i, to total English use of UK
sector i outputs and apply this to each English production and final demand sector’s use of
UK sector i outputs.
5. Welsh exports to England
Welsh exports to England,
M
WE , in the 4-region table are calculated in exactly the same wayas outlined in Step 4. Again, the first method gives rise to the negative entry problem. Unless
we choose to make ad hoc adjustments to get rid of these, the second method, which is
consistent with the 2- and 3-region frameworks in terms of method, is used.
6. NI exports to England
The only difference in estimating the matrix
M
ENI of exports from NI to England is that weare starting with the 2-region case for NI so, if we choose the first method outline above, we
either need to subtract both
M
SNI andM
WNI (estimated in Steps 1 and 2) from the 2-regionversion of . However, again this gives rise to the negative entry problem, so the second
method is adopted.
NI RUK
M
7. The England-England use matrix
As in the 3-region case, the schematic illustration of the 4-region IO table in Figure 3b that
shows that after Steps 1-6 only one matrix remains to be calculated. This is the RUK-RUK
use matrix,
M
RUKRUK. In steps 4-6 we have determined the English Use matrices,M
ES,M
WE andNI E
M
showing English imports from the other three UK regions. Therefore, we can calculateE E
M
as the residual of the England-UK use matrix (i.e.M
EE=
M
UKE−
M
ES−
M
WE−
M
ENI).As in the single, 2-region (Section 2) and 3-region (Section 3) cases, the 4-region SAM takes
data from the 4-region IO table (Section 4.1), the NI-RUK 2-region SAM (Section 2.5) and
from income-expenditure accounts for each of the 4 regions. Here we need to: (a) split RUK
transfers in the Scottish, Welsh and Northern Ireland single region income-expenditure
accounts into transfers to and from the other 3 regions in each case; (b) create a new RUK
income-expenditure account for the 4-region case.
The approach taken is analogous to that explained in Section 3.2 for the 3-region SAM. We
begin by reallocating the existing net product and production tax row in the 4-region IO table
to allow taxes paid on goods and services to be recorded as going to the net commodity tax
and government accounts in the exporting region. As in the 3-region case for all except
England (which takes the place of RUK as the ‘balancing region’) we do this on the basis of
import shares, with the balancing entries in the Scottish, Welsh and NI rows being determined
by the distribution of exports to England from each of the other regions. Net P&P taxes paid
by England in England are the residual entries required to balance England to UK P&P taxes
minus all of the above.
The outstanding SAM entries, recording income transfers between the aggregate/institutional
transactors are determined using the income-expenditure account method. All intra-regional
transfers except the capital accounts and the England-England case, along with primary input
expenditures and flows to ROW link back to the 4-region IO, the 3-region SAM (Scottish and
Welsh entries) or the NI-RUK 2-region SAM. The additional income-expenditure account
data needed here are (a) inter-regional transfers and (b) intra-regional English transfers (i.e.
the residual after stripping NI out of RUK in the 3-region case).
As in the 3-region case, we only split transfers to and from England in the Scottish, Welsh
and NI accounts down by the other 3 regions in the case of the household and corporate
accounts. In the case of inter-governmental transfers (remember that all inter-regional
transfers, except capital, are intra-agent flows), we assume that these will be between the
devolved administrations of Wales and Scotland and central government located in England.
For the split in the English transfers in the household accounts, we adopt the same approach
as for RUK in the 3-region case (roughly speaking, on the basis of outflows of wage income
from each region). However, note, that in the absence of actual data, this is quite tricky and
extremely ad hoc. For the split in inter-regional transfers in the corporate account, this is done
In the case of the capital account, as in the single, 2- and 3-region cases, positive income
transfers from any one region into the capital account of another are not allocated as
capital-to-capital intra-agent transfers. Instead they are reallocated from the own-region capital
account entries for households, government and corporate based on the distribution of savings
across these transactors in the income-expenditure account of the home-region.
As with RUK in the 3-region case, the remaining intra-UK income transfers are between
English transactors. To determine these entries we again use the income-expenditure accounts
constructed for the UK national economy and take the England-England entries as the
residual after subtracting the corresponding NI entries from each RUK one in the 3-region
version.
As noted in Sections 2 and 3, all of the components of the 4-region SAM are available from
the corresponding author on request.
5.
Summary and conclusions
This paper has explained the methods used to develop a set of 2-region, 3-region and 4-region
IO and SAM accounts as the core database of the inter-regional computable general
equilibrium (CGE) model of the UK developed as part of the project ‘An Analysis of National
and Devolved Economic Policies’ undertaken as part of the ESRC Devolution and
Constitutional Change research programme.
The main problems are in terms of data availability. First, a major issue is the absence of
regularly produced analytical IO tables for the UK. The most recent set of tables are for the
year 1995 (National Statistics, 2002) and according to National Statistics there are no plans at
this time to produce analytical tables for any subsequent year. UK IO data is produced
regularly, but in the form of supply and use tables (SUT), the latter of which report all
(domestic and import) transactions in commodity-by-industry terms at purchaser prices. In
order to convert these to the format required for modelling (separately identifying domestic
and import transactions in symmetric, commodity-by-commodity or industry-by-industry
format at basic prices) we require data from the make matrix and other data on commodity tax
rates, distribution margins etc. However, none of these data are publicly available. Therefore,
the best we have been able to do is estimate a UK IO table for 1999 by mechanically rolling
The second major problem is with regional IO data. Only Scotland has regularly published IO
tables that use the same survey data source as used in UK IO accounts. Wales does produce
IO tables on a semi-regular basis by the Welsh Economic Research Unit at Cardiff Business
School. WERU do not have access to the same survey data used in UK and Scottish IO
accounting, relying instead on a separate survey carried out specifically for constructing the
Welsh IO tables. This raises the issue of consistency with other regional and national IO data
for the UK. However, the situation is even worse in terms of the English regions and Northern
Ireland where no IO accounts exist whatsoever. Therefore we have had to estimate a table for
Northern Ireland based on some region-specific data for aggregates but Welsh technical
coefficients to determine inter-sectoral transactions.
The third major problem is the absence of an official data on inter-regional trade at the
sectoral level and on income transfers within the UK. We have been able to draw on
experimental (and unpublished) data provided by the Scottish Executive and WERU on
imports-by-commodity from elsewhere in the UK to Scotland and Wales respectively that is
consistent with the IO tables in these regions. However, even if these data were to become
official they do not help us quantify trade linkages in the other direction (i.e. Scottish and
Welsh exports to other UK regions) or for the more regionally disaggregated level of analysis
References
Allan, G., Jamieson, F., McGregor, P.G., Swales, J.K. and Turner, K. (2004) ‘Three and
Four-Region Linear Modelling with UK Data: Some Preliminary Results’, forthcoming in
Strathclyde Discussion Papers in Economics
http://www.economics.strath.ac.uk/Research/Discussion_papers/discussion_papers.ht
ml
.
Bryan, J., Jones, C., Munday, M. and Roberts, A. (2004) ‘Welsh Input-Output Tables for
2000’, Welsh Economic Research Unit, Cardiff Business School, downloadable at
http://www.weru.org.uk/output.pdf.
Department for Enterprise, Trade and Investment (2002), “Northern Ireland Manufacturing
Sales and Exports Survey 1998/9-2000-01”, available to download at
http://www.detini.gov.uk/cgi-bin/downdoc?id=110.
Department for Enterprise, Trade and Investment (2003), “Northern Ireland Annual Business
Inquiry”, available to download at http://www.detini.gov.uk/cgi-bin/downdoc?id=329.
Ferguson, L., McGregor, P.G., Swales, J.K. and Turner, K. (2004) ‘The “environmental trade
balance” between Scotland and the Rest of the UK’, report of a project undertaken for the
Scottish Economic Policy Network, http://www.scotecon.net.
HM Treasury (2001), “Public Expenditure Statistical Analysis 2001-02”, available to
download at http://www.hm-treasury.gov.uk/media//BCCBC/32.pdf.
McGregor, P.G., Swales, J.K. and Turner, K. (2004) ‘The environmental ‘trade balance’
between Scotland and the rest of the UK: an inter-regional input-output and SAM analysis’,
forthcoming in Strathclyde Discussion Papers in Economics
http://www.economics.strath.ac.uk/Research/Discussion_papers/discussion_papers.html.
Miller, R.E. and Blair P.D. (1985), Input-Output Analysis: Foundations and Extensions,
Prentice-Hall.
National Statistics (2001) United Kingdom National Accounts: The Blue Book, published by
National Statistics (2001a), “Regional Account 1999: Part 1”, Economic Trends, No. 568,
available to download at
http://www.nationalstatistics.gov.uk/articles/economic_trends/Regional_Accounts_1999_Part 1.pdf.
National Statistics (2002) ‘United Kingdom Input-Output Analytical Tables, 1995’, Web
edition, downloadable at http://www.nationalstatistics.gov.uk.
National Statistics (2003), ‘Sub-regional gross value added and gross fixed capital formation’,
available to download at http://www.statistics.gov.uk/pdfdir/gva1003.pdf.
National Statistics (2004), ‘United Kingdom Input-Output Analysis: 2004 Edition’, available
to download at
http://www.statistics.gov.uk/downloads/theme_economy/Input_output_analyses_2004_Editio n.pdf.
National Statistics (2004a), Regional Trends, Volume 38, available to download at
http://www.nationalstatistics.gov.uk/downloads/theme_compendia/Regional_Trends_38/rt38. pdf.
Scottish Executive (2002) Input-Output Tables and Multipliers for Scotland 1999, published
by the Government Statistical Services. Downloadable at http://www.scotland.gov.uk/input-output.
Stone, R. (1961) ‘Input-Output And National Accounts’, OECD.
Turner K.R. (2002), ‘Modelling the Impact of Policy and Other Disturbances on
Sustainability Policy Indicators in Jersey: an Economic-Environmental Regional Computable
Table 1. Sectoral breakdown for the UK inter-regional framework
10 sector
Production sectors IOC
1 PRIMARY 1-7
2 MANUFACTURING 8-84
3 ELEC, GAS & WATER SUPPLY 85-87
4 CONSTRUCTION 88
5 WHOLESALE & RETAIL TRADE 89-92
6 TRANSPORT & COMMUNICATION 93-99
7 FINANCIAL INT & BUSINESS 100-114
8 PUBLIC ADMINISTRATION 115
9 EDUC, HEALTH & SOCIAL WORK 116-118
10 OTHER SERVICES 119-123
8 sector
Production sectors IOC
1 PRIMARY & UTILITIES 1-7, 85-87
2 MANUFACTURING 8-84
3 CONSTRUCTION 88
4 WHOLESALE & RETAIL TRADE 89-92
5 TRANSPORT & COMMUNICATION 93-99
6 FINANCIAL INT & BUSINESS 100-114
7 PUBLIC ADMIN., EDUC., HEALTH & SOCIAL WORK 115-118
8 OTHER SERVICES 119-123
3 sector
Production sectors IOC
1 MANUFACTURING 8-84
2 NON-MANUFACTURING TRADED 1-7, 85-87, 89-114, 119-123
3 NON-MANUFACTURINT NON-TRADED 88, 115-118
Figure 1a. Schematic Structure of the Scottish/RUK Inter-Regional Input-Output Table
SCOTLAND RUK ROW
Input to Intermediate demand Final demand Intermediate demand Final demand
Output from Scot sector i=1..10 Scot sector z=1..4 RUK sector i=1….10 RUK sector z=1..4 ROW export demand T Scot sector i.
O ixi Scottish local ixz Scottish local ixi RUK imports from ixz RUK imports from ix1 Scottish exports to
C int. demand matrix fin. dem matrix Scot Scot ROW (tourist and g&S)
S 10
K RUK sector i.
U ixi Scot imports from ixz Scot imports from ixi RUK local ixz UK local 1xi RUK exports
R 10 RUK matrix RUK matrix int. demand matrix fin. dem matrix to ROW
Primary ROW imp, prod/ 5xi Scot primary exp 5xz Scot primary exp 5xi RUK primary exp 5xz RUK primary exp 5x1 ROW primary exp
Inputs comm tax, VA
[image:28.595.93.525.330.461.2]Figure 1b. Actual structure and data sources for the Scottish/RUK Inter-Regional Input-Output Table
Scotland RUK ROW
Input toIntermediate demand Final demand Intermediate demand Final demand
Output from Scot sector i=1..10 Scot sector z=1..4 RUK sector i=1….10 RUK sector z=1..4 ROW export demand T Scot sector i.
O C X S S C s i(z,S) X S RUK C s i(z,RUK) c s i(ROW)
S 10 (Scot IO table) (Scot IO table) Estimated matrix MS
RUK Estimated matrix MSRUK (Scot IO table)
K RUK sector i.
U X RUK S C RUK i(z,S) X RUK RUK C RUK i(z,RUK) c RUK i(ROW)
R 10 Estimated matrix MRUK
S Estimated matrix M RUK
S (RUK use minus M S
RUK) (RUK use minus M S
RUK) (UK IO minus Scot IO)
Primary ROW imp, prod/ F(i,S) F(z,S) F(i,RUK) F(z,RUK) F(ROW)
Inputs comm tax, VA (Scot IO table) (Scot IO table) (UK IO minus Scot IO) (UK IO minus Scot IO) (UK IO table)
Figure 2a. Schematic Structure of the Scot/Wales/RUK Inter-Regional Input-Output Table
SCOTLAND WALES RUK ROW
Input to Intermediate demand Final demand Intermediate demand Final demand Intermediate demand Final demand
Output from Scot sector i=1..8 Scot sector z=1..4 Welsh sector i=1..8 Welsh sector z=1..4 RUK sector i=1….8 RUK sector z=1..4 ROW export demand
T Scot sector i.
O ixi Scottish local ixz Scottish local ixi Wales imports from ixz Wales imports from ixi RUK imports from ixz RUK imports from ix1 Scottish exports to
C int. demand matrix fin. dem matrix Scot Scot Scot Scot ROW (tourist and g&S)
S 8
ES Welsh sector i.
AL ixi Scot imports from ixz Scot imports from ixi Welsh local ixz Welsh local ixi RUK imports from ixz RUK imports from 1xi Wales exports
W 8 Wales matrix Wales matrix int. demand matrix fin. dem matrix Wales Wales to ROW
K RUK sector i.
U ixi Scot imports from ixz Scot imports from ixi Welsh imports from ixz Welsh imports from ixi RUK local ixz UK local 1xi RUK exports
R 8 RUK matrix RUK matrix RUK matrix RUK matrix int. demand matrix fin. dem matrix to ROW
PrimaryROW imp, prod/ 5xi Scot primary exp 5xz Scot primary exp 5xi Welsh primary exp 5xz Welsh primary exp 5xi RUK primary exp 5xz RUK primary exp 5x1 ROW primary exp
[image:28.595.57.554.536.704.2]Figure 2b. Actual structure and data sources for the Scot/Wales/RUK Inter-Regional Input-Output Table
SCOTLAND WALES RUK ROW
Input to Intermediate demand Final demand Intermediate demand Final demand Intermediate demand Final demand
Output from Scot sector i=1..10 Scot sector z=1..4 Welsh sector i=1..10 Welsh sector z=1..4 RUK sector i=1….10 RUK sector z=1..4 ROW export demand
T Scot sector i.
O
C X
S
S CSi(z,S) XSW CSi(z,W) XSRUK CSi(z,RUK) csi(ROW)
S 10 Scot-RUK (Scot IO) Scot-RUK (Scot IO) Estimated matrix MSW (step 2) Scot-RUK IO M S
RUK minus M S
W (step 3) Scot-RUK (Scot IO)
ES Welsh sector i.
AL X
W
S CWi(z,S) XWW CWi(z,W) XWRUK CWi(z,RUK) cWi(ROW)
W 10 Estimated matrix MW
S (step 1) Wales-RUK (Wales IO) Wales-RUK (Wales IO) Wales-RUK IO MWRUK minus MWS (step 4) Wales-RUK (Wales IO)
K RUK sector i.
U X
RUK
S C
RUK
i(z,S) X
RUK
W C
RUK
i(z,W) X
RUK
RUK C
RUK
i(z,RUK) c
RUK i(ROW)
R 10 Estimated matrix MRUK
S (step 1) Estimated matrix MRUKW (step 2) RUK use MRUK minus (M S
RUK + M
W
RUK) (step 5) UK IO - Scot IO - Wales IO
PrimaryROW imp, prod/ F(i,S) F(z,S) F(i,W) F(z,W) F(i,RUK) F(z,RUK) F(ROW)
Inputs comm tax, VA Scot-RUK (Scot IO) Scot-RUK (Scot IO) Wales-RUK (Wales IO) Wales-RUK (Wales IO) UK IO - Scot IO - Wales IO UK IO - Scot IO - Wales IO UK IO