FISCAL FEDERALISM AND FISCAL AUTONOMY: LESSONS FOR
THE UK FROM OTHER INDUSTRIALISED COUNTRIES
Julia Darby, Anton Muscatelli and Graeme Roy
University of Glasgow
September 2002
Introduction
The recent devolution reforms in the UK represent one of most fundamental changes to the Constitution in the 20th Century. However, the UK has not been alone in undertaking moves towards greater decentralisation. Whilst other countries have not necessarily followed the UK’s route of decentralisation through constitutional reform, many European countries (eg France, Spain and Italy) have introduced greater fiscal powers for regional and local authorities. A casual glance at the UK’s current position suggests that, in some respects at least, it still retains a highly centralised fiscal system. The degree of fiscal autonomy enjoyed by the UK’s constituent nations and local authorities is still limited compared to that in other OECD countries.
In the next section, we outline the division of spending responsibilities between different tiers of government in the OECD economies. Then we compare the degrees of fiscal autonomy, and assess whether further reform is warranted in the case of the UK. In subsequent sections, we consider how the mixed use of central grants, shared taxation and devolved taxation can impact on the objectives of efficiency and equity; discuss the extent to which different sub-central governments have autonomy on borrowing; and examine how fiscal federalism is evolving in different countries. The final section draws conclusions.
The Division of Spending Responsibilities between Jurisdictions
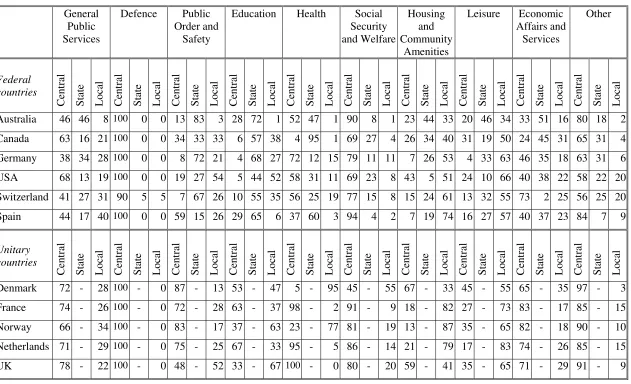
There are sharp differences between the OECD economies in the role played by regional and local government in the provision of public services (see Table 11). Even if one focuses solely on the EU economies, it is immediately apparent that some countries operate highly
decentralised systems for the delivery of public services. First, the differences between countries with ‘federal’ and ‘unitary’ structures is more apparent than real2. While some federations tend to assign major welfare (health, education and social welfare) functions to
1 European Communities (2001) uses figures based on countries’ own definitions, so data are not strictly
comparable across countries. The IMF data presented in Table 1 uses consistent definitions both across countries and over time. A caveat is that local expenditures mandated by central government, or spent on its behalf, appear as sub-central expenditures. This may overestimate the extent of decentralisation (see Ebel and Yilmaz, 2002).
2 Spain is not strictly a federation and is often referred to as a ‘quasi-federal’ or ‘regionalised state’ since the
Table 1: The Functional Distribution of Public Expenditure by Level of Government General Public Services Defence Public Order and Safety
Education Health Social Security and Welfare Housing and Community Amenities Leisure Economic Affairs and Services Other Federal countries Ce nt ra l Stat e
Local Cent
ra
l
Stat
e
Local Cent
ra
l
Stat
e
Local Cent
ra
l
Stat
e
Local Centr
al
Stat
e
Local Cent
ra
l
Stat
e
Local Centr
al
Stat
e
Local Cent
ra
l
Stat
e
Local Cent
ra
l
Stat
e
Local Cent
ra
l
Stat
e
Local
Australia 46 46 8 100 0 0 13 83 3 28 72 1 52 47 1 90 8 1 23 44 33 20 46 34 33 51 16 80 18 2 Canada 63 16 21 100 0 0 34 33 33 6 57 38 4 95 1 69 27 4 26 34 40 31 19 50 24 45 31 65 31 4 Germany 38 34 28 100 0 0 8 72 21 4 68 27 72 12 15 79 11 11 7 26 53 4 33 63 46 35 18 63 31 6 USA 68 13 19 100 0 0 19 27 54 5 44 52 58 31 11 69 23 8 43 5 51 24 10 66 40 38 22 58 22 20 Switzerland 41 27 31 90 5 5 7 67 26 10 55 35 56 25 19 77 15 8 15 24 61 13 32 55 73 2 25 56 25 20 Spain 44 17 40 100 0 0 59 15 26 29 65 6 37 60 3 94 4 2 7 19 74 16 27 57 40 37 23 84 7 9
Unitary countries Ce nt ra l Stat e
Local Cent
ra
l
Stat
e
Local Cent
ra
l
Stat
e
Local Cent
ra
l
Stat
e
Local Centr
al
Stat
e
Local Cent
ra
l
Stat
e
Local Centr
al
Stat
e
Local Cent
ra
l
Stat
e
Local Cent
ra
l
Stat
e
Local Cent
ra
l
Stat
e
Local
Denmark 72 - 28 100 - 0 87 - 13 53 - 47 5 - 95 45 - 55 67 - 33 45 - 55 65 - 35 97 - 3 France 74 - 26 100 - 0 72 - 28 63 - 37 98 - 2 91 - 9 18 - 82 27 - 73 83 - 17 85 - 15 Norway 66 - 34 100 - 0 83 - 17 37 - 63 23 - 77 81 - 19 13 - 87 35 - 65 82 - 18 90 - 10 Netherlands 71 - 29 100 - 0 75 - 25 67 - 33 95 - 5 86 - 14 21 - 79 17 - 83 74 - 26 85 - 15 UK 78 - 22 100 - 0 48 - 52 33 - 67 100 - 0 80 - 20 59 - 41 35 - 65 71 - 29 91 - 9
regional/state jurisdictions, others do not, or retain control over some key functions (eg Health in Germany and France and Social Security in all cases except Denmark). Some unitary countries, the Scandinavian countries, have extremely devolved systems. In Denmark, for instance, counties and municipalities accounted for 76% of all public sector staff in 1998, and 56% of total expenditure by the public sector (European Communities, 2001). Following the reform of local government in 1970, Danish municipalities have been responsible for a wide range of local services, ranging from primary education to care of the elderly and the distribution of benefit payments.
Even if one looks beyond the countries in Table 1 for which consistent data is available3, one finds that some federal EU countries retain a large amount of central control over these key functions (eg Austria) 4. Again, we find that some unitary countries have engaged in
considerable decentralisation. In Sweden, municipalities and counties undertake 35% of public sector spending, with medical care assigned mainly to county councils and education (up to secondary schooling) mainly to municipalities.
Second, a number of EU economies have moved toward greater decentralisation of spending. Again these data are only available on a consistent basis for some countries.
Table 2 shows that in Spain, for instance, the share of total government spending carried out by sub-central government rose from 28% in 1980 to 36% in 1997. There has been a major shift to assign spending to the regions (Autonomous Communities, ACs). Whilst functions such as health and education have progressively been devolved to ACs, many competencies
3 The surveys in European Communities (2001) use figures based on countries’ own definitions, so data are not
strictly comparable across countries. The data in Table 1 uses consistent definitions across countries and over time. One caveat remains: that local expenditures mandated by central government or spent on its behalf appear as sub-central expenditures, and this may overestimate the extent of decentralization (see Ebel and Yilmaz (2002)).
4 Austria, Italy and Sweden were omitted from Table 1 since the required breakdown by function is not available
remain shared between the four tiers of government (State, ACs, provinces and
municipalities). In Italy, regions were given greater powers in the 1970s and 1980s and now have primary responsibility over matters such as health, vocational education and training, economic development, public works and the environment5. In recent years, as we shall see below, there have been major changes in the 1990s to reform the financing of local
authorities, with a move towards greater fiscal autonomy. A similar, though less marked trend is visible in France, where there were considerable moves to devolve spending powers to regional and local authorities, though many services are provided in collaboration between tiers of government rather than assigned exclusively.6. In most countries, a more marked shift is evident in the share of sub-central expenditure on goods and services only.
Third, when compared to other EU countries, the UK has always had a lower than average degree of decentralisation of its spending functions (see Table 2). Whilst the nature of the lower tiers of government has changed with devolution, this has not greatly affected the degree to which expenditure is assigned to sub-national jurisdictions.
Economic theory suggests that allocating expenditure decisions close to the citizen will lead to a more efficient outcome, with local electorates being able to determine the allocation of public spending on different services in a way that best suits the local electorate.
This is what lies behind the Tiebout (1956) model of consumer choice, whereby consumers will choose to locate in jurisdictions that will provide them with the mix of public services that optimise their welfare. Oates’ (1972) classic work on fiscal federalism also suggests that jurisdictions should be designed, and the assignment of public expenditures should be carried out, in such a way that services are provided by the jurisdiction representing the smallest
5 Although this is not apparent from Table 2, because the most significant phase of decentralisation, from the
possible area over which the benefits are distributed. The notion is to combine the most efficient allocation of public goods whilst avoiding taste differences (Atkinson and Stiglitz, 1980).
Table 2: Sub-Central Government Expenditure as a Percentage of General Government Expenditure
Total Expenditure Expenditure on Goods and Services
Federal Countries 1985 1990 1995 lat
es
t
%
∆
1985 1990 1995 lates
t
%
∆
Australia 46 50 48 50 9 Australia 65 64 64 66 1
Canada 58 57 58 60 3 Canada 77 79 81 82 7
Germany2 40 40 38 35
-13 Germany 53 53 53 47 -10 Switzerland3 51 51 49 49 -4 Switzerland 36 58 60 63 77
USA 38 41 45 48 26 USA 67 64 63 61 -9
Spain 28 33 30 36 29 Spain 55 61 69 70 26
Unitary Countries 1985 1990 1995 lat
es
t
%
∆
1985 1990 1995 lates
t
%
∆
Denmark 54 54 54 56 4 Denmark 68 69 69 70 2
France 17 18 19 18 6 France 26 29 31 33 28
Italy .. .. 23 25 9 Italy .. .. 54 51 -6
Netherlands 32 28 28 26 -19 Netherlands 50 48 50 52 4
Norway 36 36 37 38 6 Norway 64 63 65 65 3
Sweden 38 39 33 37 -3 Sweden 76 76 70 72 -6
UK 29 29 26 25 -14 UK 41 42 40 39 -6
Source: IMF Government Financial Statistics, various issues Notes:
1 The figures for Switzerland relate to 1984 and 1991 rather than 1985 and 1990. The latest figure for each country the year is the same as that given in Table 1, except in the cases of Germany and Italy =1998, and Switzerland = 1999.
2 Expenditure on goods and services only excludes interest payments on debt, subsidies and transfers out of the government sector and capital expenditure, all of which are predominantly the responsibility of central government.
3 The %∆ column gives the percentage change in expenditure between 1985 and the latest date for which information is available.
In many respects the notion of ‘subsidiarity’, as proposed in the Maastricht Treaty and reasserted in the notion of bringing decisions as close as possible to the citizen in the
Amsterdam Treaty, relates closely to this concept of efficiency in public service provision. It also gives subsidiarity an additional dimension, as it is argued that proximity to the citizen promotes involvement by citizens in the democratic process. Although the EU Treaties laid down criteria for the relationship between the EU and its member states, since then the notion of subsidiarity has received further impetus, both within individual EU states and the EU’s Committee of the Regions. It is now generally accepted that a move towards decentralisation may lead to a better outcome in matching services to local preferences and in encouraging citizenship.
However, as noted by Pola (1999), it is difficult to disentangle the extent to which the raw measures of fiscal expenditure decentralisation in Tables 1 and 2 really reflect local decision-making. This is because official expenditure statistics on sub-national jurisdictions will sometimes include not only expenditure on functions assigned solely to that jurisdiction, but also ones where the local government is simply delivering a service that is effectively
not as providers of public services, but as local agencies of state policies, can even be seen in federal states such as the USA in areas such as education (see Tanzi, 2001).
Despite this caveat, the data seem to suggest that the UK does not offer its citizens a
significantly more centralised form of public service provision than its European neighbours. Indeed, in many respects (see Table 1) the UK has imposed a much greater consistency on the shape of its local government by explicitly allocating functions to different tiers of government, generally avoiding clashes of competencies. In some respects Scotland also benefits from the fact that the remit of the Scottish Parliament with respect to devolved expenditures is clearly defined. As a devolved region Scotland is also unique in having much more exclusive control of functions such as education and health when compared to many EU unitary states. There is a more marked difference between the UK and other EU countries in the degree and nature of fiscal autonomy granted to its sub-central governments.
Fiscal Autonomy: To What Extent should Sub-National Jurisdictions
Control their Revenues?
The Comparative Evidence
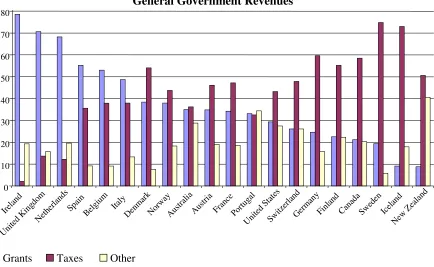
This is a much more controversial area and one where the practice has varied considerably both within the EU and the OECD. Traditionally the UK has financed most of the spending of its sub-national jurisdictions through grants. Figure 1 shows that the UK makes less use of taxation to fund regional and local government spending than most European countries (the exceptions are the Netherlands and Ireland, which are geographically much smaller). However, these data tell a very partial story on the degree of fiscal autonomy given to sub-national jurisdictions, as many other countries, including federal states like Germany and Austria, make extensive use of tax-sharing arrangements whereby regional and local
central government, arguably the joint taxes are very similar to a block grant. Countries with such arrangements give very limited fiscal autonomy to their regional or local governments. Also, it should be recognised that, even where the yield of local taxes is returned fully to the sub-central governments, central government may still be able to limit the degree to which this fiscal autonomy is exercised.
Figure 1: Composition of Sub-Central Government Revenues as a Percentage of General Government Revenues
0 10 20 30 40 50 60 70 80 Irelan d
United K ingdom
Nethe rland
s
SpainBelgium Italy Denm ark Norwa y Austra lia Austri a Fran ce Portu gal Unite d Stat
es Switzer land Germa ny Finlan d Cana da Swed en Iceland New Zeal
and
Grants Taxes Other
Source: IMF Government Financial Statistics 2001 Note: Figures relate to 2000 for Canada, Denmark and New Zealand; to 1999 for Australia, Austria, Sweden, Switzerland and the USA; to 1998 for Belgium, Finland, Germany, Iceland, Portugal, Norway, UK; and to 1997 for France and the Netherlands.
us to develop a fuller picture of the extent to which fiscal autonomy differs across OECD countries7.
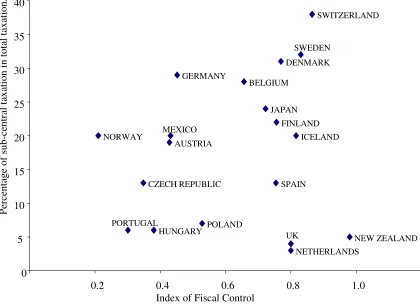
A number of measures are given in OECD (1999). First, they indicate the extent to which sub-central governments rely on their own taxes, which gives a measure of how important local taxes are in the total tax burden of citizens. Second, they show the degree to which sub-central governments control their own tax base or tax rates. The OECD classification system shows the percentage of sub-central taxation (by level of jurisdiction if there are more than two layers of government) which falls into one of eight categories of taxation. These range from type (a) sub-national taxes where the sub-central government can itself setboth the tax rate and tax base, to (e), where central government sets both the base and the rate of taxation. Category (d) captures tax-sharing arrangements, which in turn are divided into four
categories: these range from (d.1) where the sub-central government can determine the revenue split, to the other extreme in (d.4) where national government can unilaterally decide the revenue split.
In Figure 2, we summarise this evidence. The vertical axis plots the percentage of sub-central taxation in total taxation, so provides a measure of the importance of sub-central government in the financing of public services. The horizontal axis plots an overall index of ‘fiscal control’, which is an overall weighted index of the extent to which sub-central taxation is controlled locally. It follows that the countries closest to the north-east corner of the graph are those in which the sub-central governments have the greatest degree of fiscal autonomy:that is sub-national jurisdictions have control over a large share of total taxation and have greater control on taxation receipts.
7 Although this data still neglects some important issues. For instance, comparative data have not so far been
Figure 2: The Importance of Sub-Central Levels of Government and the Extent of Fiscal Control AUSTRIA BELGIUM CZECH REPUBLIC DENMARK GERMANY HUNGARY JAPAN MEXICO NETHERLANDS NEW ZEALAND NORWAY POLAND PORTUGAL SPAIN SWEDEN SWITZERLAND UK FINLAND ICELAND 0 5 10 15 20 25 30 35 40
0.2 0.4 0.6 0.8 1.0
Index of Fiscal Control
Percent age of sub-cent ral ta xat ion i n t ot al ta xat ion .
Source: IMF Government Financial Statistics and OECD (1999) Note: Figures relate to 1995. Details on the construction of the Index of Fiscal Control are given in the appendix..
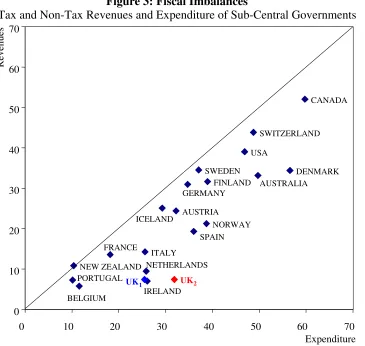
Figure 3: Fiscal Imbalances
Tax and Non-Tax Revenues and Expenditure of Sub-Central Governments
R evenues AUSTRALIA AUSTRIA BELGIUM CANADA DENMARK FINLAND FRANCE ICELAND IRELAND ITALY NETHERLANDS NEW ZEALAND NORWAY PORTUGAL SPAIN SWEDEN SWITZERLAND UK1 USA UK2 0 10 20 30 40 50 60 70
0 10 20 30 40 50 60 70
Expenditure
GERMANY
Source: IMF Government Financial Statistics Notes:
1. Revenues include taxes, fees and other sources of non-tax revenues but exclude grants. 2. The figures are expressed as percentages of general government totals. Transfers from central government to lower tiers of government are excluded from the general government figure. 3. The date for which each country’s data is plotted is given in the notes to figure 1.
in the revenue position since the Scottish variable rate of income tax (‘the tartan tax’) has not yet been employed). The graph shows that, amongst the unitary states, the UK relies mostly on grants and not on locally-raised revenues from taxes and fees. Apart from the federal states (Germany, Switzerland, the USA, Canada) unitary states such as Italy, France and the Scandinavian countries rely less than the UK on central government grants to finance their sub-central governments.
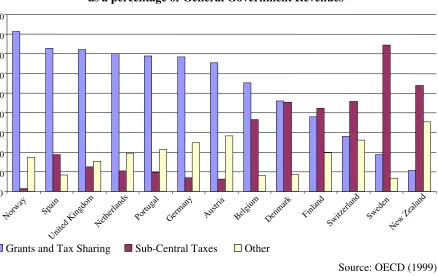
Figure 4: Composition of Sub-Central Government Revenues in 1995 as a percentage of General Government Revenues
0 10 20 30 40 50 60 70 80 90 Norw ay Spain
United K ingd
om
Nethe rland
s
Portugal Germ any Austr ia Belgiu m Denm ark Finland Switz erland Sweden
New Ze aland
Grants and Tax Sharing Sub-Central Taxes Other
Source: OECD (1999)
However, we should remember the caveat about tax sharing which also applied to Figure 1: no distinction is made in Figure 3 between taxes under the control of sub-national
compared to other countries. This is shown in Figure 4,8 which clearly indicates that Scandinavia, Switzerland and New Zealand possess the greatest degree of fiscal autonomy. Even when grants and tax sharing are treated as equivalent, most EU countries provide greater autonomy to their sub-central governments than the UK does.
Finally, the UK relies less than others on non-tax revenues (13%). These are mainly fees and charges on consumers for local and state government services. In this the UK is ranked lower, not only compared to federal States, but also compared with less-fiscally-devolved unitary states, such as Norway (17%). It is worth noting that devolution in the UK does allow the devolved authorities some margin to increase this reliance on non-tax revenues.
The Optimal Degree of Fiscal Autonomy: What Does Economic Theory Say?
The theory of fiscal federalism provides the following arguments for greater fiscal autonomy (Gramlich, 1984). First, it induces greater responsibility on local politicians. A reliance on central grants allows local politicians to lobby central governments for grants and might lead to allocation decisions that have little to do with economic efficiency. Second, a reliance on grants places little pressure on local administrators and politicians to manage local
government spending efficiently: it is not apparent, at the margin, that an additional pound spent in local services will be equal to the benefit of an equivalent reduction in taxation.
Is there evidence that sub-national governments behave inefficiently when they are in receipt of central grants? Some indirect evidence comes from the USA, where a considerable body of empirical evidence suggests that non-matching government grants have a much more
powerful impact on local spending than increases in local income (Gramlich, 1977, Courant
8 Unfortunately the data on tax sharing are not available for all countries (OECD, 1999), and therefore Figure 4
et al., 1981), a phenomenon which has become known as the ‘flypaper effect’ (ie grant money sticks where it hits). The usual economic explanation for this observation is that local politicians will not be compelled to cut taxes in response to increases in grant, but will
behave differently when local income increases and raises taxation yields. Although evidence on the ‘flypaper effect’ tends to be limited to federal countries where there is substantial fiscal autonomy, and therefore greater scope to test the hypothesis, it seems likely that local politicians tend to be more accountable with respect to local taxation decisions than centrally determined grant allocations. Unfortunately, beyond this indirect evidence, there is little comparative empirical evidence across OECD countries on whether there is over- or under-provision of public services, and on whether there are significant differences in willingness to pay taxes to fund public services between sub-central governments in the UK and in other comparable countries.
However, the literature on fiscal federalism also provides clear guidance on the limits that should be imposed on fiscal autonomy. Four arguments can be highlighted here. First, the usual argument against complete fiscal autonomy is one of equity9: jurisdictions with
different levels of income and wealth will have very different tax resources at their disposal, and the need to ensure that citizens have access to a roughly equal level of public services will imply some degree of redistribution between sub-central governments. For this reason no industrialised countries, not even federal states, have opted for complete fiscal autonomy. Redistribution can be achieved either through the use of transfers funded from general taxation, or through some kind of ‘pooling’ arrangement between the sub-central governments, or by implementing tax-sharing arrangements designed to benefit poorer
because they pre-date the post-1996 reforms.
9 We should distinguish the equity argument from that of insurance over the business cycle. Maintaining a
jurisdictions. The key point is that there is a trade-off between equity and accountability: if resources are shared equally between sub-central governments, the incentive effects from fiscal autonomy disappear. This has become one of the central issues that countries have faced in deciding on the appropriate level of fiscal autonomy for sub-central tiers of government.
The second argument against complete fiscal autonomy is that one has to avoid tax
externalities, in the interests of economic efficiency. ‘Tax exportation’ (McLure, 1967) is one such problem. If taxation decisions by sub-central governments impinge on non-residents, then local residents and politicians will not internalise the costs of public services and there will be a degree of over-provision. In essence the same problems caused by grants re-emerge. Of course, insofar as non-residents benefit from service provision, then there could be under-provision, a problem that often arises with large metropolitan areas and satellite towns. The way to deal with this problem is to ensure that different types of taxes are assigned to different levels of government so as to avoid tax exportation between sub-national
jurisdictions. Indeed, this is a key argument for not devolving natural resource taxation. The dangers arising from not centralising tax decisions on natural resources are two-fold: that it would lead to tax exportation; and that resource-rich regions and central governments would both seek to compete for the taxation revenues, leading to excessive taxation on the natural resource. For example, suppose that a royalty tax on oil and gas were assigned to the sub-central government, whilst the sub-central government could also tax the same natural resource through taxes on corporate profits. This leads to both tiers of government excessively taxing the same base.
capital and labour imposes natural limits on fiscal autonomy. This is why most decentralised taxation systems still assign the majority of ability-to-pay or redistributive taxes to central government, especially taxes such as corporation taxes, which fall on the most mobile factor, capital. Although income taxation tends to be used by sub-central governments in a large number of countries, both federal (eg USA) and unitary (eg Denmark, Italy and Sweden), the scope for this is either limited by law or by tax competition. Generally, sub-central
governments have to rely on benefit taxes or user charges (based on the benefit consumers derive from local services), taxes on immobile factors such as property, or small changes in ability-to-pay taxes (such as local income tax), which do not cause migration in the tax base.
Finally, a fourth argument against fiscal decentralisation is that it can generate administrative complexity. In essence, it is argued that managing a national tax system is feasible at lower cost and this implies that financing systems based on grants or tax-sharing arrangements are optimal. In fact, in the case of any modern developed economy, this is a spurious argument. There is no reason why one needs to decentralise the tax collection system, as evidenced by a number of OECD countries which manage the collection of taxes shared by different
jurisdictions through a single national tax collection system. However, clearly if a national collection system had to cope with a plethora of shared taxes between jurisdictions, this would increase administrative costs.
A subtler version of this argument relates to the problem of transparency and complexity in
decentralised tax systems. A complex tax system, where various jurisdictions share the same tax base, and where sub-central governments have important fiscal powers, can lead to less transparency in the fiscal system. Voters may find it difficult to understand fully the
To sum up, economic theory suggests that some degree of fiscal autonomy renders policy-makers more accountable, and could improve economic efficiency. Various commentators have also suggested that part of the crisis in democratic participation in local government elections in the UK is attributable to the lack of fiscal powers available to sub-central governments. For example, The Economist (2002) argues that the problem of democratic
participation in local and devolved government will not be solved if the proposed English regional assemblies are granted few economic powers. Whether voter interest will dwindle in devolved government in Scotland and Wales in the absence of further devolution of fiscal powers remains to be seen.
However, fiscal decentralisation is not without its problems. The choice of appropriate tax instruments for sub-central governments presents some problems in the light of issues such as: the mobility of factors of production across jurisdictions; the need to balance fiscal autonomy with some degree of revenue distribution between richer and poorer regions; and the need to avoid complexity. In the next section we examine some of the issues that have arisen in some other OECD countries, and the potential lessons for the UK from these experiences.
Some Features of Decentralisation in OECD Countries
Equity versus Accountability
crisis. Since 1992, this trend has been reversed, progressively greater fiscal autonomy has been granted to sub-central governments, and has been accompanied by a corresponding reduction in transfers. Between 1993 and 2000 a number of different tax reforms have been introduced, involving experimentation with various types of sub-central taxation, ranging from health taxes to a tax on business value added (IRAP)10 and an income tax (IRPEF) surcharge.
Despite this, vertical transfers through conditional grants are still an important feature of Italian public finances. One problem that has emerged in Italy is a clear tension between equity and accountability when spending functions relating to key public services have been devolved. The main areas of tension have been in health and transport, where the regions have key responsibilities for delivering services. Regional governments which overspent their budgets in these areas were effectively bailed out by central government. Thus, the system of vertical transfers rewarded high and inefficient sub-central governments. (To date, despite reforms in 1993 and 2000, the Italian government has found it almost impossible to reform the allocation of central grants to reflect objective factors rather than historic allocations, and to exclude the possibility of bail-out.)
As Bordignon (2000) and Bosi and Tabellini (1995) note, this led to a clear problem of ‘moral hazard’, with regions blissfully running spending overruns in key areas like health, knowing that the central government would bail them out. The Italian case is an extreme
10 Note that this is a tax levied on business value added, and not a regional VAT scheme, which would not have
example, due to the particular administrative framework11 that allowed budget overruns and a political situation that encouraged bail-outs. But it serves to illustrate that, if central
government is intent on maintaining the level of key public services, sub-central governments can exert real pressures on central government to increase vertical transfers, unless these are explicitly prohibited by law. This is particularly the case where there are overlapping
competencies in the provision of some public services, or where central government is seen by the electorate as responsible for the delivery of key services. Of course, central
government can always resort to using earmarked grants, thereby further eroding local
accountability. In essence, there appears to be a real trade-off between equity in the provision of public services and the accountability of devolved government.
The trade-off between equity and accountability is not only evident in countries like Italy that are trying to move towards a more federal structure. It is also apparent in counntries with mature federal systems, such as Germany. Post-war Germany has had in place a system of
horizontal equalisation aimed at equalising revenues between poorer and richer Länder (or
states). This system of equalisation, the Finanzausgleich, has been very successful in
maintaining a high degree of uniformity in public services throughout Germany. In 1997, following the incorporation of the East German Länder into the system, €6.1 bn was transferred from the richer to the poorer Länder, compared to only €1.5 bn in 1994. In addition to these horizontal transfers, in 1997 a number of federal grants were made to fiscally weaker Länder (€7.2 bn). Overall, 20% of Länder income came from grants, including transfer payments from the equalisation system. In 2001, a new agreement was
11 There are loopholes in sub-central borrowing limits in Italy, particularly in health and transport (see Bibbee
reached for the period 2005-19 which maintains a federal contribution of about €10 bn per year. Some observers have argued that the extent of equalisation has led to a lack of
accountability (see Spahn and Franz, 2000). But, despite a perceived need to incentivise the Länder to improve their economic performance and efficiency, equity remains the guiding principle of the new system.
Complexity and Transparency
If devolved government and fiscal autonomy is designed with the objective of increasing accountability, a complex system, where various jurisdictions compete for the same tax base, or where tax sharing is the norm, leads to far less transparency (Tanzi, 2001). As highlighted in Table 3, a number of jurisdictions in federal countries rely largely on tax-sharing
arrangements (local authorities and Länder in Austria and Germany, Communities in Belgium, provinces, municipalities and regions (Autonomous Communities) in Spain). The Spanish experience is of interest, as they sought to introduce much greater fiscal
autonomy for their sub-central governments, and particularly the Autonomous Communities (ACs) from 1993 onwards. In 1994 ACs relied on government grants or tax-sharing
(provinces and municipalities), which also depend on shared taxes, as well as a host of local fees and duties. Arguably, although it is still evolving, the Spanish system has given rise to a complex tax system, which achieves greater autonomy at the expense of less transparency.
Which Taxes should be Devolved?
Earlier, we highlighted the main principles which should guide fiscal devolution: ie that devolved taxes should not have a redistributive function; that they should pay some regard to the problem of factor mobility; and that tax exportation should be avoided. As might be expected, most OECD countries that have opted for a substantial degree of fiscal autonomy have tended to allow sub-central governments greater control over benefit taxes or user charges (mainly taxes or fees/charges for local services) and property taxes, with limited control on taxes on more mobile factors (income and profit taxation) but almost no control over the taxation of the extraction of natural resources (royalties or profit taxation).The only exceptions are the USA and Canada, which traditionally allowed states some discretion to set natural resource taxes. Resource-rich countries in the EU have not devolved taxes on natural resources.
Whilst some countries have devolved business taxes (Austria, Belgium, Germany, Italy, Spain, and Switzerland), these do not constitute a substantial share of regional/local revenues. These are countries where sub-central governments actually control local business tax rates or the tax base, i.e. they do not simply share in national corporate taxation revenues. Should the UK seek to grant more fiscal autonomy to its devolved authorities or to the English regions, it is unlikely that corporate taxation would be a serious candidate, given the mobility of capital.
12 ACs receive a block grant of 15% of the income tax collected in the region, except where expenditures
A more likely candidate is the greater use of local income taxes, a principle already embraced to a limited extent in the tartan tax. Currently a number of European countries have granted autonomy to their sub-central governments to set rates of personal income taxation. For example, in Belgium, income tax surcharges are used; in Denmark, Finland and Sweden, Italy and Switzerland regional/local government can set personal income tax rates; and in Spain, a more asymmetric system exists with some proportion of personal income taxation returned to the region of origin.
The Scandinavian experience is particularly instructive. In Denmark, the two tiers of sub-central government, counties and municipalities, account for about 60% of total spending. Own taxation constitutes a large share of total revenues for the counties and municipalities (in 1995 this was 82 and 76% respectively), only a small amount comes from shared taxation (see European Communities 2001) or block grants. However, block grants are used to enable some degree of horizontal equalisation. Whilst there are no formal limits to the size of local income taxes, in a small country the effective freedom to vary personal income taxation is limited by factor mobility. In addition, Denmark has operated a system of close budgetary co-operation between central and local government, through the Ministry of Finance. There were annual negotiations, involving a joint assessment of the budgetary requirements of
sub-central governments, based on no changes in tax rates. However, in 1998 a new four-year agreement was put in place. Thus, in theory the system combines a degree of local self-determination, with a considerable degree of co-ordination and bargaining, which tends to limit the changes to local tax rates.
on local authorities. From 1999-2001 actual income tax rate increases were about 1.5% (Daugaard, 2002) and since 1986 ‘unplanned’ tax rate increases have amounted to 4%, leading to a severe loss of credibility for the central government’s fiscal control. The surge in public consumption expenditure has been largely in areas such as childcare and care of the elderly (Daugaard, 2002). A second problem is that the small size of some of the
municipalities (their average population is 19,000 inhabitants) means that economies of scale in the provision of services cannot be exploited. Furthermore, some municipalities lack the professional administrative structures to carry out a wide range of public functions, ranging from the administration of social security benefits through to environmental protection. Overall, the problems in the Danish system are attributable to an excessive degree of
autonomy rather than to problems in the operation of a local income tax system. Many of the issues highlighted in recent reviews of the Danish public sector have pointed to problems of size of sub-central government and the assignment of expenditure functions.
Overall, it seems that some countries that have adopted local income taxation have encountered difficulties with ‘excessive taxation’. However, to a large extent this is attributable to problems in the efficient delivery of public services and the absence of effective tax competition. High personal income taxation is not a natural consequence of fiscal autonomy, as should be evident from the experience of countries such as the US and Switzerland. In a recent empirical study comparing federal and non-federal states, Keen (1997) shows that, in general, there is no evidence that income taxation is higher in states where both national and sub-national (state/regional) governments co-occupy the same tax base. For the reasons already explored, any increase in fiscal autonomy in the UK would probably require some form of local income taxation for regional government, and the experience of Scandinavia suggests that a limited system of additional taxation might be the
best way forward, combined with a system of horizontal equalisation.
The wider economic impact of Tax Competition: empirical evidence
The Scandinavian experience illustrates a key debate in the theory public finance: does decentralisation lead to smaller or bigger government, and what impact does it have on economic performance more generally? In setting out their ‘Leviathan hypothesis’, Brennan and Buchanan (1980) point out that factor mobility implies that decentralisation will lead to smaller government. Empirical evidence on this has been mixed at best (Oates, 1985),
larger public sectors. However, one caveat from Rodden’s study, as he himself notes, is that, despite the use of panel data, the results are still driven by observations from some key federal states, such as the US, Canada and Switzerland. Rodden also finds significant evidence in favour of a ‘flypaper effect’, which is consistent with the hypothesis that countries which rely more on central grants will have bigger public sectors.
Although one might try to infer some link between greater decentralisation and faster productivity growth, unfortunately it is difficult to find a formal statistical link between increasing fiscal autonomy/decentralisation and economic growth. As many other factors play a part in determining ‘catch-up’ in productivity, it is difficult to disentangle any effect due to greater autonomy. In an empirical study using panel data, Thiessen (2001) tries to establish a link between the degree of fiscal decentralisation and growth. As Thiessen recognises, the results are unlikely to be robust, given that the measure of fiscal
decentralisation is rather arbitrary; he finds an inverse U-shaped relationship, whereby an intermediate degree of decentralisation is optimal for faster growth. This is then attributed to the fact that excessive decentralisation may cause a loss of economies of scale in public service provision. Given the preliminary nature of this work, it would be too simplistic to argue that there is an optimal degree of fiscal decentralisation from the point of view of maximising economic growth.
Reforming Block Grants
In the UK, the rationale and future of the Barnett formula in allocating funding to the devolved authorities in Scotland, Wales and Northern Ireland has been the subject of
OECD countries have relied on the use of historic shares or needs-based assessment to set grants for sub-central governments. From our discussion so far, it should be apparent that even those countries where sub-central governments have considerable fiscal autonomy (e.g. Sweden, Finland,and Denmark) have retained some system of central grants in order to provide some system of horizontal equalisation. Whatever any future devolution reform holds for the UK, there is likely to be a continued reliance on central government grants, and a comparison with other countries is instructive. Given the limited space available, we will focus on a limited number of examples grant systemsin operation in other countries.
With very few exceptions, other European countries have moved away from formulae based on historic shares, such as the Barnett formulae, towards formulae that use objective
parameters that measure fiscal need and tax-raising capacity. Perhaps the only exception to this rule is Italy, where for political reasons it has been very difficult to move towards a formula based on objective indicators of needs and costs in different municipalities. As noted above, the 2000 reform of regional financing, involving a switch to a needs-based horizontal equalisation system (based on demographic factors and potential per capita revenues from regional taxation), is to be phased in over a long period of time.
The majority of other countries have made central government grants the centrepiece of some form of horizontal equalisation. We have already touched on the equity versus accountability trade-off raised by such equalisation schemes.
include both a self-financing equalisation mechanism anda grant payable to local authorities in which the tax base per capita is less than 90% of the national average. The amount of this second grant is based on expenditure need, and uses indicators such as pre-school and school-age population (under 6 years old, 6-17 years old) and the elderly population (75 years and over) to take account of the major costs of childcare, schooling and care for the elderly. In addition, there is a role for social indicators such as the proportion of single-parent families, the unemployment rate, and the non-EU immigrant population. In Spain, as fiscal autonomy has progressively increased, a variety of grant formulae have been put in place. For ACs, the most important of these is a tax-sharing grant based on expenditure needs, as measured by population size, personal income, and tax capacity. In the case of provinces and
municipalities additional criteria include surface area and school-age population.
In France, where fiscal autonomy is more limited and sub-central government (regions, departments and communes) rely for a third of their funds on central government grants, the main grant (Dotation Globale de Fonctionnement) uses objective factors based on need
(population, school population, tourist numbers, and fiscal capacity). Separate allocations are made for capital grants (Dotation Globale d’Equipement) which tend to match investment by
communes and departments, supporting local initiatives.
progress on the devolution agenda, such as regional government in England, will also bring the issue of needs assessments to the fore.
Borrowing Constraints and Local and Regional Government
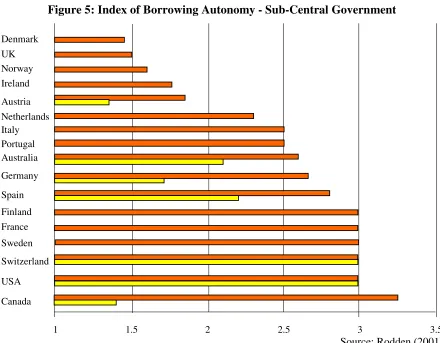
[image:30.595.71.511.295.638.2]The extent to which sub-national governments in different OECD countries can borrow also varies substantially. Figure 5, which plots an index of borrowing autonomy taken from Rodden (2001), shows that the UK imposes relatively strict controls on borrowing by sub-central governments.
Figure 5: Index of Borrowing Autonomy - Sub-Central Government
1 1.5 2 2.5 3 3.5
Canada USA Switzerland Sweden France Finland Spain Germany Australia Portugal Italy Netherlands Austria Ireland Norway UK Denmark
Source: Rodden (2001) Notes: The index is bounded between 1 and 5 where 1 = no borrowing autonomy and 5=high borrowing autonomy and the period assessed is 1986-1996 where feasible. The light bar relates to the local level of government where these figures are available. The darker bars relate to
state/regional level government.
authorities can only borrow for investment purposes, in proportion to their financial capacity, and subject to agreement by the Land’s interior ministry. Spain imposes similar limits to total debt service spending and only allows short-term borrowing to cover cash-flow requirements and long-term borrowing to finance public investment projects. It is interesting to note that there is sometimes little relation between the degree of decentralisation in spending and borrowing autonomy. For instance, in France regional and local authorities have considerable latitude in deciding how much to borrow for capital expenditure, although borrowing is not allowed to cover current expenditure or to refinance existing loans.
Another important point to note is that the Maastricht criteria, and subsequently the Stability and Growth Pact, have forced some countries to bring in greater controls over borrowing by sub-central governments. For instance, Austria introduced an ‘internal’ Stability Pact in January 1999 to help ensure that the overall deficit position for all levels of government does not exceed 3%. This is done by allowing very little margin for borrowing by sub-central tiers of government, who are only permitted to run an aggregate deficit of 0.3% of GDP. Italy has imposed a similar ‘internal pact’. One problem with such ad hoc solutions is that they might
place too my much of a constraint on public investment, as borrowing is typically only undertaken for capital projects. This is a well-known criticism of the EU Stability and Growth Pact in contrast to the ‘golden rule’ for borrowing adopted in the UK.
overspending is allowed via the Reserve13. However, if the UK is to adopt the Stability and Growth pactin the future, this may result in less flexibility for three-year spending plans.
A
symmetric and Multi-speed Reforms
Another feature of UK devolution is its asymmetric nature. The three devolved territories have been granted different political and economic powers. Whilst the blueprints for English Regional Government are not entirely clear, it is already apparent that the ultimate pattern of devolution in the UK will not be symmetric. This is explicitly recognised in Russell Barter (2000, p. 23), which in fact exalts this as a virtue of UK devolution:
“Not all regions need necessarily to have the same powers at the same time…Indeed the Council of Europe argue that time-lags may meet some regions’ needs to avoid taking on responsibilities they are not yet ready to bear”
The comparison with Italy is often made. There, five special status regions (Regioni a Statuto Speciale) havetraditionally had greater devolved powers. Spain is also a good example where
the three historic Basque Country territories: Alava, Guipuzcoa, Vizcaya, along with Navarra have their own special tax regimes and a separate economic agreement with central
government. In Finland, the thinly populated Åland region has separate political and budgetary powers.
However, Russell Barter (2000) does recognise some weaknesses in asymmetric devolution settlements. In Spain asymmetry has led to considerable administrative and fiscal complexity,
13 See HM Treasury (2002): "…the presumption is that departments and the devolved administrations will
contain pressures on their budget by re-allocating priorities, seeking offsetting savings and using unspent entitlements... The devolved administrations will be treated in the same manner as United Kingdom departments in decisions on access to the DEL Reserve…" (Section 9) "There is eligibility on EYF for DEL expenditure but AME expenditure is not eligible. The whole DEL assigned budget of each devolved administration will therefore be eligible for end-year flexibility... Breaches in DELs which materialise at the end of the year would be viewed by the United Kingdom Government as serious mismanagement on the part of the devolved
administration and the presumption would be that the following year's DEL and grant to the devolved
as noted above. Some political scientists (Le Galès and John, 1997) argue that
incrementalism carries with it considerable costs in terms of loss of momentum for reform. Of course, the opposite problem can also arise, with asymmetries leading to arguments for further change. In Italy, part of the federalist movement has been pushing for similar autonomies to be granted to all regions to bring the asymmetric treatment of regions to an end. Another risk is that, where some regions are granted greater powers because of historical reasons or cultural diversity, granting some regions greater powers than others may lead to tensions between regions, and then create difficulties in implementing horizontal equalisation systems. Even where asymmetric devolution settlements are justified for historical reasons (e.g. maintaining a separate Scottish education or legal system), our view is that these exceptions should be explicitly costed as part of a comprehensive regional financing system and that, apart from these exceptional factors, similar degrees of fiscal autonomy should be allowed to all future regional governments in the UK. This would then avoid the tensions that mightotherwise arise from a multi-speed path to devolution in some regions (e.g. the
Northern English regions) if they are granted much less fiscal powers than Scotland.
Conclusions
We have surveyed some of the experiences of the OECD economies in the area of fiscal decentralisation and fiscal autonomy andhave highlighted possible lessons for the UK as it considers the future path of its devolution process. In general, we can draw the following conclusions:
• Economists have traditionally seen some benefits in fiscal autonomy, on the grounds that it promotes efficiency in local government and accountability.
• However, the evidence from other countries is that fiscal autonomy is not costless. Conflicting competencies in spending, and competition over the tax base, can easily destroy some of the potential benefits of fiscal autonomy. This suggests that any fiscal decentralisation has to be carefully designed to be transparent, with clearly defined competencies for different jurisdictions.
• Most countries that have granted a greater degree of fiscal autonomy to its regions have done so through a greater delegation of taxes on immobile factors, on personal income, and through non-tax measures (fees and charges to consumers of local services). Devolving income taxationto sub-central government raises the problem of factor mobility in the absence of effective tax competition. However, in the case of the UK the limited evidence that exists (see Blow et al., 1996) suggests that migration may be less of a problem than some observers fear and, to date, there is little evidence from other OECD economies that small tax differentials have led to major movements in population.
• Any increase in fiscal autonomy will increase the need for some system of horizontal equalisation if a degree of equal access to public services is to be maintained. The evidence from other OECD countries is that such shifts in resources can be substantial, and this finding is also backed up by the limited evidence available for the UK (Blow et al., 1996).
• However, excessive degrees of fiscal equalisation (e.g. through full tax-sharing) can militate against the gains in accountability deriving from fiscal autonomy. Countries that have placed considerable emphasis on interjurisdictional solidarity (e.g. Germany and Italy) face problems in achieving a better balance between equity and fiscal
• The use of central grants as part of a horizontal equalisation scheme has to pay regard to both expenditure needs and fiscal capacity of local government. In general, the OECD has seen both greater movement towards fiscal autonomy, and a move towards the
assessment of local needs in determining grants. More transparent formula-based grant allocations are also likely to increase fiscal transparency.
What lessons emerge from the UK’s perspective? A major criticism of the UK’s current arrangements for devolved public finance is that they do not deliver either the benefits of accountability derived from assigning greater fiscal autonomy to the sub-central tiers of government, or the benefit of ensuring common levels of access to public services across the UK. In facing the trade-off between fiscal autonomy and equity, the UK has chosen a
References
Atkinson, A B and Stigilitz, J E (1980)Lectures on Public Economics, London: McGraw-Hill.
Bell, D N F (2001), ‘The Barnett Formula’, mimeo, University of Stirling. Bibbee, A and Goglio A (2002) ‘Public Spending in Italy: Policies to enhance its
effectiveness’, OECD Economics Department Working Paper, n.324, March, Paris: OECD. Blow, L, Hall, J and Smith, S (1996) ‘Financing Regional Government in the UK: some issues’, Fiscal Studies, 17(4), pp. 99-120.
Bordignon, M (2000) ‘Problems of Soft Budget Constraints in Intergovernmental
Relationships: The Case of Italy’, Inter-American Development Bank Working Paper, R-398, November.
Bosi, P and Tabellini, G (1995) ‘Il finanziamento di regioni ed enti locali’, Note della commisione tecnica sulla spese pubblica, Rome: Treasury Ministry.
Brennan, G, and Buchanan, J (1980) The Power to Tax: Analytical Foundations of a Fiscal Constitution, Cambridge: Cambridge University Press.
Courant, P N, Gramlich, E M and Rubinfeld, D L (1981) ‘The Stimulative Effects of Intergovernmental Grants: Or Why Money Sticks Where it Hits’, in: E M Gramlich (ed.) (1998) The economics of fiscal federalism and local finance, Elgar Reference Collection, International Library of Critical Writings in Economics, vol. 88. Cheltenham, pp. 127-43 Cuthbert, J (2001) ‘The effect of relative population growth on the Barnett squeeze’ FAI Quarterly Economic Commentary, May, pp.34-7.
Daugaard, S (2002) ‘Enhancing Expenditure Control with a Decentralised Public Sector in Denmark’, OECD Economics Department Working Paper, 320, February, Paris: OECD. Ebel, R and Yilmaz, S (2002) On the Measurement and Impact of Fiscal Decentralization. World Bank: Washington.
Economist (2002) ‘Local government: Tony’s watching you’, 4-10 May, pp. 29-30.
Gramlich, E M (1977) ‘Intergovernmental Grants: A Review of the Empirical Literature’, in: E M Gramlich (ed.) (1998), loc. cit., pp. 106-26.
Gramlich, E M (1984) ‘‘A fair go’: fiscal federalism arrangements’, in: E M Gramlich (ed.) (1998), loc. cit., pp. 419-62.
HM Treasury (2002) "Funding the Scottish Parliament,, National Assembly for Wales and Northern Ireland Assembly: A Statement of Funding Policy, July, 3rd Edition.
Keen, M J (1997) ‘Vertical tax externalities in the theory of fiscal federations’, IMF Working Paper, 97/173.
Le Galès, P, and John, P (1997) ‘Is the Grass Greener on the Other Side? What went wrong with French Regions, and the Implications for England’, Policy and Politics, 25(1), pp.51-60. McLure, C E (1967) ‘The Interstate Exporting of State and Local Taxes: Estimates for 1962’, National Tax Journal, 20(1) March, pp. 49-77.
Midwinter, A (2000) ‘Devolution and public spending: arguments and evidence’, Fraser of Allander Quarterly Economic Commentary, 25(4), pp.38-48.
Midwinter, A (2001) ‘Unworkable in Practice: A Critique of Full Fiscal Autonomy’, in: B Jamieson (Ed) (2001), Calling Scotland to Account: policy options for spending and taxation, Edinburgh: The Policy Institute, pp. 68-73.
Muscatelli, A (2001) ‘Life after Barnett: future options for fiscal devolution in the UK’, FAI Quarterly Economic Commentary, Vol 27(4), pp.33-38.
Oates, W E (1972) Fiscal Federalism, Harcourt Brace Jovanovich: New York.
Oates, W E (1985) ‘Searching for Leviathan: An Empirical Study’, American Economic Review, 75, pp.748-757.
OECD (1999) ‘Taxing Powers of State and Local Government’, OECD Tax Policy Studies, 1, Paris: OECD.
OECD (2001) ‘Tax and the Economy: A Comparative Assessment of OECD Countries’, OECD Tax Policy Studies, 6, Paris: OECD.
Rodden, J (2000) The Dilemma of Fiscal Federalism: Hard and Soft Budget Constraints around the World, mimeo., Cambridge, Mass: Massachusetts Institute of Technology. Rodden, J (2001) ‘Reviving Leviathan: Fiscal Federalism and the Growth of Government’, unpublished,Cambridge MA: MIT.
Russell Barter W (2000) Regional Government in England: A Preliminary Review of the Literature and Research Findings, Department of the Environment, Transport and the Regions.
Spahn, P B and Franz, O (2000) ‘Consensus Democracy and Interjurisdictional Fiscal Solidarity in Germany’, unpublished, University of Frankfurt.
STUC (2000) ‘Local Government Committee Inquiry into Local Government Finance’, Scottish Trades Union Congress, Glasgow.
Tanzi, V (2001) ‘Pitfalls on the Road to Fiscal Decentralization’,Carnegie Endowment for International Peace Working Paper, 19, Washington DC: Carnegie Endowment.
Thiessen, U (2001) ‘Fiscal Decentralisation and Economic Growth in High-Income OECD Countries’, European Network of Economic Policy Research Institutes Working Paper, 1, January.
Tiebout, C (1956) ‘A Pure Theory of Local Expenditures’, Journal of Political Economy, 64, pp. 416-424.
Appendix
Construction of the Index of Fiscal Control [as used in Figure 2]
The index of fiscal control comprises a weighted average index measuring the tax raising autonomy of state and local governments, multiplied by the magnitude of these respective taxation revenues. The information required to construct the weights is derived from OECD (1999).
Indicators of Tax autonomy Weight
State/Local government free to set both tax rate and tax base. 1
State/Local government free to set tax rate only. 0.8
State/Local government free to set tax base only. 0.6
State/Local government able to determine revenue-split in tax sharing
arrangement with higher levels of government. 0.5
Revenue split in tax sharing arrangement with higher level of government
requires consent of State/Local government. 0.4
Revenue split in tax sharing arrangement is fixed, but can be unilaterally altered by higher level of government.
0.3 Revenue split in tax sharing arrangement is determined by higher level of
government in their annual budget.
0.2 Higher level of government sets both tax rate and base. 0
For example:
For Poland, a country with a central and local government structure, 45% of taxation is in category (b), 1% category (c) and 54% category (d.3), the index is obtained as follows: Index of fiscal control = 0.45*0.8 + 0.01*0.6 + 0.54*0.3 = 0.528
Alternatively, for a country with a central, state and local government structure, eg. Switzerland the index takes account of the ratio of state vis-à-vis local taxation revenues: Communities: 0.97*0.8 + 0.03*0.3 = 0.785
Cantons: 0.89*1 + 0.06*0.4 + 0.05*0.3 = 0.929