This is a repository copy of Study of CO2 removal in natural gas process using mixture of
ionic liquid and MEA through process simulation.
White Rose Research Online URL for this paper:
http://eprints.whiterose.ac.uk/140070/
Version: Accepted Version
Article:
Akinola, T.E., Oko, E. orcid.org/0000-0001-9221-680X and Wang, M.
orcid.org/0000-0001-9752-270X (2019) Study of CO2 removal in natural gas process
using mixture of ionic liquid and MEA through process simulation. Fuel, 236. pp. 135-146.
ISSN 0016-2361
https://doi.org/10.1016/j.fuel.2018.08.152
Article available under the terms of the CC-BY-NC-ND licence
(https://creativecommons.org/licenses/by-nc-nd/4.0/).
[email protected] https://eprints.whiterose.ac.uk/
Reuse
This article is distributed under the terms of the Creative Commons Attribution-NonCommercial-NoDerivs (CC BY-NC-ND) licence. This licence only allows you to download this work and share it with others as long as you credit the authors, but you can’t change the article in any way or use it commercially. More
information and the full terms of the licence here: https://creativecommons.org/licenses/
Takedown
If you consider content in White Rose Research Online to be in breach of UK law, please notify us by
Study of CO
2removal in natural gas process using mixture of ionic liquid and MEA
1through process simulation
2Toluleke Emmanuel Akinola, Eni Oko, Meihong Wang
,*
3Department of Chemical and Biological Engineering, University of Sheffield S1 3JD 4
*Corresponding Author. Tel.: +44 114 222 7160. E-mail address: [email protected] 5
Abstract 6
There has been a shift to less carbon intensive fuels such as natural gas to meet energy demand due 7
to increasing pressure to cut CO2 emissions. This has prompted a need to assess unconventional and 8
contaminated natural gas reserves (which contains CO2 concentration of 20mol% or more). The CO2
9
capture process with MEA as the solvent is mostly adopted to treat contaminated natural gas. In this 10
study, the option of using a blend of ionic liquids (IL) and MEA as a promising solvent in the process 11
was investigated through modelling and simulation. A detailed rate-based model was developed for 12
both MEA (30wt%) solvent and IL (30wt%)-MEA (30wt%) blend using Aspen Plus® to assess both
13
process and economic performances. The 1-Butylpyridinium ([bpy][BF4]) ionic liquid was selected in
14
this study. The physiochemical properties of [bpy][BF4], predicted using Aspen Plus®, showed good
15
accuracy compared with experimental data. The results from this study showed about 15% and 7.44% 16
lower energy consumption in the reboiler duty and CO2 removal cost respectively with aqueous
17
[bpy][BF4]-MEA solvent compared to 30 wt% MEA solvent. It is concluded that the aqueous [bpy][BF4 ]-18
MEA solvent is therefore a promising solvent that could replace 30 wt% MEA solvent in this process. 19
Keywords: Natural gas processing, CO2 removal, Chemical absorption, MEA, Ionic liquid, Process 20
simulation 21
Abbreviations 22
ACC Annual Capital Cost
AOC Annual Operating Cost
[bpy][BF4] 1-butylpyridinium tetrafluroborate
[bheaa] Bis(2-hydroxyethyl) ammonium acetate
[bmim][BF4] 1-butyl-3-methylimidazolium tetrafluoroborate
[bmim][DCA] 1-butyl-3-methylimidazolium dicyanamide
CW Cooling Water
DEA Diethanolamine
DHVLB Heat of Vaporization at Tb
D&M Distribution and Marketing
Elec Electricity
ENRTL Electrolyte Non-Random Two Liquid
FC-CS The Fragment contribution – corresponding states
FOC Fixed Operating Cost
IL Ionic Liquid
IEA International Energy Agency
MDEA Methyldiethanolamine
MEA Monoethanolamine
Mis Miscellaneous
R&D Research and Development
RK Redlich Kwong
RKTZRA Rackett /Campbell-Thodos Mixture Liquid Volume
RTILs Room temperature ionic liquids
TSILs Task specific ionic liquids
VB Liquid Molar Volume at Tb
VOC Variable operating cost
VLSTD Standard liquid Volume
23
Nomenclature
C C Equation coefficients for (7)
C C Equation coefficients for (8)
Z and d Equation coefficients for (9)
A C Equation coefficients for (10)
C C Equation coefficients for (11) Equation coefficients for (12)
H Henry Constant
P Vapour pressure of component i, Pa
Pc Critical pressure, bar
Qreb Reboiler duty, kJ/kgco2
Qcond Condenser duty, kJ/kgco2
Qcooler Cooler duty, kJ/kgco2
T Temperature, K
Tb Normal Boiling temperature, K
Tc Critical temperature, K
Tr Reduced temperature, K
Vc Critical Volume, cc/mol
Wpump Pump power kJ/kgco2
Zc Critical Compressibility factor
24
1. Introduction 25
1.1 Background 26
The need to reduce emissions has favoured a shift towards low carbon fuels such as natural gas for 27
energy generation [1]. it is predicted that a switch to low carbon fuels will contribute about 15% in 28
expected CO2 emission cuts by 2050 [2]. Globally, mineable natural gas reserves are far smaller in
29
comparison to that of carbon intensive fuels (i.e. coal) and as such, natural gas supply is less secured 30
and expensive. This has prompted the need to re-assess the development of unconventional, stranded, 31
contaminated and sour natural gas reserves [3]. However, raw natural gas is known to contain acid gas 32
such as CO2 with concentration of about 20mol% and more, which makes these reserves economically
33
unviable. These natural gas reserves are predominantly in SE Asia, NW Australia, Central USA, North 34
Africa and the Middle East [4]. These locations are far from the established gas markets in Western 35
Europe, Japan and South Korea. Thus, a large amount of natural gas must be conveyed either via long 36
distance pipeline or as Liquefied Natural Gas (LNG) [3]. The presence of CO2 in natural gas limits its
37
quality (heating value) and the liquefaction process performance. 38
Natural gas sweetening technologies are adopted to remove CO2, so natural gas can meet acceptable
39
standards for pipeline transport to end-users and/or liquefaction process for LNG [5]. Natural gas 40
sweetening process involves CO2 separation from the gas mixture using techniques such as physical
41
absorption, chemical absorption, adsorption, cryogenic separation and membrane separation among 42
others [5]. Chemical absorption is the most commonly and widely used separation method in natural 43
gas sweetening processes [6, 7]. However, it is expensive especially due to the high energy penalty of 44
the process [8]. Thus, there is a need to explore different options for reducing the high-energy penalty 45
of the process. 46
1.2 Motivation 47
Amine-based CO2 absorption/desorption process has been in use for decades in the industry for CO2
48
removal from gas mixtures such as natural gas among others [3, 6, 9, 10]. This is primarily due to its 49
relatively rapid kinetics of the amine solvents [3, 6]. However, amine solvents generally require high 50
energy for regeneration. They also tend to stimulate equipment corrosion and degrade rapidly during 51
operation. This makes the operating cost for amine-based process generally high [6]. Thus, attention 52
has shifted to development of new solvents that have less energy requirement for regeneration and are 53
Liquid Viscosity, cP
Liquid molar density, mol/cc
Omega
Standard heat of formation, kJ/mol
Standard heat of combustion, kJ/mol
more stable, with less tendency to degrade and lower potential for stimulating corrosion. One of such 54
solvents is ionic liquids (ILs). 55
Ionic liquids (ILs) are generally classified as compound composed entirely of ions (cations and anions). 56
They tend to be liquids over a wide range of temperature and are non-volatile which makes them good 57
solvents for a variety of materials. The tunability capability of the ionic liquid makes it possible to tune 58
the ionic liquid structure to suit a specific process requirement by altering either the cation or anion. 59
Some of the commonly encountered cations and anions are shown in Fig.1. ILs requires less energy 60
for regeneration and are environmentally friendly solvents [5]. In addition, they are thermally stable and 61
have low vapour pressure among others. These qualities satisfy the requirements of a more energy-62
efficient solvent for CO2 absorption/desorption process than amine solvents [5, 11].
63
Several studies on the properties and application of various ILs for natural gas sweetening and carbon 64
capture through experimental investigations have been carried out [11-18]. From these investigations, 65
it was concluded that the use of ILs only as a solvent is less competitive when compared with MEA. 66
This is due to its low CO2 absorption capacity. In the quest to find a more competitive solvent, attention
67
has been given to functionalized ILs, supported IL membranes and polymerized ILs [5]. These ILs 68
formulation are considered more expensive than the traditional amine solvents [5]. Also, gas-liquid mass 69
transfer rates are low with ILs due to their high viscosities, resulting in a low reaction rate with CO2,
70
making them less competitive than amine solvents [5]. These reasons have made IL solvents currently 71
not industrially viable for CO2 absorption/stripping processes in a large scale [5]. On the other hand, the
72
option of blending ILs and amine solvents have shown a lot of promise [3, 5, 20]. This basically involves 73
merging an eco-friendly IL with the high binding capacity amines [5]. It has been shown that this option 74
requires less regeneration energy than conventional amine process, better process economics and 75
substantially higher gas-liquid mass transfer rates than only ILs [11]. 76
1.3 Previous studies 77
Use of IL-Amine blends for natural gas sweetening and carbon capture is driven by the need to develop 78
new solvents with a CO2 loading capacity comparable to the amine-based solvents and with great 79
reduction in the energy required for regeneration [11]. The section gives a review on the application of 80
82
Fig. 1 General Structure of various cations and anions used for Ionic liquid formulation [5] 83
Various researchers have carried out experimental investigations on the physical properties and 84
absorption capacity of IL-amine blend. Investigation by Camper et al.[20] on the solubility of CO2 in IL-85
amine blend revealed that the RTIL-amine (RTIL-MEA and RTIL-DEA) blends demonstrated rapid and 86
reversible CO2 capture performance, while the amine functionalised TSIL exhibited a slower CO2 87
capture performance due to its high viscosity. Similar investigation carried out by Feng et al.[21] showed 88
that temperature increase enhances the absorption rate. The influence of temperature on the absorption 89
rate is said to diminish after a long period. 90
study on CO2 solubility using two ILs blended with MEA ([bheaa]-MEA and [bmim][BF4]-MEA) by Taib 91
and Murugesan [22] demonstrated that CO2 solubility in MEA exhibit chemical solubility while the 92
solubility of CO2 in IL exhibits physical solubility, indicating that the CO2 removal mechanism can both 93
be physiosorption and chemisorption [23]. Further details on the mechanism analysis for both solvents 94
can be seen in Taib and Murugesan [22]. 95
Experiment studies on CO2 solubility and physical properties of IL-amine mixture highlighted the impact 96
of H2O and amine on the physical properties of the absorbents (particularly density and viscosity), 97
which enhances CO2 capture performance [24, 25]. The CO2 absorption capacity of the IL-amine blend 98
was mainly a function of amine concentration and the presence of water reduces the IL-amine blend 99
viscosity, which makes it an industrially viable solvent [24] 100
Further experimental investigation on IL-amine solvent revealed that the hybrid solvent achieved lower 101
energy consumption compared to conventional solvent [26] and demonstrated better corrosion control 102
solvents can be found in [28-31]. It can be seen that an industrially competitive hybrid solvent could be 104
developed by blending ILs with amine solutions to enhance the CO2 removal performance. 105
Studies involving whole process analysis of CO2 removal from gas mixtures using IL-based solvents 106
have also been reported [11, 26]. Despite the successful experimental investigations on the application 107
of IL-amine blends for CO2 removal, there have been little research on modelling and simulation of the 108
natural gas sweetening process/ carbon capture process using the hybrid solvent to our knowledge. It 109
is necessary that the thermodynamic model adopted accurately predict the hybrid solvent behaviour. 110
This will ensure accurate configuration and operation selection [5]. Huang et al.[32] predicted the critical 111
properties of various IL using the FC-CS method and then carried out thermodynamic modelling, 112
process simulation and cost estimation of CO2 removal (absorption) process from flue gas (6.37mol% 113
CO2, 69.46mol%N2, 3.66mol% O2, 20.51mol% H2O) [11]. In the study, three (3) ILs ([bmim][BF4], 114
[bmim][DCA] and [bpy][BF4] blended with aqueous MEA solution were investigated. The 115
physicochemical properties of the ILs were predicted by various temperature-dependent correlations. 116
The phase equilibria were modelled based on the Henry’s law and NRTL equation. The values 117
calculated agree well with experimental solubility data from literature. From the process simulation 118
assessment, the [bpy][BF4] –MEA hybrid solvent (with 30wt% IL and 30wt% MEA) process gave savings 119
of 15% and 11% regeneration duty and capture cost compared to the reference MEA based process. 120
Other studies on process analysis of gas mixtures using IL-based solvents includes [33, 34]. 121
1.4 Aim and Novelty 122
The aim of this study is to analyse CO2 removal from raw natural gas in the context of natural gas
123
sweetening using [bpy][BF4]-MEA mixture through modelling and simulation. [bpy][BF4] is selected
124
mainly due to its low cost [19] and low toxicity [35] compared to the imidazolium-based ionic liquids 125
which has been experimentally investigated successfully for removal of CO2.
126
In carrying out this study, we intend to carry out an energy and cost performance analysis for the IL-127
MEA process in comparison to the MEA only process. Ionic liquid-amine blends have been reported for 128
CO2 removal from power plant flue gases by Huang at al. [11]. However, CO2 removal from natural gas
129
presents a unique scenario involving higher operating pressure (up to 69 bar) and a mixture of light 130
hydrocarbons, namely methane, ethane, propane etc. This will affect the thermodynamics of the 131
process and mass transfer performance and possibly lead to results that are dissimilar to Huang et al. 132
[11]. Thus, it is necessary that a study dedicated to CO2 removal from natural gas be carried out in the
133
quest to discover a more energy efficient solvent to replace the amine based solvent. Physical 134
properties of the IL in this study were obtained from experimental data available in [13, 15, 17, 36]. 135
2. Process benchmark 136
2.1 Description 137
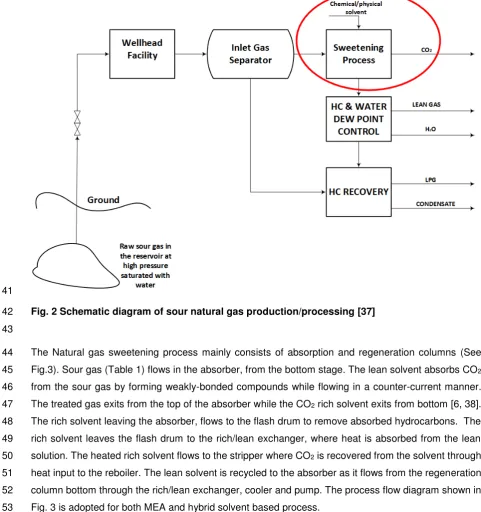
The process schematic for sour natural gas production and processing is shown in Fig.2. In this process, 138
sour gas coming from the production well flows through a separator to knock out condensates in the 139
141
Fig. 2 Schematic diagram of sour natural gas production/processing [37] 142
143
The Natural gas sweetening process mainly consists of absorption and regeneration columns (See 144
Fig.3). Sour gas (Table 1) flows in the absorber, from the bottom stage. The lean solvent absorbs CO2
145
from the sour gas by forming weakly-bonded compounds while flowing in a counter-current manner. 146
The treated gas exits from the top of the absorber while the CO2 rich solvent exits from bottom [6, 38].
147
The rich solvent leaving the absorber, flows to the flash drum to remove absorbed hydrocarbons. The 148
rich solvent leaves the flash drum to the rich/lean exchanger, where heat is absorbed from the lean 149
solution. The heated rich solvent flows to the stripper where CO2 is recovered from the solvent through
150
heat input to the reboiler. The lean solvent is recycled to the absorber as it flows from the regeneration 151
column bottom through the rich/lean exchanger, cooler and pump. The process flow diagram shown in 152
[image:8.595.41.523.82.595.2]154
Fig. 3 CO2 removal process Flow diagram [9]
155
156
3. Methodology 157
3.1 Model Development 158
The absorber and stripper model were developed using RADFRAC model in Aspen Plus®. RADFRAC
159
supports both equilibrium-based and rate-based approaches for mass transfer modelling. Models based 160
on both approaches were developed in this study. In the equilibrium-based model, the liquid and gas 161
phases are assumed to be in equilibrium [39]. On this basis, heat and mass transfer calculations are 162
then based on estimated efficiency parameters. The rate-based model on the other hand includes 163
detailed mass transfer calculations based on the two-film theory (Fig.4). The following assumptions 164
were made during the model development [39]: 165
Mixed flow regime 166
Negligible heat loss to the surroundings 167
N2 and hydrocarbon not readily soluble in IL and MEA
168
Chemical reactions are completed in the liquid film only 169
Table 1 Sour Gas Conditions (Obtained from HYSYS [40] with modifications) 170
Parameters Unit Value
Temperature ˚C 35
Pressure bar 69
Flowrate MMSCFD (Million Standard cubic feet per day) 25 Component
Nitrogen mol% 0.16
Water mol% 1.22
Parameters Unit Value
Ethane mol% 3.93
Propane mol% 0.93
Carbon dioxide mol% 20.00
171
172 173 174
[image:10.595.46.497.106.512.2]175
Fig. 4 Two-Film Theory [41] 176
177
3.2 Thermodynamic model 178
3.2.1 CO2 removal process with MEA
179
Thermodynamic modelling of the conventional CO2 removal process that involves physicochemical
180
properties, phase equilibrium and chemical reactions of the component system was carried out using 181
the Electrolyte Non-Random Two Liquid model (ELECNRTL). The ELECNRTL model is commonly used 182
for thermodynamic modelling of MEA scrubbing process [11, 39, 42] and has been verified through 183
industrial applications. The following are the set of chemical reactions considered for the system [6, 9]. 184
H O H O OH 1
H O HCO H O CO 2
H O MEA H O MEA 3
H O MEACOO MEA HCO 4
CO H O HCO HCO 5
185
lnk A BT ClnT DT 6
The reaction equilibrium constants as well as physiochemical properties (both scalar and temperature 187
dependent) of each component, binary parameters and electrolyte pairs were retrieved from the Aspen 188
properties databank. 189
3.2.2 CO2 removal process using [bpy][BF4]-MEA
190
3.2.2.1 Physicochemical properties 191
The properties of MEA are available in ASPEN properties databank as previously described. However, 192
there is little information on pyridinium based ionic liquid properties in the databank. Thus, the properties 193
of [bpy][BF4] were obtained from literature. The scalar properties of [bpy][BF4] such as the properties
194
were obtained from literature (Table 2). Aspen Plus simulation software was used to estimate other 195
relevant scalar properties of [bpy][BF4].
[image:11.595.68.515.442.587.2]196
Table 2 Scalar properties of [bpy][BF4] [17, 32]
197
Parameters Unit Value
Tb K 697.9
Pc bar 25.8
kJ/mol -1356.3
kJ/mol -5451
198
Temperature dependent properties of [bpy][BF4] such as heat capacity, molar volume, surface tension,
199
thermal conductivity were obtained using the following equations [11]: 200
Vapour pressure lnP C C
T C 7
Heat capacity C C C T C T 8
Molar Volume V RT Z d T
P 9
Viscosity ln A B
T C ln T 10
Surface tension C T T 11
Thermal conductivity 12
The Liquid heat capacity is a basic thermodynamic property used for specifying the amount of heat 201
needed to change a liquid temperature by a given amount while the molar volume is a transport property 202
used to describe the volume occupied by one mole of the component at a given temperature and 203
pressure. Given that ionic liquids are well known as a non-volatile liquid whose vapour pressure is 204
difficult to observe [11].Equation coefficients for (8) to (12) were estimated using data obtained from 205
literature [13, 15, 17, 36] on Aspen Plus® simulation software. 206
3.2.2.2 Phase Equilibria Modelling 207
Generally, the phase equilibrium of the CO2-H2O-[bpy][BF4]-MEA system was based on ELECNRTL
208
ASPEN properties databank except the pyridinium based IL. The solubility of N2 in [bpy][BF4] was
210
neglected [43]. The phase equilibrium relationship for CO2– [bpy][BF4] system was modelled as follows:
211
13
14
where is the infinite dilution activity coefficient of component in the mixture. Due to the low vapour 212
pressure of ILs, it is assumed that there will be no IL in the gaseous phase thus, the Henry’s law constant 213
of component is defined as: 214
15
where , , , and are Henry constant, total pressure, mole fraction of component in liquid 215
phase, activity coefficient of component in liquid phase and the fugacity coefficient in the vapour phase 216
respectively. Redlich-Kwong (R-K) equation of state was used to obtain the fugacity coefficient in vapour 217
phase as follows: 218
ln ln 16
17
18
19
20
where is the fugacity coefficient, is the compressibility factor, is the gas constant, and are 219
equation of state constants. , , are the Critical temperature, critical pressure and molar volume 220
respectively. The Henry’s constants of component in mixture were obtained by using the temperature 221
dependent henry constants equation shown below [11]: 222
lnH a b T c ln T d T 21
where aij – dij are the Henry constant binary interaction parameters. The liquid activity coefficient of CO2
223
in the mixture was modelled by the NRTL using (22): 224
lnY x x G
x G
x G x G
x G
x G 22
exp
where , , , , and are the binary interaction parameter, is the number of components 225
and is the mole fraction. The parameters of Henry constants and NRTL binary interaction parameters 226
between CO2 and [bpy][BF4] generated by Huang et al. [11] were inputted in ASPEN Plus® simulation
227
software. The parameters have been validated in Huang et al. [11]. 228
For the H2O-[bpy][BF4]-MEA system, VLE calculation was carried out based on the modified Raoult’s
229
law as follows: 230
23
Based on the assumption that the vapour mole fraction of [bpy][BF4] is negligible, (23) is simplified into
231
the following equations for both H2O-[bpy][BF4] and H2O-[bpy][BF4]-MEA;
232
24
25
where subscripts “a” and “c” denotes H2O and MEA respectively. [9] obtained the binary parameters of
233
[bpy][BF4]-H2O and [bpy][BF4]-MEA system from experimental data based on (24) and (25) in
234
combination with NRTL model (22). These binary parameters obtained were used in this study. 235
3.3 Process Simulation 236
Acid gas sweetening process models using aqueous MEA solvent and aqueous [bpy][BF4]-MEA solvent
237
were developed in Aspen Plus®. The composition of the solvents for each process are shown in Table
238
3. The Equilibrium based approach was basically adopted to estimate the column sizes. Under rate 239
based approach, Bravo et al.[44] correlation was used to estimate the mass transfer coefficient and 240
Interfacial area while the Chilton and Colburn correlation was used to estimate the heat transfer 241
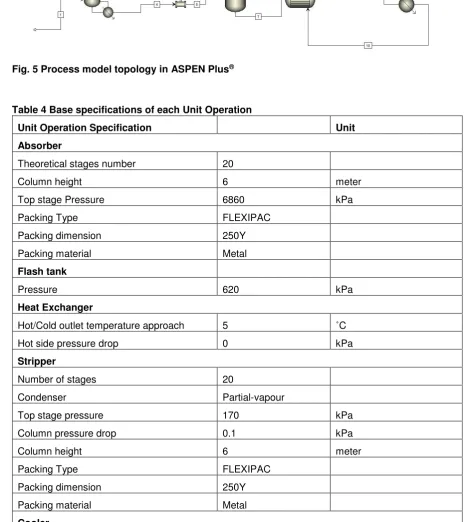
coefficients. Equipment specifications used in the process simulation are detailed in Table 4. The model 242
topology is given in Fig.5. 243
Both process models were simulated to achieve 1 mol% of CO2 at the absorber gas outlet and 95 wt%
244
CO2 concentration recovered from the stripper by manipulating the lean solvent flowrate and reflux ratio.
245
Table 3 Components and composition 246
MEA
H2O wt% 70
MEA wt% 30
IL-MEA
H2O wt% 40
MEA wt% 30
[Bpy][BF4] wt% 30
248
Fig. 5 Process model topology in ASPEN Plus®
249
250
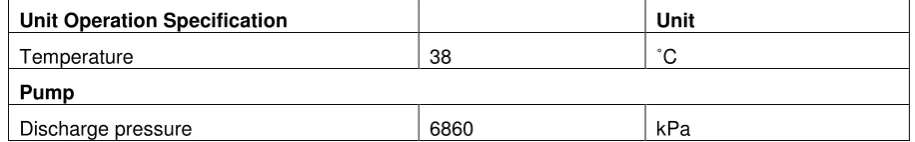
Table 4 Base specifications of each Unit Operation 251
Unit Operation Specification Unit
Absorber
Theoretical stages number 20
Column height 6 meter
Top stage Pressure 6860 kPa
Packing Type FLEXIPAC
Packing dimension 250Y
Packing material Metal
Flash tank
Pressure 620 kPa
Heat Exchanger
Hot/Cold outlet temperature approach 5 ˚C
Hot side pressure drop 0 kPa
Stripper
Number of stages 20
Condenser Partial-vapour
Top stage pressure 170 kPa
Column pressure drop 0.1 kPa
Column height 6 meter
Packing Type FLEXIPAC
Packing dimension 250Y
Packing material Metal
[image:14.595.60.531.223.746.2]Unit Operation Specification Unit
Temperature 38 ˚C
Pump
Discharge pressure 6860 kPa
252
3.3.1 Energy performance 253
The specific (reboiler) heat duty is a critical parameter to measure performance in the CO2 removal
254
process. The specific heat duty measures heat required in the reboiler to remove 1tonne of CO2. In this
255
study, the energy consumption from the energy utilizing equipment (pump and reboiler) were 256
considered to measure the energy performance of both MEA and [Bpy][BF4]-MEA based process. For
257
the reboiler, it is assumed that steam is supplied from the steam boiler at a pressure of 3 bar to achieve 258
reboiler temperature specification (120oC).
259
3.3.2 Cost Analysis 260
The cost of CO2 removed for both process, which depends on the annual capital and operational cost,
261
was estimated based on the breakdown adopted in [11, 45]. The equipment size selection and costing 262
was carried out using Aspen Process Economic analyzer software, based on the first quarter of 2013 263
chemical engineering plant cost index (CEPCI). The annual capital cost (ACC) is calculated as: 264
ACC TCC 26
where TCC is the total capital cost with an interest rate ( ) and project lifetime ( ) of 20% and 30years 265
respectively. A breakdown of the total capital and operational cost (fixed and variable cost) components 266
following [11, 45, 46] is detailed in Table 5. The cost of MEA and pyridinium based ionic liquid solvents 267
adopted for this study was 0.93 GBP/kg (1.25 USD/kg) and 4.88 GBP/kg (6.6 USD/kg) respectively [11, 268
[image:15.595.68.526.74.145.2]47]. 269
Table 5 Cost Estimation Breakdown 270
Capital Cost Breakdown (%) of Equipment Cost (EC)
Installed Cost 10% of EC
Instrumentation and Control 20% of EC
Piping 30% of EC
Electrical 5% of EC
Building and building Services 10% of EC
Yard Improvements 10% of EC
Land 5% of EC
Miscellaneous 2% of EC
Direct Cost (DC) Sum of the above
Engineering and Supervision (E&S) 15% of DC
Procurement Cost (PC) 2% of DC
Indirect Cost (IDC) E&S + C + PC
Fixed Capital Cost (FCC) DC + IDC
Working Capital (WC) 15% of FCC
Start-up Cost (SC) 1% of FCC
Initial Solvent Cost (ISC) Solvent circulation x cost
TCC FCC + WC + SC + ISC
Operating Cost Breakdown
Steam Utility Cost (£/GJ) 1.63
Cooling water Utility Cost (£/GJ) 0.157
Electricity Utility Cost (£/kWhr) 0.057
Make-up water Cost (£/kg) 0.00037
Make-up MEA Cost (£/kg) 0.925
Make-up IL Cost (£/kg) 4.884
Miscellaneous operating cost 2% of VOC
VOC Sum of the above cost
FOC Sum of the below cost
Local Tax (LT) 1% of FCC
Insurance 1% of FCC
Maintenance (M) 3% of FCC
Operating Labour (OL) £ 26.64 per hr
Lab Costs 20% of OL
Supervision 20% of OL
Plant Overheads 50% of OL
Operating Supplies 15% of M
Admin Cost 15% of OL
Distribution and Marketing 0.5% of OC
R&D Cost 5% of OC
Operating Cost (OC) VOC + FOC
3.3.3 Process Analysis 271
Analysis on the impact of pyridinium based ionic liquid concentration on the energy and cost 272
performance of hybrid solvent-based process was carried out. The mass fraction of [bpy][BF4] in the
273
hybrid solvent was varied while keeping the mass fraction of MEA constant. For each case considered, 274
the process was simulated to achieve 1 mol% of CO2 at the absorber gas outlet and 95 wt% CO2
275
4. Physiochemical Property Validation of [bpy][BF4]
277
Scalar properties and the coefficients of temperature dependent properties of [bpy][BF4] estimated
278
using Aspen Plus® simulation software are listed in Tables 6 and 7. The temperature dependent
279
properties estimated by Aspen Plus® gave a good prediction when compared with the experimental
280
data retrieved from literature as shown in Fig.6. 281
Table 6 Scalar Property Parameters of [bpy][BF4]
282
TC C 723.81
DHVLB J/kmol 6.54E+07
VB m3/kmol 0.23
RKTZRA 0.22
VLSTD m3/kmol 0.18
VC m3/kmol 0.82
ZC 0.26
PC bar 25.8
[image:17.595.68.526.319.717.2]283 284 285
Table 7 Temperature dependent parameter for [bpy][BF4]
286
Liquid Viscosity (N-sec/m2)
A -2.435E+03
B 1.618E+05
C 3.380E+02
Liquid Surface Tension (N/m)
C 7.040E+01
C 8.819E+01
C -4.431E+02
C 9.597E+02
C -7.821E+02
Liquid thermal conductivity (W/m-K)
1.292E+01
2.453E+04
3.949E-08
-2.020E-09
2.441E-12
Liquid heat Capacity (J/kmol-K)
C -2.435E+03
C 1.617E+05
C 3.380E+02
(a)
(c)
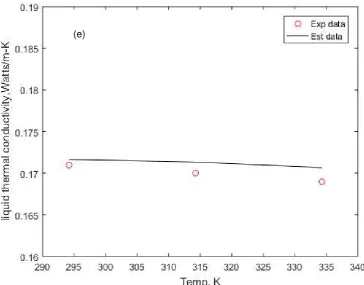
Fig. 6 Temperature dependent properties prediction for [bpy][BF4] using Aspen Plus (a) molar
288
volume (b) liquid viscosity (c) liquid surface tension (d) liquid heat capacity (e) liquid thermal 289
conductivity; circles and lines denoted experimental data from literature and estimated data [13,
290
15, 17, 36] respectively. 291
5. Performance comparison of MEA and [bpy][BF4]-MEA process
292
Performance evaluation of both MEA-based and [bpy][BF4]-MEA-based process was based on the
293
following performance index: energy performance, mass transfer within the absorber, make-up solvent 294
required, cooling water and CO2 removal cost. The summary of results for both process simulation is
295
shown in Table 8. 296
Table 8 key parameters result summary 297
Process Parameters Unit MEA [bpy][BF4]-MEA
lean solvent flowrate kg/hr 122931 129737
L/G kg/kg 4.37 4.61
CO2 lean loading kmol CO2/kmol solvent 0.18 0.11
CO2 Rich loading kmol CO2/kmol solvent 0.59 0.42
rich solvent temperature ˚C 80 76
Reboiler temperature ˚C 120 126
Specific heat duty GJ/tonne CO2 4.50 3.80
Pump Duty GJ/tonne CO2 0.12 0.11
Cooling Water tonne/hr 1958.59 1398.71
Make-up Solvent kg/tonne CO2 33.28 32.91
[image:20.595.70.525.558.764.2]298
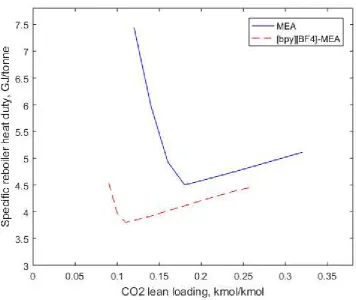
Fig. 7 Effect of CO2 lean loading on the specific reboiler heat duty requirement of MEA and
299
[bpy][BF4]-MEA.
300
301
5.1 Energy performance 302
The specific heat duty of MEA and [bpy][BF4]-MEA process was evaluated by varying CO2 lean loading
303
to achieve the minimum specific heat duty. The CO2 loading with minimum specific heat duty for both
304
process were compared. Fig. 7 shows the specific reboiler heat duty plot as a function of CO2 loading.
305
It can be seen that the specific heat duty decreases with increasing CO2 loading until it gets to its
306
minimum, and then a steady rise in the specific heat duty is observed as CO2 loading is increased
307
further. This is because at low CO2 loading, the heat duty is mainly governed by the latent heat of
308
vaporization. The latent heat reduces as the CO2 loading is increased until it is constant. The sensible
309
heat begins to have a dominant effect on the heat duty due to the increase in the solvent circulation 310
flowrate. The minimum specific heat duty was attained at a CO2 loading of 0.18 for MEA process and
311
0.11 for [bpy][BF4]-MEA based process.
312
It was observed that the specific heat duty required for [bpy][BF4]-MEA based process (3.80GJ/tonne)
313
is less than that required for a MEA based process (4.5GJ/tonne). This is attributed to reduction of latent 314
heat and heat capacity of the hybrid solvent in a reboiler. The reduced latent heat is as a result of 315
reduced concentration of water to vaporize in the hybrid ([bpy][BF4]-MEA) solvent. The presence of
316
[bpy][BF4] in the hybrid solvent reduces the heat capacity despite an increase in the solvent circulation
317
flowrate. 318
[image:21.595.93.450.87.387.2]320
Fig. 8 Energy Consumption for MEA (1) and [bpy][BF4]-MEA (2) based process
321
322
The energy consumption for each process is shown in Fig.8. This takes into consideration pump duty 323
in addition to the specific heat duty. It can be seen from Fig.8 that the reboiler accounts for the largest 324
share of energy consumed in both MEA and [bpy][BF4]-MEA process. From Table 8, the pump duty
325
required for the hybrid process is slightly similar compared to the MEA based process. This is because 326
solvent circulation flowrate required for [bpy][BF4]-MEA based process is similar compared to the MEA
327
based process with a percentage difference of 5.54%. The [bpy][BF4]-MEA based process is shown to
328
be more energy saving in the reboiler by 15 % than the conventional MEA based process. 329
5.2 Mass Transfer 330
The mass transfer performance of both process was evaluated by plotting the mass transfer rate of CO2
331
from the vapour phase to liquid phase in the absorber. As shown in Fig.9, both process gave a similar 332
mass transfer performance. Despite this, it was observed from Table 8 that the solvent circulation rate 333
for the MEA based process is slightly reduced by 5.54 % compared to the [bpy][BF4]-MEA based
334
process to achieve the same CO2 removal specification. This is attributed to the high viscosity,
335
molecular weight and density of the [bpy][BF4]-MEA solvent compared with MEA.
337
Fig. 9 CO2 mass transfer rate (kmol/hr) in the Absorber for MEA and [bpy][BF4]-MEA based
338
process 339
340
5.3 Make-up Solvent 341
The make-up solvent is measured as the kg of solvent per tonne of CO2 removed. From Table 8, the
342
make-up solvent needed for the [bpy][BF4]-MEA process is slightly lower than make-up needed for MEA
343
process. The make-up solvent is composed of mainly MEA and H2O. This is basically due to the low
344
vapour pressure of [bpy][BF4], which reduces degradation of the ionic liquid. Thus making make-up for
345
[bpy][BF4] negligible.
346
5.4 Cooling Water 347
The cooling water required for [bpy][BF4]-MEA based process and MEA based process takes into
348
consideration the cooling water required in condenser and cooler. The [bpy][BF4]-MEA process requires
349
less cooling water required compared with MEA process. The reduced amount of water vaporized in 350
the stripper reduces cooling water required in the condenser duty to achieve CO2 purity specification.
351
The cooling water required in the cooler is reduced for the [bpy][BF4]-MEA based process due to the
352
[image:23.595.96.485.88.404.2]354
Fig. 10 Beakdown of the Cost of CO2 removed for (1) MEA-based process and (2) [bpy][BF4
]-355
MEA based process 356
357
5.5 Cost Analysis 358
A breakdown of the cost of CO2 removed is shown in Fig.10. This includes the annual capital cost
359
(ACC), which is a reflection of mainly the equipment cost and initial solvent circulation cost, as well as 360
the operating cost, which include variable operating cost (VOC) and fixed operating cost (FOC). The 361
capital cost of the hybrid CO2 removal process is higher than the MEA based process by 2.48%. This
362
is due to the increase in initial solvent circulation rate and high cost of [bpy][BF4]. It was also observed
363
that steam cost mainly governs the process operating cost. From the study, the steam cost in the 364
[bpy][BF4]-MEA process was reduced by 15.55% compared with the MEA based process. Despite the
365
increased solvent make-up cost for the [bpy][BF4]-MEA based process, it was observed that the solvent
366
make-up cost accounts for small percentage (0.18% and 0.67%) of the total cost of CO2 removed for
367
both process. The low steam cost is reflected on the reduced total cost of CO2 removed in the [bpy][BF4
]-368
MEA based process (£19.98/tonne CO2) compared with the MEA based process (£21.58/tonne CO2).
369
This showed an energy saving cost of £1.6/tonne CO2 for [bpy][BF4]-MEA based process. Based on the 370
model result, 85,021 tonnes of CO2 is capture annually. This implies that a savings of £136,033.06 is 371
attained annually by adopting [bpy][BF4]-MEA solvent, indicating that the hybrid solvent-based process 372
is a cost-saving system. See Table 9 for details on the cost of CO2 removed.
373
[image:24.595.95.455.87.375.2]Table 9 Beakdown of the Cost of CO2 removed for (1) MEA-based process and (2) [bpy][BF4 ]-375
MEA based process
376
Cost MEA –based process
(£/CO2 removed )
[bpy][BF4]-MEA based
process (£/CO2 removed )
ACC
4.15 4.25VOC steam
7.33 6.19VOC water
0.67 0.45VOC electricity
1.91 1.80Make -up Solvent
0.04 0.13VOC Miscellaneous
0.20 0.17FOC
6.37 6.15Distribution & market
0.08 0.07R&D cost
0.83 0.75Total 21.58 19.98
6. Effect of [bpy][BF4] Concentration
377
Fig. 11 shows a plot on the effect of [bpy][BF4] Concentration on the L/G ratio of the absorber and
378
reboiler heat duty. The L/G ratio and specific heat duty reflects the solvent circulation rate and the 379
reboiler steam rate required to meet CO2 removal specifications. The concentration of [bpy][BF4] in the
380
hybrid solvent was varied 0wt% to 35wt%. 0wt% of [bpy][BF4] represents the MEA based process. It
381
was observed that an introduction of a small concentration (5wt%) of [bpy][BF4] slightly reduces the L/G
382
ratio but a further [bpy][BF4] concentration increase resulted to relatively steady rise in the L/G ratio.
383
Also, the specific reboiler heat duty reduces as the concentration of [bpy][BF4] is increased. This
384
indicates that less amount of steam, which basically governs the CO2 removal cost, is required in the
385
reboiler to meet the CO2 removal specification with increasing [bpy][BF4] concentration . This is
386
attributed to decreasing heat capacity of the hybrid solvent as with the presence of [bpy][BF4] in hybrid
387
solvent. 388
The plot in Fig. 12 shows the cost of CO2 removed (as annual capital (ACC) and annual operating cost
389
(AOC)) as a function of the concentration of [bpy][BF4]. This is to investigate the concentration of
390
[bpy][BF4] required in the hybrid solvent to achieve the minimum cost of CO2 removed. From Fig. 12,
391
The minimum cost of CO2 removed (£19.98/tonne CO2) was attained at 30wt% of [bpy][BF4]. This is
392
due to the reduced annual operating cost despite the increase in annual capital cost. It can be seen 393
from Fig. 12 that after 30wt% of [bpy][BF4], the cost of CO2 removed increases. This implies that the
394
significance of capital cost to the cost of CO2 removed increases because of the initial solvent cost
395
397
Fig. 11 Effect of [bpy][BF4] mass fraction on L/G (kg/kg) (dashed line) and Specific heat duty
398
(GJ/tonne CO2) (straight line) in the [bpy][BF4]-MEA based process.
399
[image:26.595.93.487.87.385.2]400
Fig. 12 Effect of [bpy][BF4] mass percentage on the Cost of CO2 removed
7. Conclusion 402
Application of IL-MEA process for CO2 capture from power plant flue gases has been [11]. Similar
403
investigation has not been performed for CO2 removal process in natural gas cleaning in operations.
404
This study aims to fill the gap by providing a comparative study of conventional MEA and IL-MEA based 405
process for natural gas sweetening through modelling and simulation. This study assesses the process 406
and energy performance of the hybrid (IL-MEA) solvent, which can replace the conventional amine as 407
the future solvent. 408
The physiochemical properties of IL ([bpy][BF4]) used in this study were estimated using Aspen Plus® .
409
The results were shown to agree well with the experimental data from literature. The [bpy][BF4]-MEA
410
based process with lean solvent composition of 30wt% MEA, 30wt% [bpy][BF4] and 40.0wt% H2O
411
showed an energy savings of 15% in the reboiler duty and a reduction of 7.44% in the cost of CO2
412
avoidance compared to the MEA (30wt%) based process. Despite the reduced solvent circulation rate 413
in the MEA based process and high cost of [bpy][BF4], the hybrid solvent-based process proved to be
414
more cost efficient. This is due to the reduced operating cost of the [bpy][BF4]-MEA based process as
415
result of the low utilities (majorly steam) cost. Further analysis on the effect of [bpy][BF4] concentration
416
on the process performance and cost of CO2 removed was carried out. An increase in the concentration
417
of [bpy][BF4] resulted in a rise in L/G ratio (solvent circulation rate) and a reduction in the overall energy
418
consumption. Also, the cost of CO2 removed is reduced with increasing [bpy][BF4] concentration. From
419
the economic analysis, the 30wt% concentration of [bpy][BF4] in the [bpy][BF4]-MEA based process
420
achieved the minimal cost of CO2 removed. Thus, [bpy][BF4]-MEA based solvent was able to achieve 421
an energy and cost-efficient capture process. 422
References 423
[1] Sims REH, Rogner H-H, Gregory K. Carbon emission and mitigation cost comparisons between 424
fossil fuel, nuclear and renewable energy resources for electricity generation. Energy Policy 425
2003;31(13):1315-26. 426
[2] Huaman RNE, Jun TX. Energy related CO2 emissions and the progress on CCS projects: a
427
review. Renewable and Sustainable Energy Reviews 2014;31:368-85. 428
[3] Rufford TE, Smart S, Watson GCY, Graham BF, Boxall J, da Costa JCD, et al. The removal of 429
CO2 and N2 from natural gas: a review of conventional and emerging process technologies.
430
Journal of Petroleum Science and Engineering 2012;94:123-54. 431
[4] Burgers WFJ, Northrop PS, Kheshgi HS, Valencia JA. Worldwide development potential for 432
sour gas. Energy Procedia 2011;4:2178-84. 433
[5] Kumar S, Cho JH, Moon I. Ionic liquid-amine blends and CO2 BOLs: prospective solvents for
434
natural gas sweetening and CO2 capture technology—a review. International Journal of
435
Greenhouse Gas Control 2014;20:87-116. 436
[6] Kidnay AJ, Parrish WR, McCartney DG. Fundamentals of natural gas processing. CRC Press; 437
2011. 438
[7] Liu X, Chen J, Luo X, Wang M, Meng H. Study on heat integration of supercritical coal-fired 439
power plant with post-combustion CO2 capture process through process simulation. Fuel 440
2015;158:625–33. 441
[8] Olajire AA. CO2 capture and separation technologies for end-of-pipe applications–a review.
442
[9] Kohl AL, Nielsen R. Gas purification. Gulf Professional Publishing; 1997. 444
[10] Das D, Meikap BC. Comparison of adsorption capacity of mono-ethanolamine and di-445
ethanolamine impregnated activated carbon in a multi-staged fluidized bed reactor for carbon-446
dioxide capture. Fuel 2018;224:47–56 447
[11] Huang Y, Zhang X, Zhang X, Dong H, Zhang S. Thermodynamic modeling and assessment of 448
ionic liquid-based CO2 capture processes. Industrial & Engineering Chemistry Research
449
2014;53(29):11805-17. 450
[12] Cadena C, Anthony JL, Shah JK, Morrow TI, Brennecke JF, Maginn EJ. Why is CO2 so Soluble
451
in Imidazolium-Based Ionic Liquids? Journal of the American Chemical Society 452
2004;126(16):5300-8. 453
[13] Bandrés I, Royo FM, Gascón I, Castro M, Lafuente C. Anion influence on thermophysical 454
properties of ionic liquids: 1-butylpyridinium tetrafluoroborate and 1-butylpyridinium triflate. The 455
Journal of Physical Chemistry B 2010;114(10):3601-7. 456
[14] Llovell F, Marcos RM, MacDowell N, Vega LF. Modeling the absorption of weak electrolytes 457
and acid gases with ionic liquids using the soft-SAFT approach. Journal of Physical Chemistry 458
B 2012;116(26):7709-18. 459
[15] Mokhtarani B, Sharifi A, Mortaheb HR, Mirzaei M, Mafi M, Sadeghian F. Density and viscosity 460
of pyridinium-based ionic liquids and their binary mixtures with water at several temperatures. 461
The Journal of Chemical Thermodynamics 2009;41(3):323-9. 462
[16] Supasitmongkol S, Styring P. High CO2 solubility in ionic liquids and a tetraalkylammonium-
463
based poly(ionic liquid). Energy and Environmental Science 2010;3(12):1961-72. 464
[17] Tomida D, Kenmochi S, Qiao K, Tsukada T, Yokoyama C. Densities and thermal conductivities 465
of N-alkylpyridinium tetrafluoroborates at high pressure. Fluid Phase Equilibria 2013;340:31-6. 466
[18] Torralba-Calleja E, Skinner J, Gutiérrez-Tauste D. CO2 capture in ionic liquids: A review of
467
solubilities and experimental methods. Journal of Chemistry 2013. 468
[19] Yunus NM, Mutalib MIA, Man Z, Bustam MA, Murugesan T. Solubility of CO2 in pyridinium
469
based ionic liquids. Chemical Engineering Journal 2012;189:94-100. 470
[20] Camper D, Bara JE, Gin DL, Noble RD. Room-temperature ionic liquid− amine solutions: 471
Tunable solvents for efficient and reversible capture of CO2. Industrial & Engineering Chemistry
472
Research 2008;47(21):8496-8. 473
[21] Feng Z, Cheng-Gang F, You-Ting W, Yuan-Tao W, Ai-Min L, Zhi-Bing Z. Absorption of CO2 in
474
the aqueous solutions of functionalized ionic liquids and MDEA. Chemical Engineering Journal 475
2010;160(2):691-7. 476
[22] Taib MM, Murugesan T. Solubilities of CO2 in aqueous solutions of ionic liquids (ILs) and
477
monoethanolamine (MEA) at pressures from 100 to 1600kPa. Chemical Engineering Journal 478
2012;181-182:56-62. 479
[23] Zhao Y, Zhang X, Dong H, Zhen Y, Li G, Zeng S, et al. Solubilities of gases in novel alcamines 480
ionic liquid 2-[2-hydroxyethyl (methyl) amino] ethanol chloride. Fluid Phase Equilibria 481
2011;302(1):60-4. 482
[24] Baj S, Siewniak A, Chrobok A, Krawczyk T, Sobolewski A. Monoethanolamine and ionic liquid 483
aqueous solutions as effective systems for CO2 capture. Journal of Chemical Technology and
484
Biotechnology 2013;88(7):1220-7. 485
[25] Zhao Y, Zhang X, Zeng S, Zhou Q, Dong H, Tian X, et al. Density, viscosity, and performances 486
of carbon dioxide capture in 16 absorbents of amine ionic liquid H2O, ionic liquid H2O, and
487
amine H2O systems. Journal of Chemical & Engineering Data 2010;55(9):3513-9.
488
[26] Yang J, Yu X, Yan J, Tu S-T. CO2 capture using amine solution mixed with ionic liquid. 489
Industrial & Engineering Chemistry Research 2014;53(7):2790-9. 490
[27] Hasib-Ur-Rahman M, Bouteldja H, Fongarland P, Siaj M, Larachi F. Corrosion behavior of 491
carbon steel in alkanolamine/room-temperature ionic liquid based CO2 capture systems.
492
[28] Khan SN, Hailegiorgis SM, Man Z, Garg S, Shariff AM, Farrukh S, et al. High-pressure 494
absorption study of CO2 in aqueous N-methyldiethanolamine (MDEA) and MDEA-piperazine 495
(PZ)-1-butyl-3-methylimidazolium trifluoromethanesulfonate [bmim][OTf] hybrid solvents. 496
Journal of Molecular Liquids 2018;249:1236-44. 497
[29] Khan SN, Hailegiorgis SM, Man Z, Shariff AM, Garg S. Thermophysical properties of aqueous 498
N-methyldiethanolamine (MDEA) and ionic liquids 1-butyl-3-methylimidazolium 499
trifluoromethanesulfonate [bmim][OTf], 1-butyl-3-methylimidazolium acetate [bmim][Ac] hybrid 500
solvents for CO2 capture. Chemical Engineering Research and Design 2017;121:69-80. 501
[30] Hailegiorgis SM, Khan SN, Abdolah NHH, Ayoub M, Tesfamichael A. Carbon dioxide capture 502
via aqueous N-methyldiethanolamine (MDEA)-1-butyl-3-methylimidazolium acetate 503
([bmim][Ac]) hybrid solvent. AIP Conference Proceedings. 1891. 2017. 504
[31] Zoubeik M, Mohamedali M, Henni A. Experimental solubility and thermodynamic modeling of CO2 505
in four new imidazolium and pyridinium-based ionic liquids. Fluid Phase Equilib 2016;419:67– 506
74. 507
[32] Huang Y, Dong H, Zhang X, Li C, Zhang S. A new fragment contribution corresponding states 508
method for physicochemical properties prediction of ionic liquids. AIChE Journal 509
2013;59(4):1348-59. 510
[33] Zacchello B, Oko E, Wang M, Fethi A. Process simulation and analysis of carbon capture with 511
an aqueous mixture of ionic liquid and monoethanolamine solvent. International Journal of Coal 512
Science & Technology 2017;4(1):25-32. 513
[34] Oko E, Zacchello B, Wang M, Fethi A. Process analysis and economic evaluation of mixed 514
aqueous ionic liquid and monoethanolamine (MEA) solvent for CO2 capture from a coke oven 515
plant. Greenhouse Gases: Science and Technology 2018;1-15.doi:10.1002/ghg.1772. 516
[35] Couling DJ, Bernot RJ, Docherty KM, Dixon JK, Maginn EJ. Assessing the factors responsible 517
for ionic liquid toxicity to aquatic organisms via quantitative structure–property relationship 518
modeling. Green Chemistry 2006;8(1):82-90. 519
[36] Zhang ZH, Tan ZC, Li YS, Sun LX. Thermodynamic investigation of room temperature ionic 520
liquid. Journal of thermal analysis and calorimetry 2006;85(3):551-7. 521
[37] Younger AH. Natural Gas Processing Principles and Technology-part 2. Gas Processors 522
Association, Tulsa Oklahoma 2004. 523
[38] Gpsa G. Engineering data book. Gas Processors Suppliers Association 2004;2:16-24. 524
[39] Lawal A, Wang M, Stephenson P, Koumpouras G, Yeung H. Dynamic modelling and analysis 525
of post-combustion CO2 chemical absorption process for coal-fired power plants. Fuel
526
2010;89(10):2791-801. 527
[40] Aspen HYSYS. Tutorials and Applications. Aspen Technology. Inc, Burlington, 528
Massachusetts,USA 2007. 529
[41] Chattopadhyay P. Absorption & Stripping. Asian Books Private Limited; 2007. 530
[42] Lin Y-J, Pan T-H, Wong DS-H, Jang S-S, Chi Y-W, Yeh C-H. Plantwide control of CO2 capture
531
by absorption and stripping using monoethanolamine solution. Industrial & Engineering 532
Chemistry Research 2010;50(3):1338-45. 533
[43] Jacquemin J, Gomes MFC, Husson P, Majer V. Solubility of carbon dioxide, ethane, methane, 534
oxygen, nitrogen, hydrogen, argon, and carbon monoxide in 1-butyl-3-methylimidazolium 535
tetrafluoroborate between temperatures 283K and 343K and at pressures close to atmospheric. 536
The Journal of Chemical Thermodynamics 2006;38(4):490-502. 537
[44] Bravo JL, Rocha JA, Fair JR. Mass transfer in gauze packings. Hydrocarbon Processing 538
1985;64(1):91-5. 539
[45] Karimi M, Hillestad M, Svendsen HF. Capital costs and energy considerations of different 540
alternative stripper configurations for post combustion CO2 capture. Chemical Engineering
541
[46] Mores P, Rodríguez N, Scenna N, Mussati S. CO2 capture in power plants: Minimization of the
543
investment and operating cost of the post-combustion process using MEA aqueous solution. 544
![Fig. 1 General Structure of various cations and anions used for Ionic liquid formulation [5]](https://thumb-us.123doks.com/thumbv2/123dok_us/1766439.130403/6.595.107.474.84.320/general-structure-various-cations-anions-ionic-liquid-formulation.webp)
![Fig. 3 CO2 removal process Flow diagram [9]](https://thumb-us.123doks.com/thumbv2/123dok_us/1766439.130403/9.595.63.523.72.375/fig-co-removal-process-flow-diagram.webp)
![Fig. 4 Two-Film Theory [41]](https://thumb-us.123doks.com/thumbv2/123dok_us/1766439.130403/10.595.46.497.106.512/fig-two-film-theory.webp)
![Table 2 Scalar properties of [bpy][BF4] [17, 32]](https://thumb-us.123doks.com/thumbv2/123dok_us/1766439.130403/11.595.68.515.442.587/table-scalar-properties-bpy-bf.webp)
![Table 7 Temperature dependent parameter for [bpy][BF4]](https://thumb-us.123doks.com/thumbv2/123dok_us/1766439.130403/17.595.68.526.319.717/table-temperature-dependent-parameter-for-bpy-bf.webp)